State’s Unemployment Rate Improved to 5.3%
Important Note: The employment data for the month of March 2026 comes from the survey week that included March 12. The release date for April 2026 data is scheduled for release on May 22.
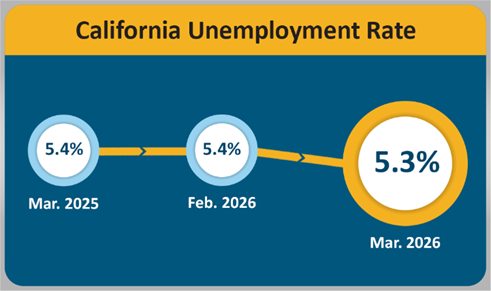
SACRAMENTO — California’s unemployment rate was 5.3 percent1 in March 2026, which is a 0.1 percentage point decline from the month prior. The State gained 28,700 nonfarm payroll jobs2 in March 2026 according to recent data released by the Employment Development Department (EDD) coming from two separate surveys. Total nonfarm employment for February was revised up (+1,100) to a total loss of 18,800 jobs for the month.
California's Labor Market, by the Numbers...
- Month over, the State's unemployment rate decrease of 0.1 percentage points mirrors that of the nation. Year over, the State’s unemployment rate declined by 0.1 percentage points whereas the nation experienced a 0.1 percentage point increase.
- California has added 91,700 jobs since the beginning of 2026, which averages out to more than 30,560 jobs added per month. It’s the strongest start to a calendar year since 2022.
- March’s decline in the number of unemployed Californians (-17,100) marks the fifth consecutive month of reductions with a total decline of 44,000 persons over that timeframe.
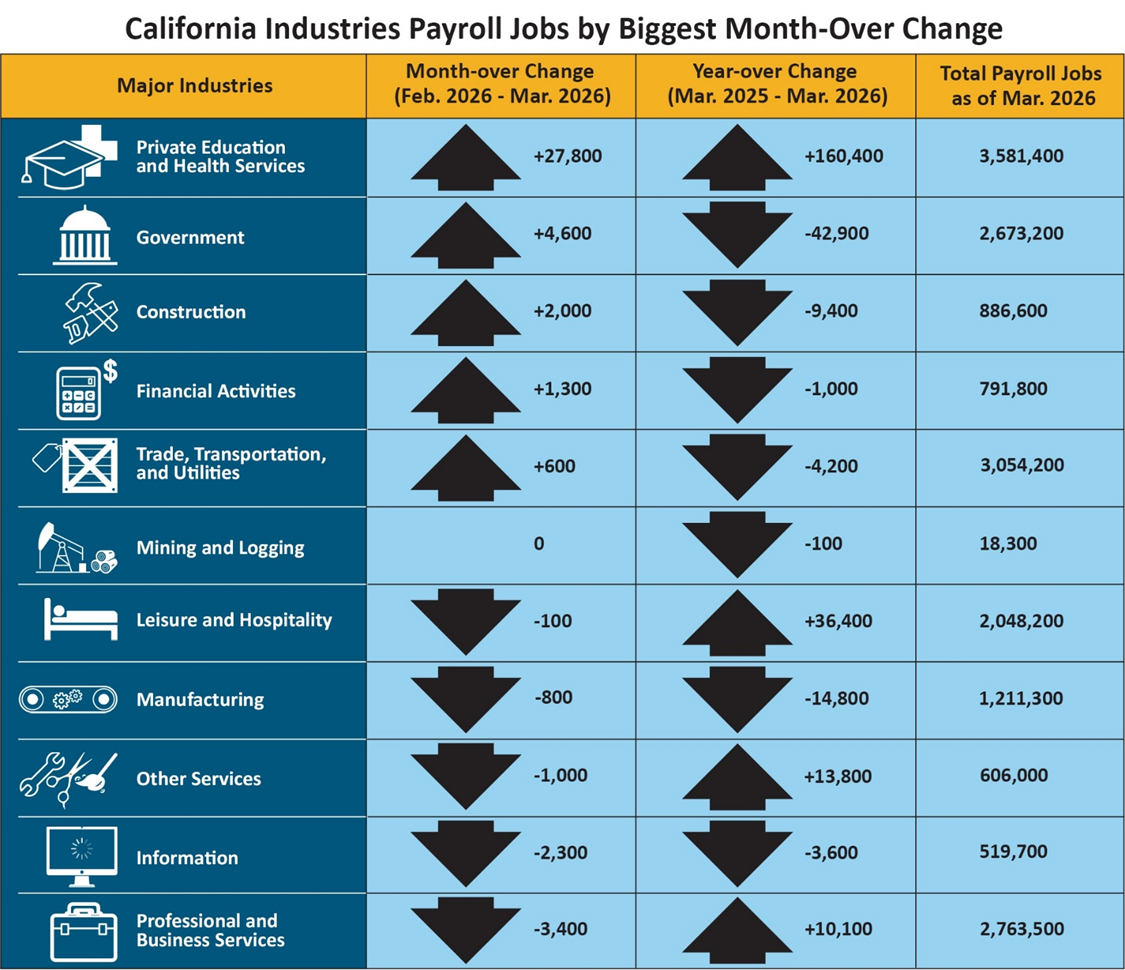
- Five of California's 11 industry sectors gained jobs in March, led by strong gains in Private Education & Health Services (+27,800) as a major strike affecting the sector ended. Offices of Other Health Practitioners, Nursing Care Facilities, and Individual and Family Services also showed noticeable gains.
- Professional & Business Services (-3,400) suffered the largest month-over loss for the State due to larger-than-usual drops in Computer System Design and Related Services, and Scientific Research and Development Services. Accounting, Tax Preparation, and Bookkeeping Services also experienced losses despite it being tax season at the time.
1. The unemployment rate comes from a separate federal survey of 4,400 California households.
2. The nonfarm payroll job numbers come from a federal survey of 80,000 California businesses.
Data Trends about Jobs in the Economy
Total Nonfarm Payroll Jobs (Comes from a monthly survey, seasonally adjusted, of approximately 80,000 California businesses)
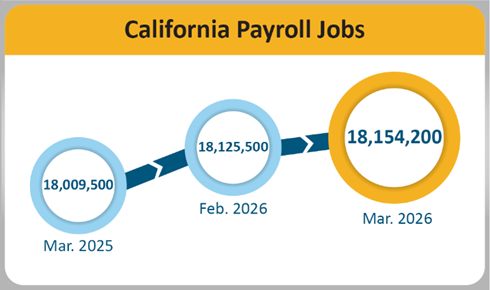
- Month-over — Total nonfarm jobs in California’s 11 major industries amounted to 18,154,200 in March – a gain of 28,700 from February. This followed February’s upward revision of 1,100 jobs, resulting in a month-over February loss of 18,800 jobs.
- Year-over — Total nonfarm jobs increased by 144,700 (0.8% percent increase) from March 2025 to March 2026 compared to the U.S. year-over gain of 260,000 jobs (0.16% percent increase).
| Industrias principales | Cambio mensual (Ene. 2025 - Feb. 2026) |
Cambio anual (Feb. 2025 - Feb. 2026) |
Total de empleos de nómina desde Feb. 2026 |
|---|---|---|---|
|
Gobierno |
+5,800 | -47,300 | 2,667,900 |
|
Servicios profesionales y empresariales |
+4,100 | +15,500 | 2,768,100 |
|
Información |
+2,400 | -8,100 | 522,300 |
|
Actividades financieras |
+1,500 | -3,300 | 790,400 |
|
Minería y tala |
0 | 0 | 18,300 |
|
Otros servicios |
-100 | +16,000 | 607,200 |
|
Construcción |
-900 | -10,300 | 884,500 |
|
Comercio, transporte y servicios públicos |
-1,500 | -2,700 | 3,052,900 |
|
Manufactura |
-2,400 | -17,700 | 1,211,900 |
|
Recreación y hotelería |
-4,700 | +38,000 | 2,048,500 |
|
Educación privada y servicios de salud |
-24,100 | +140,400 | 3,552,400 |
Total de empleos agrícolas – El número de empleos en la industria agrícola incrementó en 5,900 durante enero para un total de 414,400 en febrero. La industria agrícola tuvo 22,500 empleos más en febrero de 2026 que en febrero de 2025.
Tendencias de los datos sobre los trabajadores en la economía
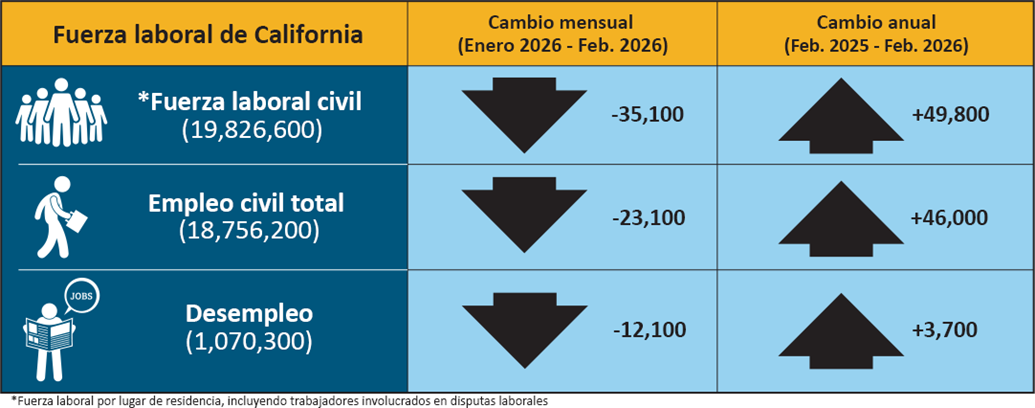
Empleo y desempleo en California (basado en una encuesta federal mensual a 4,400 hogares de California, la cual se enfoca en trabajadores en la economía).
- Empleados – El número de californianos empleados en diciembre fue de 18,756,200, un descenso de 23,100 personas desde enero y un aumento de 46,000 respecto a febrero de 2025.
- Desempleados – El número de californianos desempleados fue de 1,070,300 en enero, un descenso de 12,100 desde enero, pero un aumento de 3,700 comparado a febrero de 2025.
| Fuerza laboral de California | Cambio mensual (Ene. 2025 - Feb. 2026) |
Cambio anual (Feb. 2025 - Feb. 2026) |
|---|---|---|
| * Fuerza laboral civil (19,862,600) | -35,100 | +49,800 |
| Empleo civil total (18,756,200) | -23,100 | +46,000 |
| Desempleo (1,070,300) | -12,100 | +3,700 |
* Fuerza laboral por lugar de residencia, incluyendo a los trabajadores involucrados en disputas laborales.
Solicitudes del Seguro de Desempleo (sin ajustes por temporada)
Los siguientes datos provienen de una semana de muestra que incluye el día 19 de cada mes:
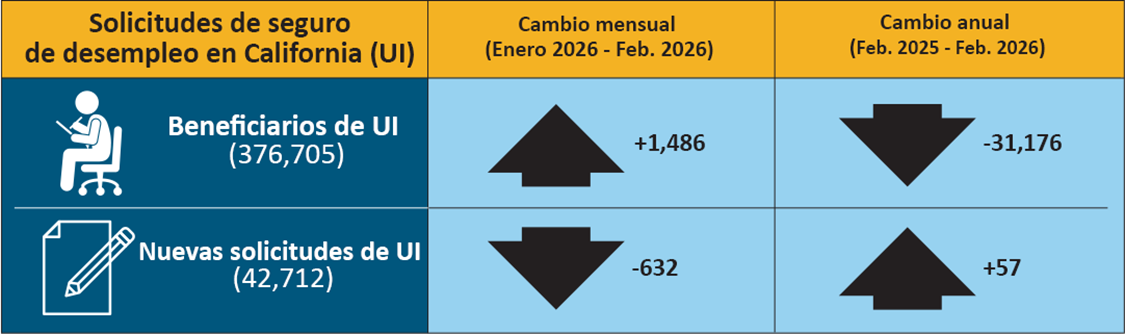
En datos relacionados que figuran dentro de la tasa de desempleo del estado, hubo 376,705 personas que certificaron para recibir beneficios del Seguro de Desempleo (UI, por sus siglas en inglés) durante la semana de muestra de febrero de 2026. Esto comparado a 375,219 personas en enero y 407,881 personas en febrero de 2025. Simultáneamente, se tramitaron 42,712 solicitudes iniciales en la semana de muestra de febrero de 2026, que registró un descenso mensual de 632 solicitudes registradas desde enero y un aumento anual de 57 solicitudes en comparación a febrero de 2025.
| Solicitudes del seguro de desempleo en California (UI) | Cambio mensual (Ene. 2025 - Feb. 2026) |
Cambio anual (Feb. 2025 - Feb. 2026) |
|---|---|---|
| Beneficiarios de UI (376,705) | +1,486 | -31,176 |
| Nuevas solicitudes de UI (42,712) | -632 | +57 |
|
CONDADO |
FUERZA LABORAL |
EMPLEO |
DESEMPLEO |
TASA |
| TOTAL ESTATAL |
19,740,400 |
18,655,800 |
1,084,600 |
5.5% |
| ALAMEDA |
867,700 |
828,500 |
39,200 |
4.5% |
| ALPINE |
600 |
560 |
40 |
7.0% |
| AMADOR |
14,970 |
14,030 |
950 |
6.3% |
| BUTTE |
91,400 |
85,500 |
5,900 |
6.4% |
| CALAVERAS |
17,660 |
16,470 |
1,180 |
6.7% |
| COLUSA |
11,660 |
9,540 |
2,120 |
18.2% |
| CONTRA COSTA |
582,600 |
555,700 |
26,900 |
4.6% |
| DEL NORTE |
9,350 |
8,730 |
620 |
6.6% |
| EL DORADO |
90,800 |
86,200 |
4,600 |
5.1% |
| FRESNO |
482,000 |
438,000 |
44,000 |
9.1% |
| GLENN |
12,020 |
11,070 |
940 |
7.8% |
| HUMBOLDT |
60,500 |
57,200 |
3,300 |
5.4% |
| IMPERIAL |
74,700 |
61,600 |
13,100 |
17.6% |
| INYO |
8,390 |
7,980 |
410 |
4.9% |
| KERN |
410,800 |
371,900 |
39,000 |
9.5% |
| KINGS |
60,000 |
53,900 |
6,100 |
10.2% |
| LAKE |
26,810 |
24,710 |
2,100 |
7.8% |
| LASSEN |
8,330 |
7,680 |
650 |
7.8% |
| LOS ANGELES |
5,096,300 |
4,813,400 |
282,900 |
5.6% |
| MADERA |
71,000 |
64,900 |
6,100 |
8.6% |
| MARIN |
124,200 |
119,200 |
5,000 |
4.1% |
| MARIPOSA |
6,850 |
6,350 |
500 |
7.3% |
| MENDOCINO |
36,790 |
34,470 |
2,330 |
6.3% |
| MERCED |
125,200 |
111,600 |
13,600 |
10.9% |
| MODOC |
3,010 |
2,730 |
280 |
9.3% |
| MONO |
8,510 |
8,160 |
350 |
4.1% |
| MONTEREY |
215,100 |
191,900 |
23,100 |
10.8% |
| NAPA |
73,900 |
70,500 |
3,400 |
4.6% |
| NEVADA |
47,760 |
45,420 |
2,350 |
4.9% |
| ORANGE |
1,619,500 |
1,554,300 |
65,200 |
4.0% |
| PLACER |
209,800 |
200,800 |
9,000 |
4.3% |
| PLUMAS |
7,270 |
6,500 |
780 |
10.7% |
| RIVERSIDE |
1,198,500 |
1,133,900 |
64,600 |
5.4% |
| SACRAMENTO |
789,500 |
749,800 |
39,700 |
5.0% |
| SAN BENITO |
34,800 |
32,300 |
2,500 |
7.3% |
| SAN BERNARDINO |
1,036,400 |
982,000 |
54,400 |
5.3% |
| SAN DIEGO |
1,666,500 |
1,590,800 |
75,700 |
4.5% |
| SAN FRANCISCO |
504,600 |
484,700 |
19,900 |
3.9% |
| SAN JOAQUIN |
376,200 |
350,700 |
25,500 |
6.8% |
| SAN LUIS OBISPO |
132,900 |
127,000 |
5,900 |
4.4% |
| SAN MATEO |
412,800 |
397,500 |
15,300 |
3.7% |
| SANTA BARBARA |
221,400 |
209,800 |
11,600 |
5.2% |
| SANTA CLARA |
1,035,100 |
993,100 |
42,000 |
4.1% |
| SANTA CRUZ |
137,300 |
127,400 |
9,900 |
7.2% |
| SHASTA |
82,200 |
77,300 |
4,800 |
5.9% |
| SIERRA |
1,370 |
1,290 |
80 |
6.0% |
| SISKIYOU |
16,140 |
14,590 |
1,550 |
9.6% |
| SOLANO |
219,600 |
207,800 |
11,800 |
5.4% |
| SONOMA |
247,600 |
236,600 |
11,000 |
4.4% |
| STANISLAUS |
256,400 |
237,500 |
18,900 |
7.4% |
| SUTTER |
46,200 |
41,500 |
4,700 |
10.1% |
| TEHAMA |
27,340 |
25,560 |
1,780 |
6.5% |
| TRINITY |
5,550 |
5,160 |
380 |
6.9% |
| TULARE |
221,800 |
196,200 |
25,600 |
11.5% |
| TUOLUMNE |
22,010 |
20,750 |
1,260 |
5.7% |
| VENTURA |
423,200 |
403,100 |
20,100 |
4.8% |
| YOLO |
113,400 |
106,400 |
7,000 |
6.2% |
| YUBA |
36,400 |
33,700 |
2,700 |
7.3% |