NR No. 24-43
Contact: Loree Levy/Greg Lawson
916-654-9029
mediainquiries@edd.ca.gov
Important Note: The employment data for the month of November 2024 comes from the survey week that included November 12. Data for December is scheduled for release on January 24, 2025.
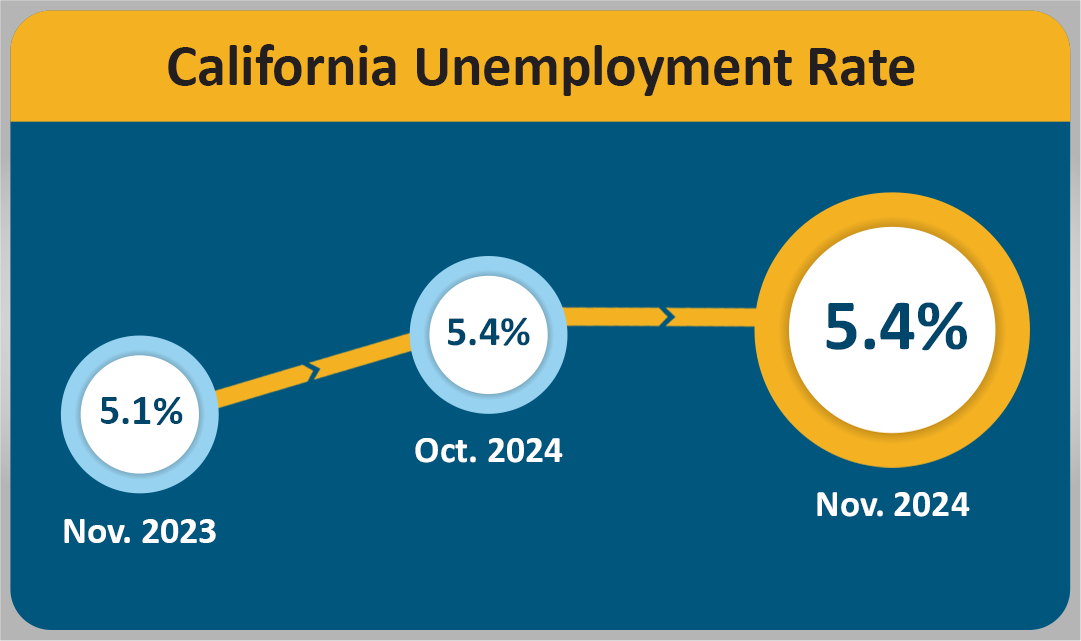
Unemployment Rate Remains 5.4 Percent in November
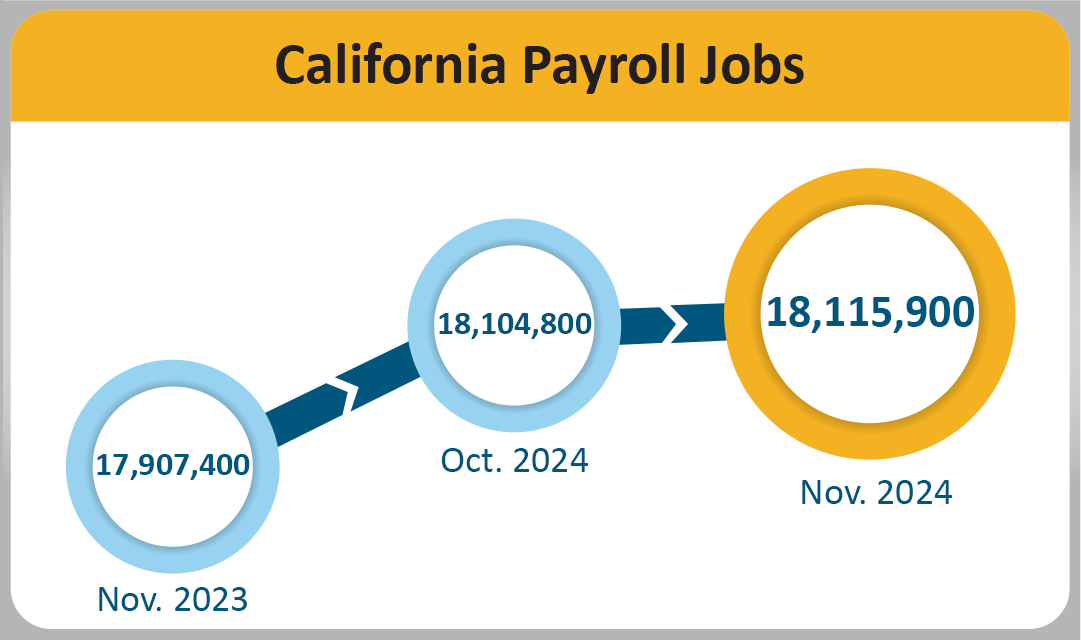
SACRAMENTO – California gained 11,100 nonfarm payroll jobs1 in November 2024 and the unemployment rate stayed at 5.4 percent2, according to the latest Employment Development Department (EDD) data. October’s job numbers were revised up to a 9,100 job gain following the receipt of more responses after the survey collection week.


California's Labor Market, by the Numbers...
-
Nonfarm jobs grew nearly every month in 2024 (other than small February and August losses)—with a year-to-date gain of 167,000 jobs.
-
The job market expansion reached 55 months in November 2024. California gained 3,182,400 jobs—averaging 57,862 per month—since April 2020.
-
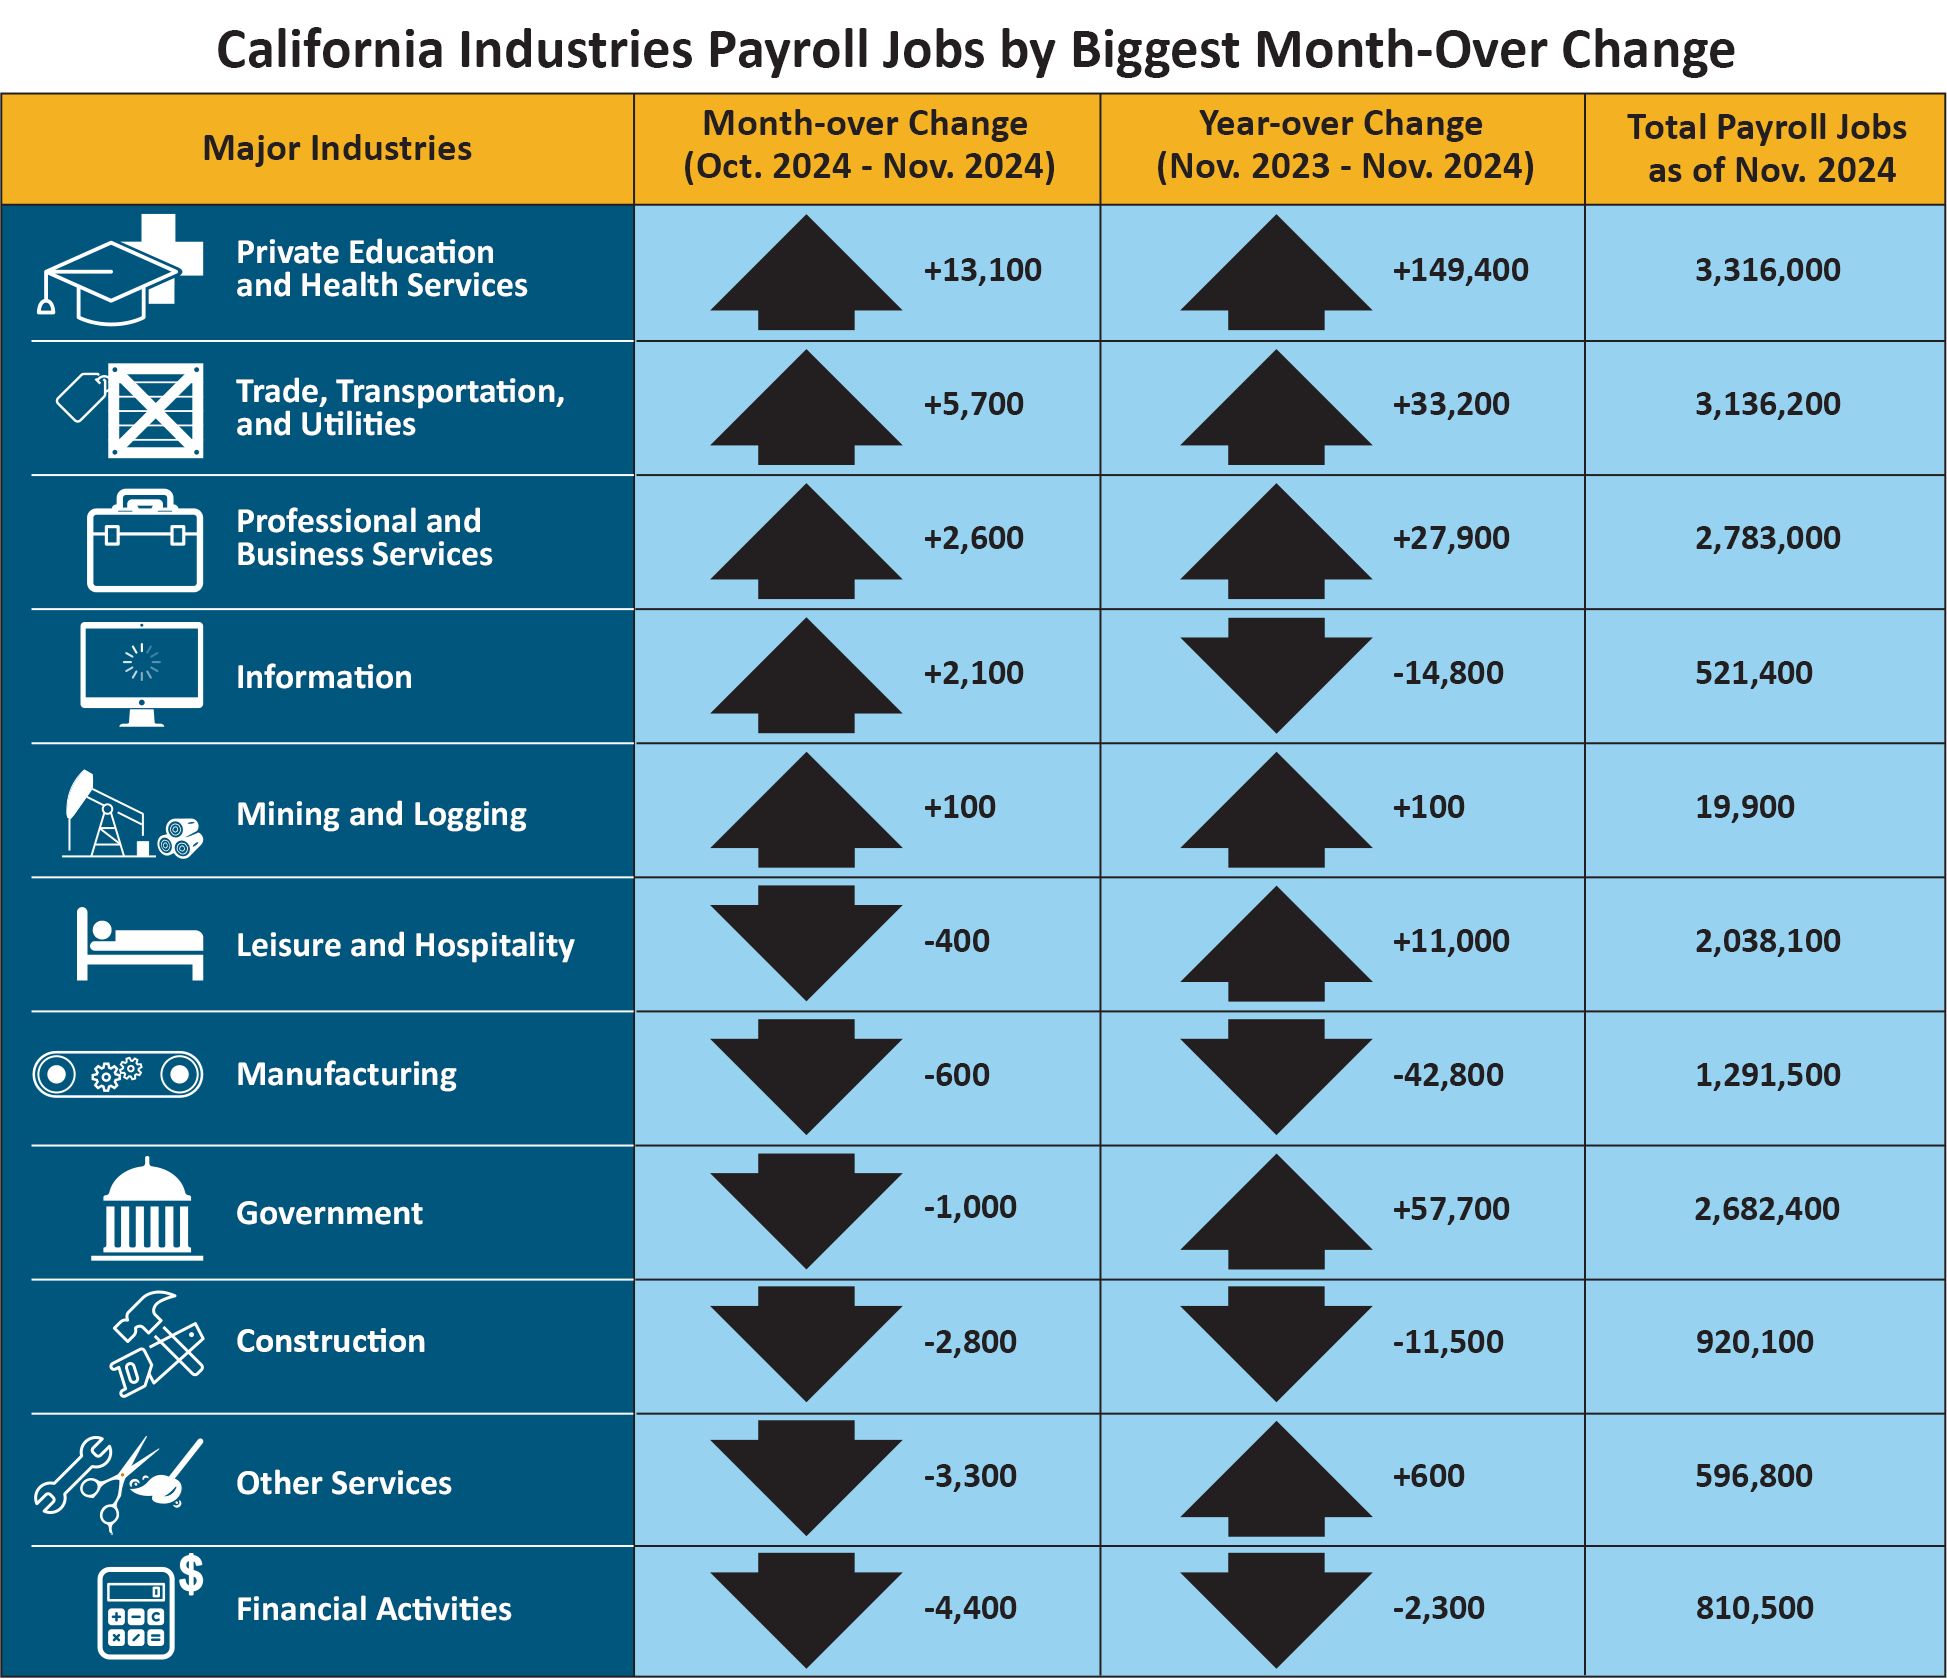
Five of California's 11 industry sectors gained jobs in November with Private Education & Health Services (+13,100) leading the way with significant gains in healthcare-related industry groups.
-
For the ninth consecutive month, Trade, Transportation, & Utilities (+5,700) showed an increase with many of its gains happening in retail, and couriers and messengers, as holiday hiring ramped up and activity increased at California ports.
-
Financial Activities (-4,400) showed the largest month-over reduction due to weakness in the Real Estate and Rental and Leasing subsector as well as in some financial investment-related fields.
1. The nonfarm payroll job numbers come from a federal survey of 80,000 California businesses.
2. The unemployment rate comes from a separate federal survey of 5,100 California households.
Data Trends about Jobs in the Economy
Total Nonfarm Payroll Jobs (Comes from a monthly survey of approximately 80,000 California businesses that estimates jobs in the economy – seasonally adjusted)
- Month-over – Total nonfarm jobs in California’s 11 major industries amounted to 18,115,900 in November – a net gain of 11,100 from October. This followed an upward-revised (+14,600) month-over gain of 9,100 jobs in October.
- Year-over – Total nonfarm jobs increased by 208,500 (a 1.2 percent increase) from November 2023 to November 2024 compared to the U.S. annual gain of 2,274,000 jobs (a 1.4 percent increase).

| Industria Principales | Cambio Mensual (September 2024–Octubre 2024) | Cambio Anual (Octubre 2023–Octubre 2024) | Total empleos de nomina desde Octubre 2024 |
|---|---|---|---|
|
Educación privada y servicios de salud |
+9,400 | +142,800 | 3,296,100 |
|
Actividades financieras |
+2,600 | +2,600 | 815,100 |
|
Comercio, transporte y utilidades |
+2,600 | +20,100 | 3,127,900 |
|
Construcción |
+1,200 | -1,700 | 924,200 |
|
Otros servicios |
+1,200 | +8,600 | 602,500 |
|
Minería y tala |
0 | 0 | 19,800 |
|
Información |
-1,500 | -14,800 | 518,700 |
|
Manufactura |
-1,800 | -37,900 | 1,294,100 |
|
Recreación y hospitalidad |
-3,400 | +16,000 | 2,036,500 |
|
Gobierno |
-7,500 | +56,300 | 2,677,100 |
|
Servicios profesionales y empresariales |
-8,300 | +20,100 | 2,778,200 |
Total de empleos agrícolas – El número de empleos en la industria agrícola se redujo en 900 desde septiembre para llegar a un total de 414,000 empleos en octubre. La industria agrícola registró 9,400 empleos menos en octubre de 2024 que los registrados en octubre del año pasado.
Tendencias de los datos sobre los trabajadores en la economía
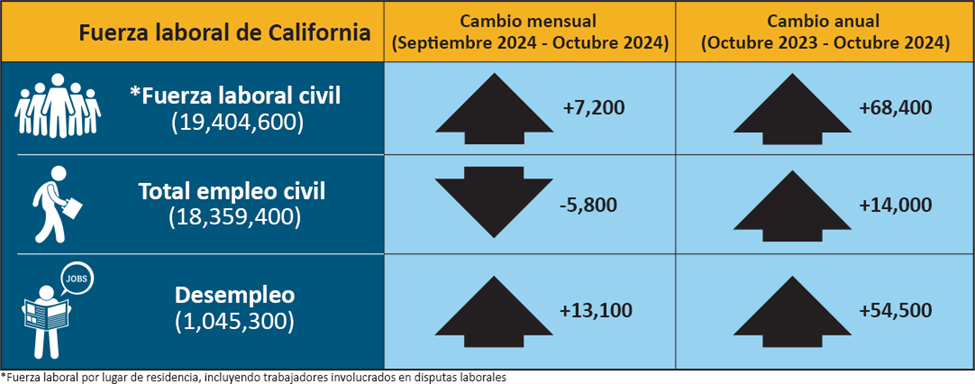
Empleo y desempleo en California (basado en una encuesta federal a 5,100 hogares de California, la cual se enfoca en trabajadores en la economía).
- Empleados – El número de californianos empleados en octubre fue de 18,359,400, un descenso de 5,800 personas desde septiembre, que tuvo un total de 18,365,200, pero 14,000 más del total de empleos en octubre de 2023.
- Desempleados – El número de californianos desempleados fue de 1,045,300 en octubre, un incremento mensual de 13,100 y de 54,500 en comparación con octubre de 2023.

| Fuerza laboral de California | Cambio mensual (septiembre 2024–octubre 2024) | Year-over Change (octubre 2023–octubre 2024) |
|---|---|---|
| * Fuerza laboral civil (19,404,600) | +7,200 | +68,400 |
| Total empleo civil (18,359,400) | -5,800 | +14,000 |
| Desempleo (1,045,300) | +13,100 | +54,500 |
* Labor force by place of residence, including workers involved in trade disputes.
Solicitudes del Seguro de Desempleo (sin ajustes por temporada)
Los siguientes datos provienen de una semana muestra que incluye el día 19 de cada mes:
En datos relacionados que figuran dentro de la tasa de desempleo del estado, hubo 343,588 personas que certificaron para beneficios del Seguro de Desempleo (UI por sus siglas en inglés) durante la semana de muestra de octubre de 2024. Eso comparado con las 359,420 personas en septiembre y con los 356,668 solicitantes en octubre de 2023. Simultáneamente, se tramitaron 40,831 solicitudes iniciales en la semana de muestra de octubre de 2024, que fue un incremento mensual de 2,747 solicitudes registradas en septiembre, al igual que un incremento anual de 122 solicitudes desde octubre de 2023.

| Solicitudes de Seguro de Desempleo en California (UI) | Cambio mensual (septiembre 2024–octubre 2024) | Cambio anual (octubre 2023–octubre 2024) |
|---|---|---|
| Benefecarios de UI (343,588) | -15,832 | +13,080 |
| Nuevo solicitudes de UI (40,831) | -2,747 | +122 |
| COUNTY | LABOR FORCE | EMPLOYMENT | UNEMPLOYMENT | RATE |
|---|---|---|---|---|
| STATE TOTAL | 19,380,300 | 18,336,500 | 1,043,800 | 5.4% |
| ALAMEDA | 820,900 | 781,000 | 39,900 | 4.9% |
| ALPINE | 480 | 450 | 30 | 6.5% |
| AMADOR | 14,580 | 13,820 | 760 | 5.2% |
| BUTTE | 93,300 | 88,100 | 5,200 | 5.6% |
| CALAVERAS | 22,500 | 21,480 | 1,020 | 4.5% |
| COLUSA | 10,810 | 9,890 | 920 | 8.5% |
| CONTRA COSTA | 547,100 | 520,100 | 27,000 | 4.9% |
| DEL NORTE | 9,390 | 8,850 | 540 | 5.7% |
| EL DORADO | 93,900 | 89,700 | 4,200 | 4.4% |
| FRESNO | 457,600 | 424,200 | 33,500 | 7.3% |
| GLENN | 12,960 | 12,220 | 740 | 5.7% |
| HUMBOLDT | 61,500 | 58,500 | 3,000 | 4.8% |
| IMPERIAL | 76,100 | 61,200 | 14,900 | 19.6% |
| INYO | 8,540 | 8,220 | 320 | 3.8% |
| KERN | 399,000 | 367,800 | 31,200 | 7.8% |
| KINGS | 59,200 | 54,600 | 4,500 | 7.7% |
| LAKE | 28,410 | 26,700 | 1,710 | 6.0% |
| LASSEN | 9,160 | 8,700 | 450 | 4.9% |
| LOS ANGELES | 5,081,000 | 4,773,000 | 307,900 | 6.1% |
| MADERA | 65,500 | 60,900 | 4,600 | 7.0% |
| MARIN | 130,800 | 125,800 | 5,000 | 3.9% |
| MARIPOSA | 7,930 | 7,550 | 370 | 4.7% |
| MENDOCINO | 37,870 | 35,990 | 1,880 | 5.0% |
| MERCED | 121,900 | 112,100 | 9,700 | 8.0% |
| MODOC | 3,290 | 3,120 | 170 | 5.2% |
| MONO | 9,100 | 8,720 | 380 | 4.2% |
| MONTEREY | 223,100 | 211,500 | 11,600 | 5.2% |
| NAPA | 71,900 | 69,000 | 2,900 | 4.1% |
| NEVADA | 49,120 | 47,010 | 2,110 | 4.3% |
| ORANGE | 1,586,100 | 1,520,300 | 65,700 | 4.1% |
| PLACER | 195,500 | 187,200 | 8,300 | 4.3% |
| PLUMAS | 7,560 | 7,140 | 420 | 5.6% |
| RIVERSIDE | 1,165,700 | 1,100,000 | 65,800 | 5.6% |
| SACRAMENTO | 734,800 | 698,200 | 36,600 | 5.0% |
| SAN BENITO | 32,100 | 30,100 | 2,000 | 6.1% |
| SAN BERNARDINO | 1,019,600 | 965,700 | 54,000 | 5.3% |
| SAN DIEGO | 1,589,500 | 1,515,400 | 74,100 | 4.7% |
| SAN FRANCISCO | 550,700 | 530,200 | 20,500 | 3.7% |
| SAN JOAQUIN | 355,300 | 332,700 | 22,700 | 6.4% |
| SAN LUIS OBISPO | 134,400 | 129,100 | 5,400 | 4.0% |
| SAN MATEO | 435,800 | 420,000 | 15,800 | 3.6% |
| SANTA BARBARA | 220,400 | 211,000 | 9,300 | 4.2% |
| SANTA CLARA | 1,030,900 | 988,400 | 42,500 | 4.1% |
| SANTA CRUZ | 132,500 | 125,300 | 7,200 | 5.4% |
| SHASTA | 74,900 | 70,900 | 4,000 | 5.3% |
| SIERRA | 1,400 | 1,340 | 60 | 4.1% |
| SISKIYOU | 17,310 | 16,330 | 990 | 5.7% |
| SOLANO | 204,400 | 193,600 | 10,700 | 5.2% |
| SONOMA | 248,300 | 238,000 | 10,300 | 4.1% |
| STANISLAUS | 249,200 | 232,900 | 16,300 | 6.5% |
| SUTTER | 47,500 | 44,300 | 3,200 | 6.7% |
| TEHAMA | 26,720 | 25,120 | 1,600 | 6.0% |
| TRINITY | 4,740 | 4,490 | 240 | 5.1% |
| TULARE | 212,300 | 191,600 | 20,700 | 9.8% |
| TUOLUMNE | 20,570 | 19,500 | 1,070 | 5.2% |
| VENTURA | 412,500 | 392,400 | 20,100 | 4.9% |
| YOLO | 110,100 | 104,600 | 5,500 | 5.0% |
| YUBA | 32,600 | 30,400 | 2,200 | 6.7% |
