Employers Added 93,500 Jobs
Important Note: The employment data for the month of January 2026 comes from the survey week that included January 12. February 2026 data will be released on April 17. Statistics released today reflect updates to initial 2025 monthly estimates as part of the annual benchmark revision.
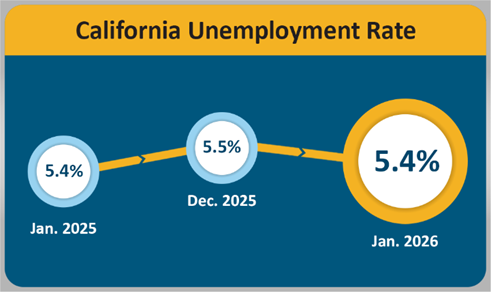
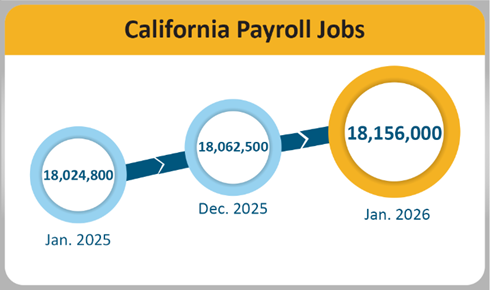
SACRAMENTO — California’s unemployment rate came in at 5.4%1 in January 2026, a decrease from the December 2025 rate of 5.5%. In addition, the State’s employers added 93,500 nonfarm payroll jobs2. These recent data points released by the Employment Development Department (EDD) come from two separate surveys. In addition, as a result of annual benchmark revisions updating past estimates, California’s job loss of 11,100 in 2025 was revised to a gain of 56,600 while the nation’s estimated year-over gain of 584,000 jobs was revised down to 116,000 jobs – a decline of 468,000 jobs in 2025.
California's Labor Market, by the Numbers...
- California’s unemployment rate declined by 0.1 percentage point over the month, matching the national month-over change. Year-over, the State’s unemployment rate has held steady, while the national rate has increased by 0.3 percentage points over the same timeframe.
- January’s preliminary month-over job gain (+93,500) was the largest since January 2024. The state’s jobs accounted for more than 58 percent of the nation’s newly revised gain of 160,000 jobs in January 2026.
- January marked the third consecutive month that unemployment has decreased in California, with the largest month-over unemployment decrease since August 2022.
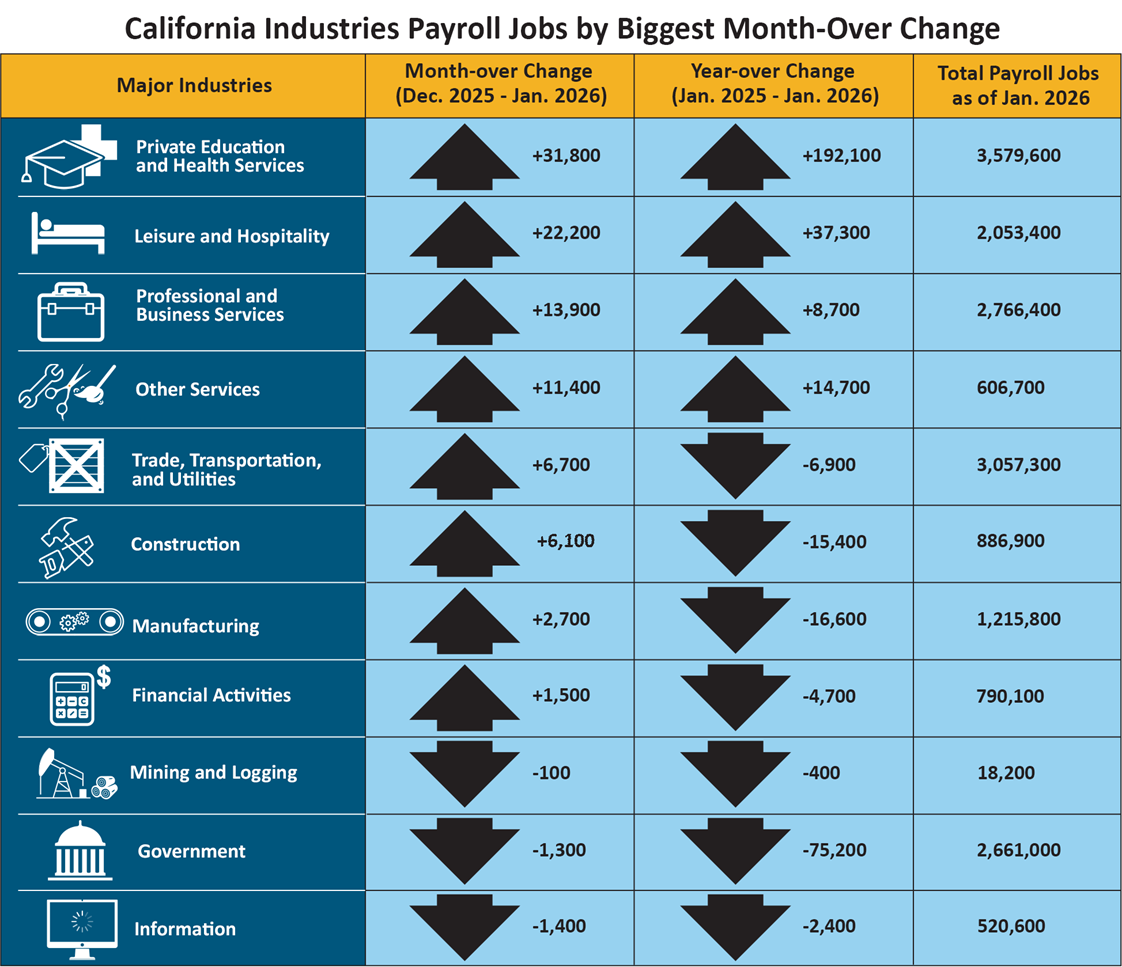
- Eight of California's 11 industry sectors gained jobs in December, with Private Education and Health Services (+31,800) showing gains for the 27th consecutive month, driven by California’s aging population. The industry posted gains in Offices of Physicians, Home Health Care Services, General/Medical Surgical Hospitals, and Child Day Care Services.
- Information (-1,400) experienced the largest month-over loss due to larger-than-expected declines in Motion Picture and Video Industries, Software Publishers, and Web Search Portals, and Other Information Services.
1. The unemployment rate comes from a separate federal survey of 4,400 California households.
2. The nonfarm payroll job numbers come from a federal survey of 80,000 California businesses.
Data Trends about Jobs in the Economy
Total Nonfarm Payroll Jobs (Comes from a monthly survey, seasonally adjusted, of approximately 80,000 California businesses)
- Month-over — Total nonfarm jobs in 11 major industries totaled 18,156,000 in January – a gain of 93,500 from December. This followed December’s post-benchmark revision of 41,300 jobs, resulting in a month-over December gain of 3,500 jobs.
- Year-over — Total nonfarm jobs increased by 131,200 (1% increase) from January 2025 to January 2026 compared to the U.S. year-over gain of 130,000 jobs (0.1% increase).
| Industrias principales | Cambio mensual (dic. 2025 - ene. 2026) |
Cambio anual (ene. 2025 - ene. 2026) |
Total de empleos de nómina desde ene 2026 |
|---|---|---|---|
|
Educación privada y servicios de salud |
+31,800 | +192,100 | 3,579,600 |
|
Recreación y hotelería |
+22,200 | +37,300 | 2,053,400 |
|
Servicios profesionales y empresariales |
+13,900 | +8,700 | 2,766,400 |
|
Otros servicios |
+11,400 | +14,700 | 606,700 |
|
Comercio, transporte y servicios públicos |
+6,700 | -6,900 | 3,057,300 |
|
Construcción |
+6,100 | -15,400 | 886,900 |
|
Manufactura |
+2,700 | -16,600 | 1,215,800 |
|
Actividades financieras |
+1,500 | -4,700 | 790,100 |
|
Minería y tala |
-100 | -400 | 18,200 |
|
Gobierno |
-1,300 | -75,200 | 2,661,000 |
|
Información |
-1,400 | -2,400 | 520,600 |
Total de empleos agrícolas – El número de empleos en la industria agrícola descendió en 22,100 durante diciembre para un total de 406,800 en enero. La industria agrícola tuvo 11,700 empleos más en enero de 2026 que en enero de 2025.
Tendencias de los datos sobre los trabajadores en la economía
Empleo y desempleo en California (basado en una encuesta federal mensual a 4,400 hogares de California, la cual se enfoca en trabajadores en la economía).
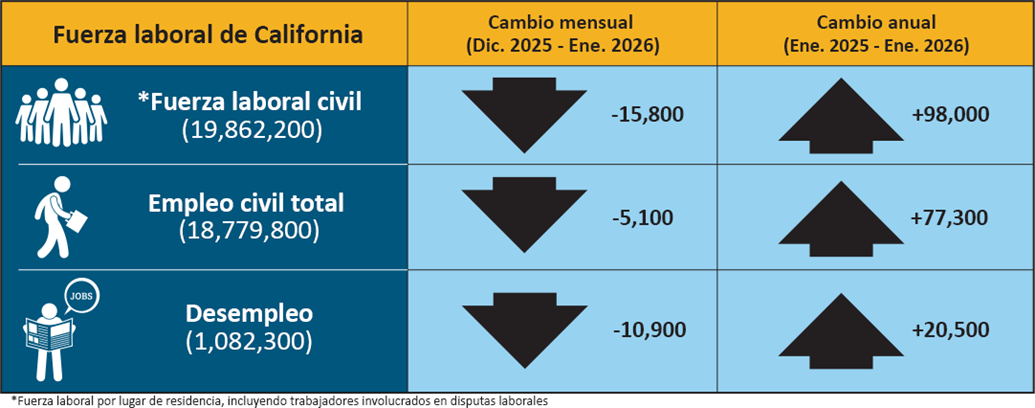
- Empleados – El número de californiamos empleados en diciembre fue de 18,779,800, un descenso de 5,100 desde diciembre y un aumento de 77,300 respecto a enero del año pasado.
- Desempleados – El número de californianos desempleados fue de 1,082,300 en enero, un descenso de 10,900 desde diciembre, pero un aumento de 20,500 comparado a enero de 2025.
| Fuerza laboral de California | Cambio mensual (Dic. 2025 – Ene. 2026) | Cambio anual (Ene. 2025 – Ene. 2026) |
|---|---|---|
| * Fuerza laboral civil (19,862,200) | -15,800 | +98,000 |
| Empleo civil total (18,779,800) | -5,100 | +77,300 |
| Desempleo (1,082,300) | -10,900 | +20,500 |
* Fuerza laboral por lugar de residencia, incluyendo a los trabajadores involucrados en disputas laborales.
Solicitudes del Seguro de Desempleo (sin ajustes por temporada)
Los siguientes datos provienen de una semana de muestra que incluye el día 19 de cada mes:
En datos relacionados que figuran dentro de la tasa de desempleo del estado, hubo 375,219 personas que certificaron para recibir beneficios del Seguro de Desempleo (UI, por sus siglas en inglés) durante la semana de muestra de enero de 2026. Esto comparado a 386,980 personas en diciembre y 394,387 personas en enero de 2025. Simultáneamente, se tramitaron 43,344 solicitudes iniciales en la semana de muestra de enero de 2026, que registró un decremento mensual de 4,148 solicitudes registradas desde diciembre y un aumento anual de 2,765 solicitudes en comparación a enero de 2025.
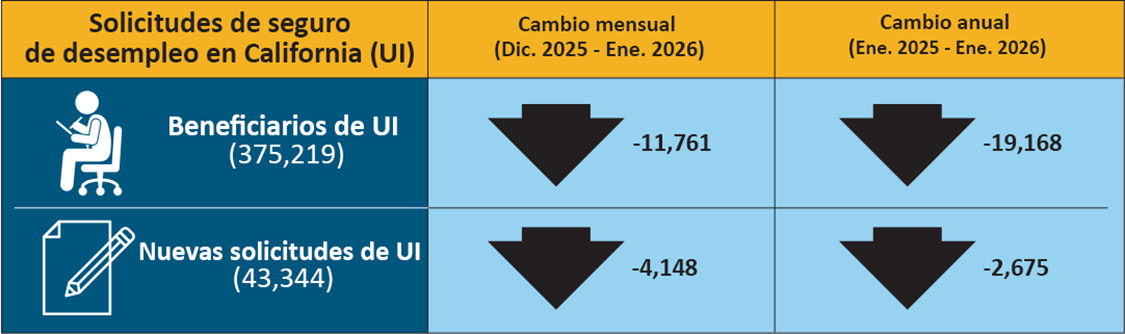
| Solicitudes del seguro de desempleo en California (UI) | Cambio mensual (Dic. 2025 – Ene. 2026) | Cambio anual (Dic. 2025 – Ene. 2026) |
|---|---|---|
| Beneficiarios de UI (375,219) | -11,761 | -19,168 |
| Nuevas solicitudes de UI (43,344) | -4,148 | -2,675 |
|
CONDADO |
FUERZA LABORAL |
EMPLEO | DESEMPLEO | TASA |
|---|---|---|---|---|
|
TOTAL ESTATAL |
19,622,900 |
18,537,900 |
1,085,000 |
5.5% |
| ALAMEDA |
860,200 |
820,300 |
39,900 |
4.6% |
| ALPINE |
590 |
550 |
40 |
6.6% |
| AMADOR |
14,700 |
13,740 |
960 |
6.5% |
| BUTTE |
89,600 |
83,700 |
5,900 |
6.6% |
| CALAVERAS |
17,380 |
16,190 |
1,200 |
6.9% |
| COLUSA |
11,220 |
9,220 |
2,000 |
17.8% |
| CONTRA COSTA |
577,200 |
549,700 |
27,500 |
4.8% |
| DEL NORTE |
9,250 |
8,600 |
650 |
7.0% |
| EL DORADO |
89,900 |
85,200 |
4,700 |
5.2% |
| FRESNO |
472,700 |
430,900 |
41,900 |
8.9% |
| GLENN |
11,670 |
10,720 |
950 |
8.1% |
| HUMBOLDT |
59,500 |
56,100 |
3,400 |
5.6% |
| IMPERIAL |
74,400 |
60,500 |
13,900 |
18.6% |
| INYO |
8,230 |
7,810 |
420 |
5.1% |
| KERN |
408,700 |
371,300 |
37,500 |
9.2% |
| KINGS |
59,400 |
53,400 |
5,900 |
10.0% |
| LAKE |
26,530 |
24,350 |
2,190 |
8.2% |
| LASSEN |
8,260 |
7,620 |
630 |
7.6% |
| LOS ANGELES |
5,112,600 |
4,833,400 |
279,200 |
5.5% |
| MADERA |
69,900 |
63,900 |
6,000 |
8.6% |
| MARIN |
122,400 |
117,300 |
5,100 |
4.2% |
| MARIPOSA |
6,720 |
6,200 |
520 |
7.7% |
| MENDOCINO |
36,030 |
33,680 |
2,350 |
6.5% |
| MERCED |
123,900 |
110,800 |
13,100 |
10.6% |
| MODOC |
2,990 |
2,710 |
280 |
9.2% |
| MONO |
8,160 |
7,810 |
350 |
4.3% |
| MONTEREY |
208,200 |
186,200 |
22,000 |
10.6% |
| NAPA |
72,000 |
68,500 |
3,500 |
4.9% |
| NEVADA |
47,190 |
44,820 |
2,360 |
5.0% |
| ORANGE |
1,606,200 |
1,540,100 |
66,100 |
4.1% |
| PLACER |
207,900 |
198,700 |
9,200 |
4.4% |
| PLUMAS |
7,250 |
6,480 |
770 |
10.6% |
| RIVERSIDE |
1,197,300 |
1,131,500 |
65,800 |
5.5% |
| SACRAMENTO |
782,800 |
742,200 |
40,600 |
5.2% |
| SAN BENITO |
34,200 |
31,700 |
2,500 |
7.2% |
| SAN BERNARDINO |
1,035,300 |
979,900 |
55,400 |
5.3% |
| SAN DIEGO |
1,650,300 |
1,573,200 |
77,200 |
4.7% |
| SAN FRANCISCO |
499,600 |
479,400 |
20,300 |
4.1% |
| SAN JOAQUIN |
374,800 |
349,100 |
25,700 |
6.8% |
| SAN LUIS OBISPO |
130,500 |
124,500 |
6,000 |
4.6% |
| SAN MATEO |
408,600 |
393,100 |
15,500 |
3.8% |
| SANTA BARBARA |
218,400 |
206,400 |
12,000 |
5.5% |
| SANTA CLARA |
1,024,700 |
982,000 |
42,700 |
4.2% |
| SANTA CRUZ |
135,600 |
126,000 |
9,600 |
7.1% |
| SHASTA |
81,700 |
76,900 |
4,800 |
5.9% |
| SIERRA |
1,340 |
1,250 |
90 |
6.5% |
| SISKIYOU |
15,880 |
14,360 |
1,510 |
9.5% |
| SOLANO |
218,300 |
206,300 |
12,000 |
5.5% |
| SONOMA |
244,000 |
232,900 |
11,100 |
4.6% |
| STANISLAUS |
253,400 |
234,600 |
18,900 |
7.4% |
| SUTTER |
45,600 |
41,000 |
4,600 |
10.1% |
| TEHAMA |
27,120 |
25,320 |
1,800 |
6.6% |
| TRINITY |
5,450 |
5,080 |
370 |
6.8% |
| TULARE |
220,300 |
195,800 |
24,500 |
11.1% |
| TUOLUMNE |
21,570 |
20,300 |
1,260 |
5.9% |
| VENTURA |
416,700 |
395,900 |
20,800 |
5.0% |
| YOLO |
112,400 |
105,400 |
7,100 |
6.3% |
| YUBA |
36,100 |
33,400 |
2,700 |
7.4% |