Employers Shed 1,700 Jobs
Important Note: The employment data for the month of December 2025 comes from the survey week that included December 12. The release date for January 2026 data has not yet been finalized as the Department awaits access to data from the U.S. Department of Labor’s Bureau of Labor Statistics.
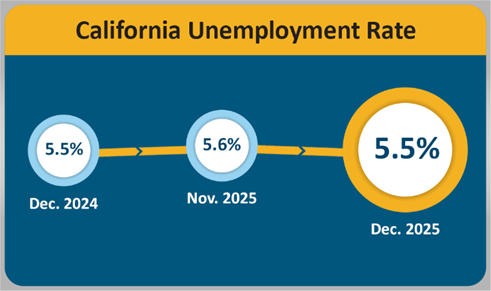
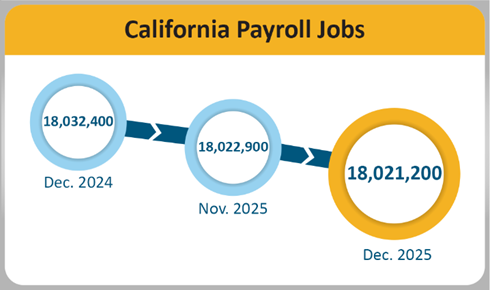
SACRAMENTO — California’s unemployment rate came in at 5.5%1 in December 2025, which is a decrease from the revised rate of 5.6% posted for November. In addition, the State’s employers lost 1,700 nonfarm payroll jobs2. These recent data points released by the Employment Development Department (EDD) come from two separate surveys. Total nonfarm employment for November was revised down (-2,000) to a total gain of 30,500 jobs. November’s initial estimate of a 5.5% unemployment rate was revised up by 0.1 percentage point due to an increase in unemployment.
California's Labor Market, by the Numbers...
- California’s unemployment rate declined by 0.1 percentage point over the month, matching the national change. However, the State’s unemployment rate has held steady year-over while the nation’s rate increased by 0.3 percentage point.
- The total number of people unemployed declined for the second consecutive month after previously experiencing six consecutive months of gains (April 2025 - September 2025).
- December’s year-over nonfarm job loss (-11,200) marks the first year-over decrease since March 2021.
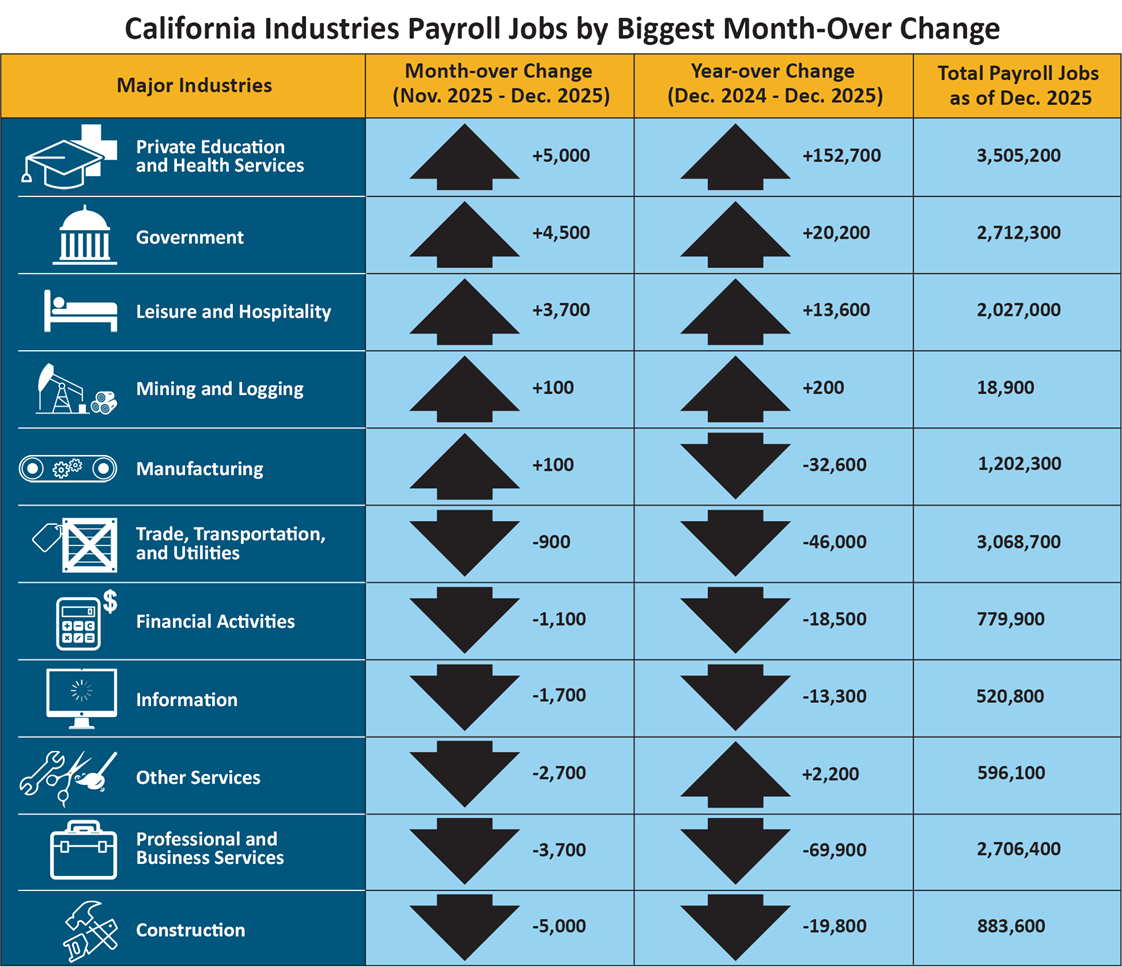
- Five of California's 11 industry sectors gained jobs in December, with Private Education and Health Services (+5,000) showing gains for the 47th consecutive month as California’s population continues to age. The industry saw gains posted in Hospitals and Social Assistance.
- Government (+4,500) saw the second largest month-over Increase due, in part, to gains in Local Government (+3,900) as well as from above average gains in State Government Educational Services.
- Construction (-5,000) experienced the largest month-over decline driven largely by very wet weather throughout the month with above average losses in Utility System Construction and Building Finishing Contractors.
1. The unemployment rate comes from a separate federal survey of 4,400 California households.
2. The nonfarm payroll job numbers come from a federal survey of 80,000 California businesses.
Data Trends about Jobs in the Economy
Total Nonfarm Payroll Jobs (Comes from a monthly survey of approximately 80,000 California businesses that estimates jobs in the economy – seasonally adjusted)
- Month-over — Total nonfarm jobs in California’s 11 major industries amounted to 18,021,200 in December – a loss of 1,700 from November. This followed November’s downward revision of 2,000 jobs, resulting in a month-over November gain of 30,500 jobs.
- Year-over — Total nonfarm jobs decreased by 11,200 (0.1% decrease) from December 2024 to December 2025 compared to the U.S. year-over gain of 584,000 jobs (a 0.4% increase).
| Industrias principales | Cambio mensual (Oct. 2025 - Nov. 2025) |
Cambio anual (Nov. 2024 - Nov. 2025) | Total de epleos de nómina desde Nov. 2025 |
|---|---|---|---|
|
Educación privada y servicios de salud |
+14,900 | +156,800 | 3,501,800 |
|
Comercio, transporte y servicios públicos |
+7,500 | -30,400 | 3,069,800 |
|
Recreación y hotelería |
+7,500 | +16,200 | 2,022,800 |
|
Gobierno |
+5,100 | +15,500 | 2,704,600 |
|
Construcción |
+2,400 | -15,900 | 888,200 |
|
Servicios profesionales y empresariales |
900 | -66,800 | 2,710,600 |
|
Otros servicios |
0 | +6,900 | 599,300 |
|
Minería y tala |
-100 | +100 | 18,800 |
|
Actividades financieras |
-800 | -14,000 | 782,600 |
|
Información |
-2,400 | -6,300 | 523,200 |
|
Manufactura |
-2,500 | -30,600 | 1,203,200 |
Total de empleos agrícolas – El número de empleos en la industria agrícola incrementó en 7,800 durante octubre para un total de 417,700 empleos en noviembre. La industria agrícola registró 1,000 empleos más en noviembre de 2025 que en noviembre de 2024.
Tendencias de los datos sobre los trabajadores en la economía
Empleo y desempleo en California (basado en una encuesta federal mensual a 4,400 hogares de California, la cual se enfoca en trabajadores en la economía).
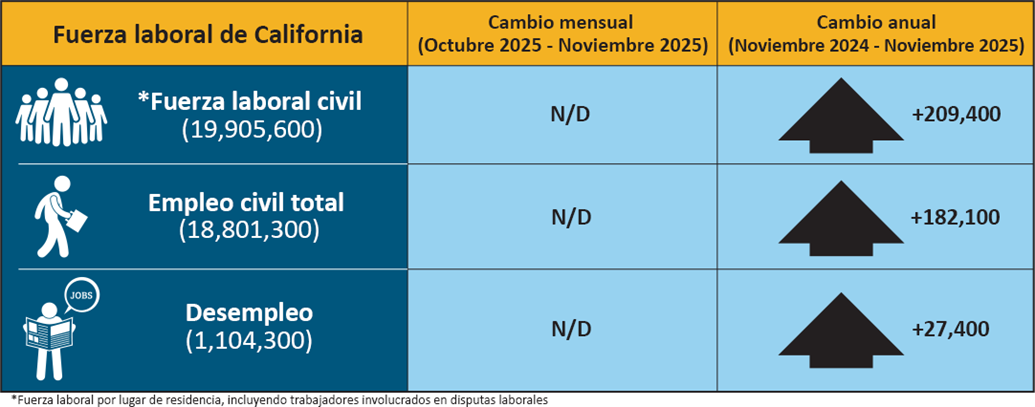
- Empleados – El número de californianos empleados en noviembre fue de 18,801,300, un incremento de 182,100 comparado con noviembre de 2024. Debido al reciente cierre gubernamental, no hay datos disponibles para el mes de octubre de 2025.
- Desempleados – El número de californianos desempleados en noviembre fue de 1,104,300, un incremento de 27,400 desde noviembre de 2024. Debido al reciente cierre gubernamental, no hay datos disponibles para el mes de octubre de 2025.
| Fuerza laboral de California | Cambio mensual (octubre 2025 – noviembre 2025) | Cambio anual (noviembre 2024 – noviembre 2025) |
|---|---|---|
| * Fuerza laboral civil (19,905,600) | N/A | +209,400 |
| Empleo civil total (18,801,300) | N/A | +182,100 |
| Desempleo (1,104,300) | N/A | +27,400 |
* Fuerza laboral por lugar de residencia, incluyendo a los trabajadores involucrados en disputas laborales.
Solicitudes del Seguro de Desempleo (sin ajustes por temporada)
Los siguientes datos provienen de una semana de muestra que incluye el día 19 de cada mes:
En datos relacionados que figuran dentro de la tasa de desempleo del estado, hubo 363,076 personas que certificaron para recibir beneficios del Seguro de Desempleo (UI, por sus siglas en inglés) durante la semana de muestra de noviembre de 2025. Esto comparado a 348,480 personas en octubre y 364,202 personas en noviembre de 2024. Simultáneamente, se tramitaron 53,551 solicitudes iniciales en la semana de muestra de noviembre de 2025, que registró un incremento mensual de 11,720 solicitudes registradas desde octubre y un incremento anual de 5,272 solicitudes en comparación a noviembre de 2024.
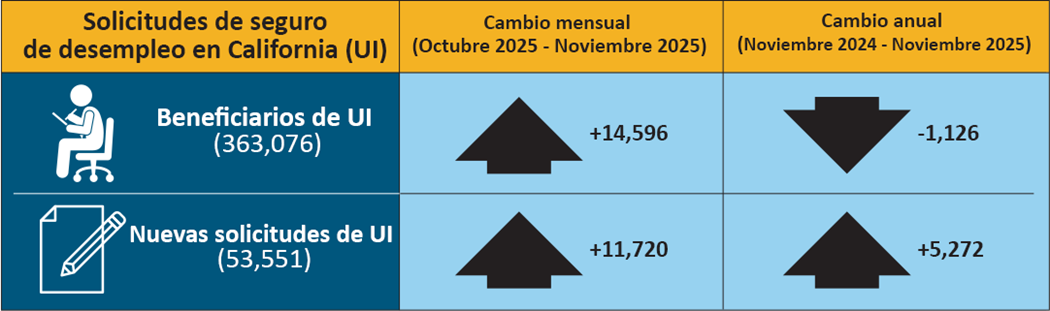
| Solicitudes del seguro de desempleo en California (UI) | Cambio mensual (octubre 2025 – noviembre 2025) | Cambio anual (noviembre 2024 – noviembre 2025) |
|---|---|---|
| Beneficiarios de UI (363,076) | +14,596 | -1,126 |
| Nuevas solicitudes de UI (53,551) | +11,720 | +5,272 |
|
CONDADO |
FUERZA LABORAL |
EMPLEO |
DESEMPLEO |
TASA |
|
TOTAL ESTATAL |
20,037,500 |
18,957,600 |
1,080,000 |
5.4% |
| ALAMEDA |
874,100 |
833,600 |
40,500 |
4.6% |
| ALPINE |
400 |
360 |
40 |
9.2% |
| AMADOR |
15,280 |
14,370 |
910 |
5.9% |
| BUTTE |
94,500 |
89,000 |
5,500 |
5.8% |
| CALAVERAS |
17,730 |
16,610 |
1,120 |
6.3% |
| COLUSA |
11,590 |
10,240 |
1,350 |
11.6% |
| CONTRA COSTA |
588,000 |
559,900 |
28,100 |
4.8% |
| DEL NORTE |
8,920 |
8,340 |
590 |
6.6% |
| EL DORADO |
91,900 |
87,400 |
4,600 |
5.0% |
| FRESNO |
478,500 |
439,400 |
39,100 |
8.2% |
| GLENN |
11,980 |
11,160 |
810 |
6.8% |
| HUMBOLDT |
61,000 |
57,900 |
3,100 |
5.1% |
| IMPERIAL |
76,500 |
61,200 |
15,300 |
20.0% |
| INYO |
8,400 |
8,010 |
390 |
4.6% |
| KERN |
423,400 |
390,200 |
33,200 |
7.8% |
| KINGS |
59,600 |
54,300 |
5,200 |
8.8% |
| LAKE |
26,320 |
24,340 |
1,970 |
7.5% |
| LASSEN |
8,550 |
8,050 |
510 |
5.9% |
| LOS ANGELES |
5,208,600 |
4,912,700 |
295,800 |
5.7% |
| MADERA |
70,000 |
64,700 |
5,300 |
7.6% |
| MARIN |
127,400 |
122,000 |
5,300 |
4.2% |
| MARIPOSA |
7,540 |
7,130 |
410 |
5.5% |
| MENDOCINO |
37,290 |
35,150 |
2,140 |
5.7% |
| MERCED |
124,200 |
113,100 |
11,100 |
8.9% |
| MODOC |
3,230 |
3,020 |
210 |
6.5% |
| MONO |
7,820 |
7,430 |
390 |
5.0% |
| MONTEREY |
224,200 |
209,500 |
14,800 |
6.6% |
| NAPA |
76,400 |
73,200 |
3,200 |
4.2% |
| NEVADA |
47,660 |
45,360 |
2,310 |
4.8% |
| ORANGE |
1,655,000 |
1,586,500 |
68,400 |
4.1% |
| PLACER |
208,600 |
199,500 |
9,100 |
4.4% |
| PLUMAS |
7,580 |
7,060 |
520 |
6.8% |
| RIVERSIDE |
1,218,300 |
1,151,000 |
67,300 |
5.5% |
| SACRAMENTO |
790,300 |
749,800 |
40,500 |
5.1% |
| SAN BENITO |
34,700 |
32,600 |
2,100 |
6.1% |
| SAN BERNARDINO |
1,060,300 |
1,003,800 |
56,500 |
5.3% |
| SAN DIEGO |
1,690,200 |
1,611,700 |
78,400 |
4.6% |
| SAN FRANCISCO |
515,100 |
494,800 |
20,300 |
3.9% |
| SAN JOAQUIN |
381,500 |
357,000 |
24,400 |
6.4% |
| SAN LUIS OBISPO |
133,100 |
127,100 |
6,000 |
4.5% |
| SAN MATEO |
421,700 |
405,700 |
16,000 |
3.8% |
| SANTA BARBARA |
227,200 |
216,900 |
10,300 |
4.5% |
| SANTA CLARA |
1,033,000 |
989,400 |
43,600 |
4.2% |
| SANTA CRUZ |
139,600 |
131,400 |
8,300 |
5.9% |
| SHASTA |
81,900 |
77,500 |
4,300 |
5.3% |
| SIERRA |
1,440 |
1,370 |
70 |
5.1% |
| SISKIYOU |
16,850 |
15,700 |
1,150 |
6.8% |
| SOLANO |
217,000 |
205,300 |
11,700 |
5.4% |
| SONOMA |
249,000 |
238,000 |
11,000 |
4.4% |
| STANISLAUS |
262,200 |
244,700 |
17,500 |
6.7% |
| SUTTER |
46,600 |
42,800 |
3,700 |
8.0% |
| TEHAMA |
27,510 |
25,900 |
1,620 |
5.9% |
| TRINITY |
5,520 |
5,190 |
330 |
6.0% |
| TULARE |
224,800 |
202,400 |
22,400 |
10.0% |
| TUOLUMNE |
22,630 |
21,430 |
1,210 |
5.3% |
| VENTURA |
425,700 |
404,700 |
21,100 |
4.9% |
| YOLO |
112,700 |
106,200 |
6,500 |
5.8% |
| YUBA |
36,700 |
34,200 |
2,400 |
6.6% |