NR No. 23-36
Contact: Loree Levy/Aubrey Henry
916-654-9029
mediainquiries@edd.ca.gov
NOTA IMPORTANTE: Los datos sobre el empleo del mes de agosto de 2023 provienen de la semana de encuesta que incluye el 12 de agosto. Los datos del mes de septiembre están programados para publicación el 20 de octubre de 2023.
Los empleadores agregaron 23,100 empleos de nómina no agrícolas
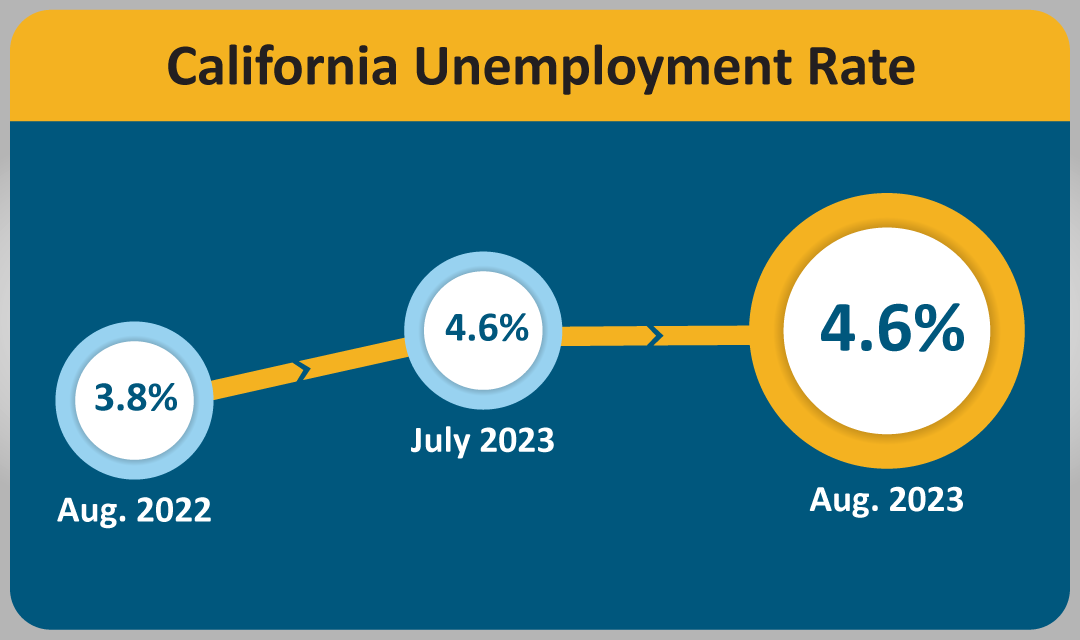
SACRAMENTO – La tasa de desempleo en California se mantuvo en 4.6 por ciento1 por tercer mes consecutivo, a la vez que los empleadores del estado agregaron a la economía 23,100 empleos de nómina no agrícolas2, según los datos publicados hoy por el Departamento del Desarrollo del Empleo (EDD) provenientes de dos encuestas. El total de empleo no agrícola de julio de 2023 fue actualizado para reflejar 19,000 empleos menos debido a reducciones en las industrias de recreación y hotelería, información y gobierno.
El mercado laboral en California, por números…
- Desde que inició la expansión económica actual en abril de 2020, California ha ganado 3,202,200 empleos, un aumento promedio mensual de 80,055 empleos.
- El aumento de empleos no agrícolas de California en agosto fue de 12.4 por ciento de empleos ganados a nivel nacional; esto sobrepasa el 11.6 por ciento de la porción estatal del total de empleo no agrícola del país.
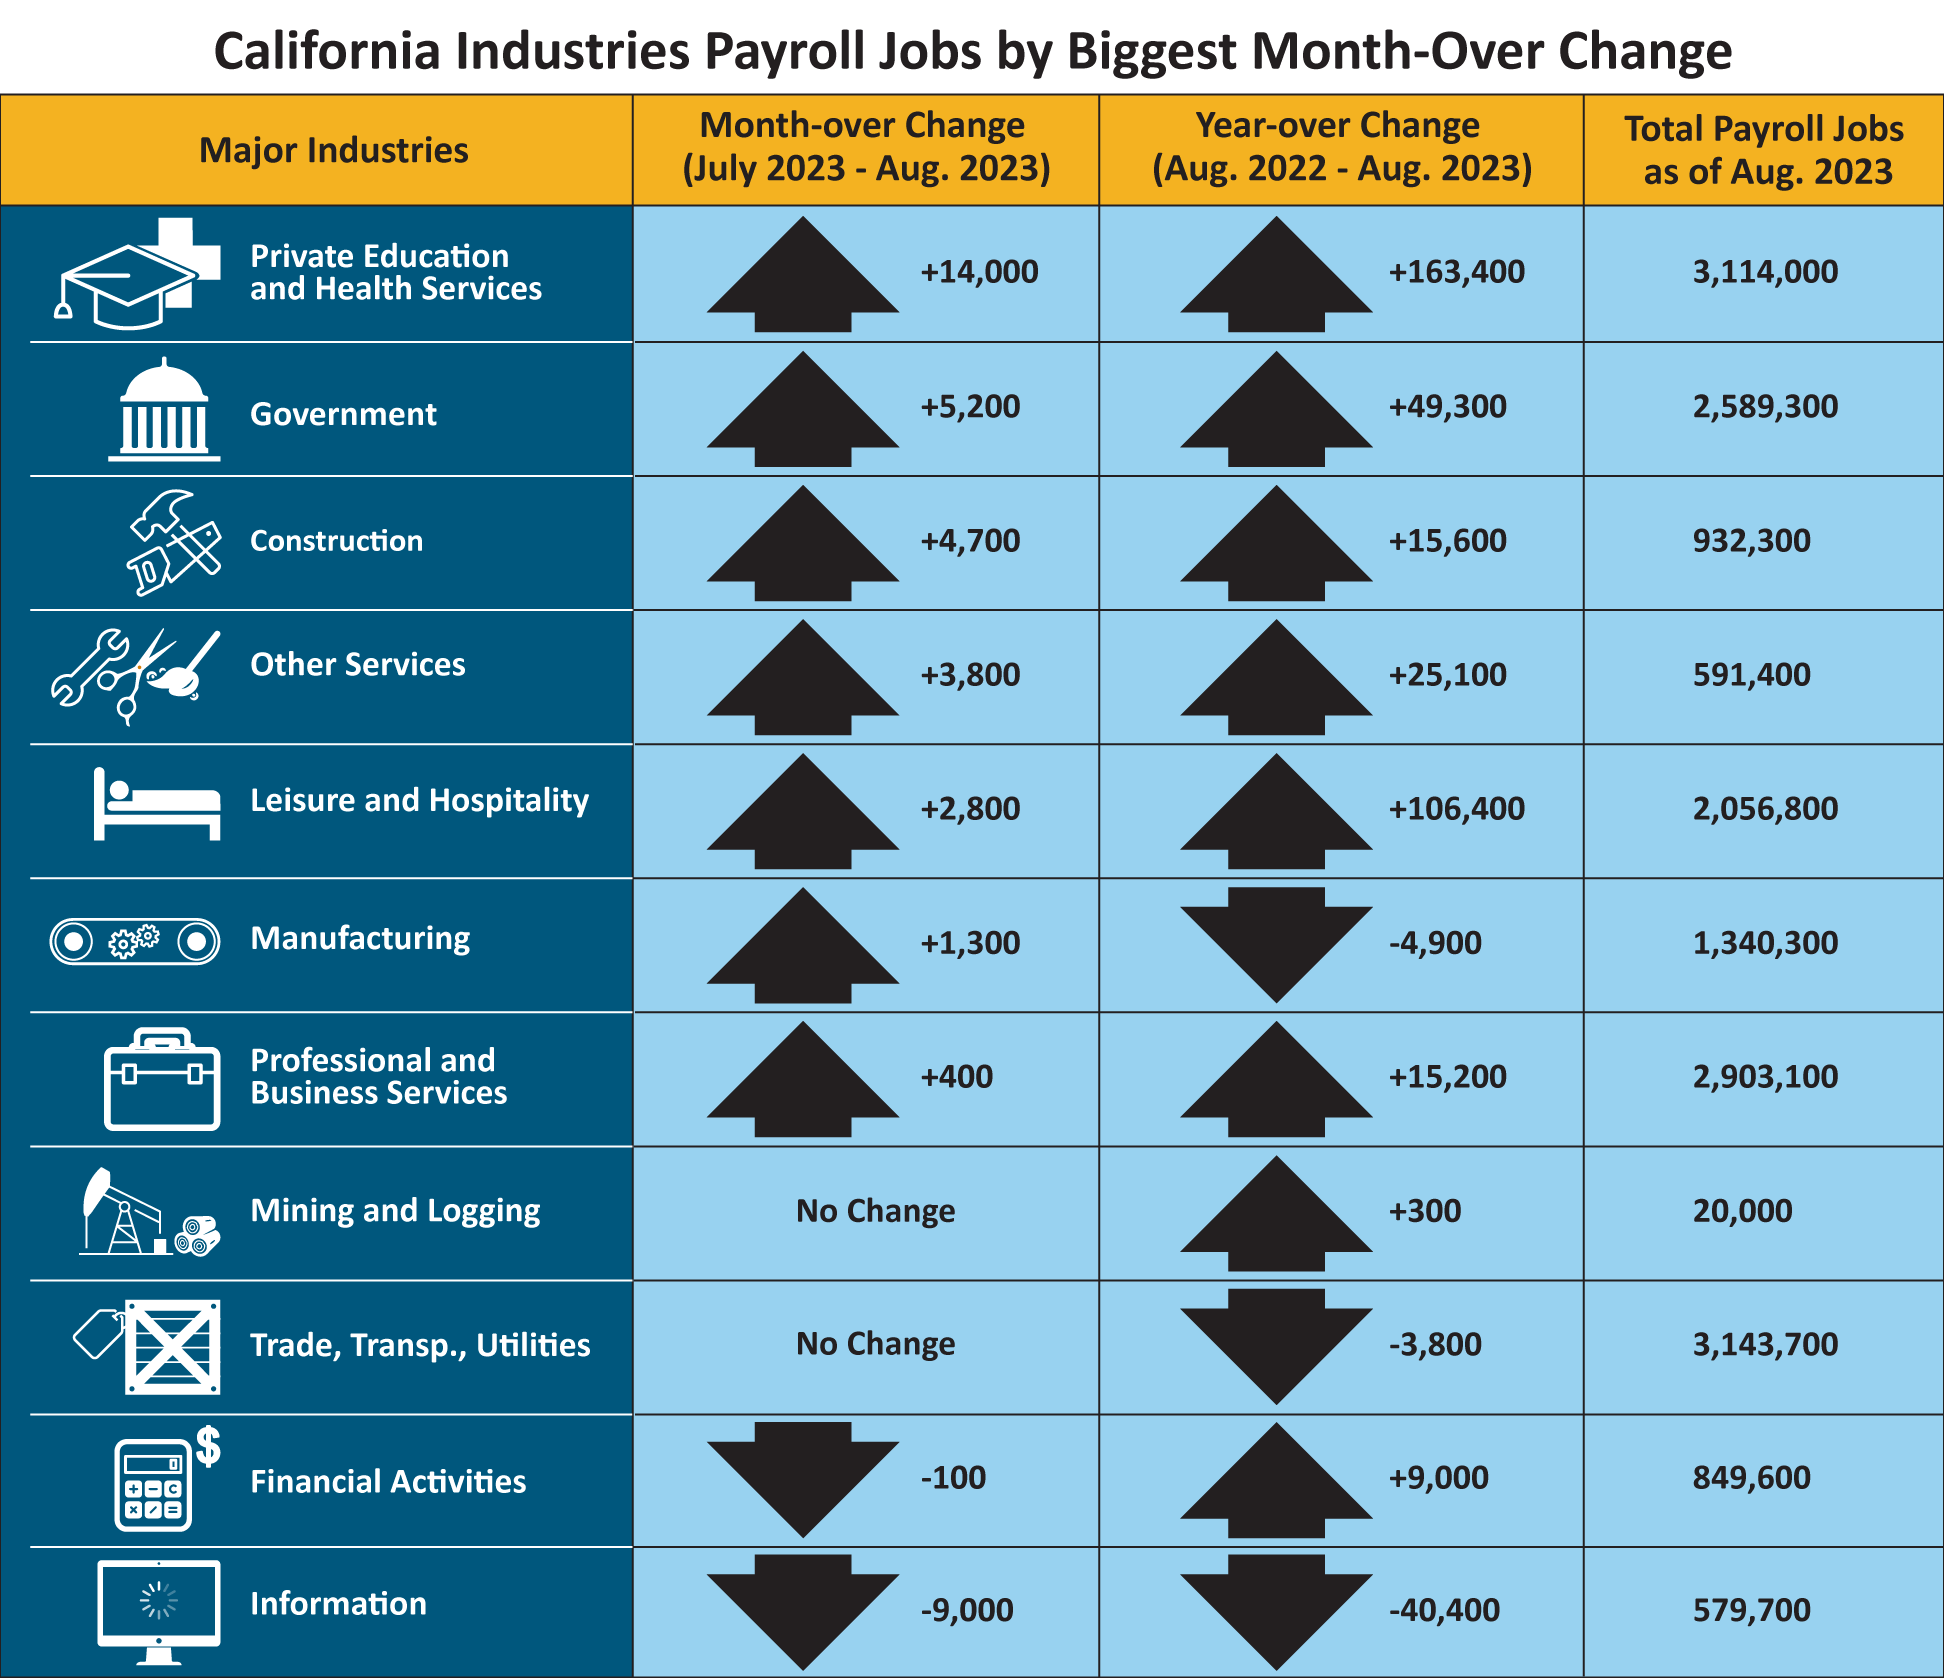
- Siete de las 11 industrias de California ganaron empleos en agosto, encabezadas por el sector de la educación privada y servicios de la salud (+14,000) gracias a la solidez en los servicios a personas y familias, al igual que los aumentos en universidades privadas y escuelas de especialidades
- La industria del gobierno (+5,200) también registró avances positivos gracias mayormente al aumento en los servicios educativos del gobierno local.
- La mayoría de las pérdidas en la industria de la información fueron en el sector de cinematografía y grabaciones de sonido, afectado al menos en parte por las huelgas de los guionistas y actores. Las pérdidas adicionales sucedieron entre los proveedores de infraestructura de la informática, procesamiento de datos, servidores de web y servicios relacionados.
1. La tasa de desempleo proviene de una encuesta federal distinta de 5,100 hogares en California
2. Los datos de empleos de nómina no agrícolas provienen de una encuesta federal efectuada a 80,000 empresas de California
Tendencias de los datos sobre empleos en la economía
Total de empleos de nómina no agrícolas (proviene de una encuesta mensual de aproximadamente 80,000 empresas de California, la cual calcula empleos en la economía ajustados por temporada)
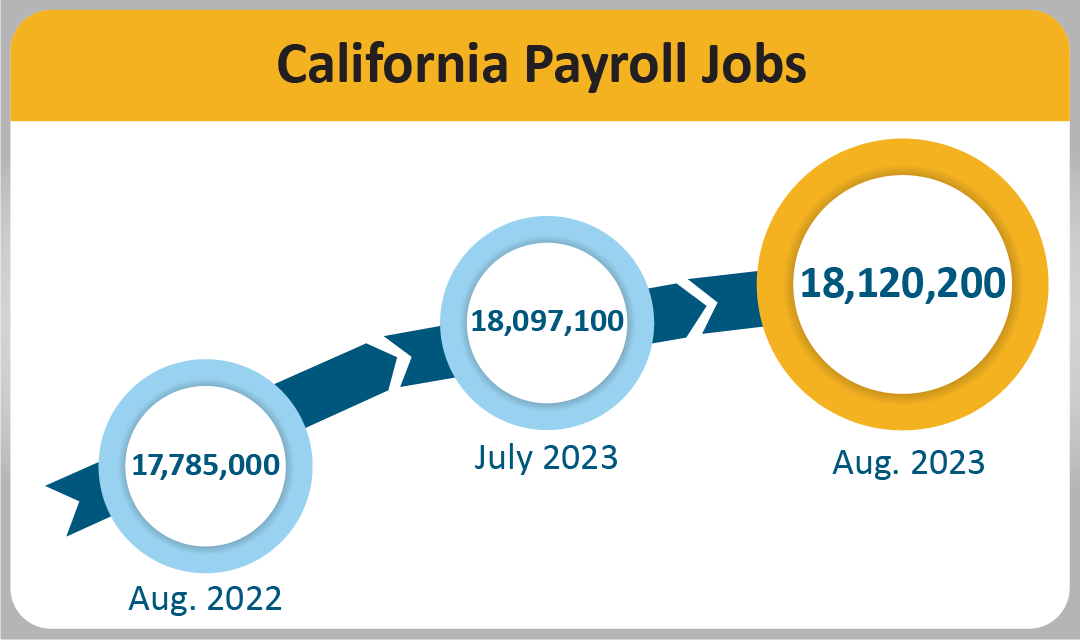
- En todo el mes – El total de empleos no agrícolas en las 11 industrias principales de California fue de 18,120,200 en agosto, un aumento neto de 23,100 empleos desde julio. Esto tras una revisión actualizada (-19,000) que refleja una disminución en el aumento en todo el mes de 8,900 empleos en julio.
- En todo el año – El total de empleos no agrícolas aumentó 335,200 (un aumento de 1.9 por ciento) desde agosto de 2022 hasta agosto de 2023, comparado con el aumento anual en los Estados Unidos de 3,087,000 empleos (un aumento de 2.0 por ciento).
| Major Industries |
Month-over Change (June 2023–July 2023) |
Year-over Change (July 2022–July 2023) |
Total Payroll Jobs as of July 2023 |
|
Government
|
+15,000 |
+57,600 |
2,594,600 |
|
Private Education and Health Services
|
+10,800 |
+159,400 |
3,102,900 |
|
Leisure and Hospitality
|
+10,300 |
+120,100 |
2,061,800 |
|
Trade, Transp., Utilities
|
+4,500 |
-2,700 |
3,144,500 |
|
Other Services
|
+2,200 |
+23,800 |
588,000 |
| Manufacturing |
+1,900 |
+1,800 |
1,339,700 |
|
Construction
|
+500 |
+13,800 |
928,300 |
|
Mining and Logging
|
-100 |
+200 |
19,900 |
|
Financial Activities
|
-2,000 |
+4,500 |
847,000 |
|
Information
|
-3,800 |
-26,000 |
593,600 |
|
Professional and Business Services
|
-11,400 |
+14,700 |
2,895,800 |
Total Farm jobs – The number of jobs in the agriculture industry decreased from July by 1,300 to a total of 430,500 jobs in August. The agricultural industry had 8,600 more farm jobs in August 2023 than it did in August a year ago.
Data trends about Workers in the Economy
Employment and Unemployment in California (Based on a monthly federal survey of 5,100 California households which focuses on workers in the economy)
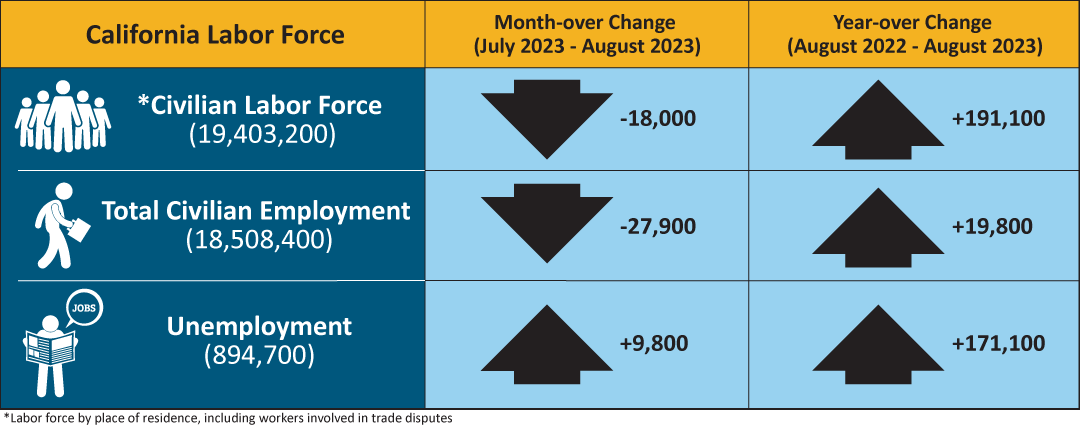
- Employed – The number of Californians employed in August was 18,508,400, a decrease of 27,900 persons from July’s total of 18,536,300, but up 19,800 from the employment total in August 2022.
- Unemployed – The number of unemployed Californians was 894,700 in August, an increase of 9,800 over the month and up 171,100 in comparison to August 2022.
| California Labor Force |
Month-over Change (June 2023–July 2023) |
Year-over Change (July 2022–July 2023) |
| * Civilian Labor Force (19,422,000) |
-21,700 |
+183,700 |
| Total Civilian Employment (18,537,400) |
-17,000 |
+31,300 |
| Unemployment (884,600) |
-4,700 |
+152,400 |
* Labor force by place of residence, including workers involved in trade disputes.
Unemployment Insurance Claims (not seasonally adjusted)
The following data is from a sample week that includes the 19th of each month: In related data that figures into the state’s unemployment rate, there were 394,757 people certifying for Unemployment Insurance benefits during the August 2023 sample week. That compares to 401,745 people in July and 310,212 people in August 2022. Concurrently, 37,974 initial claims were processed in the August 2023 sample week, which was a month-over decrease of 5,779 claims from July, but a year-over increase of 774 claims from August 2022.
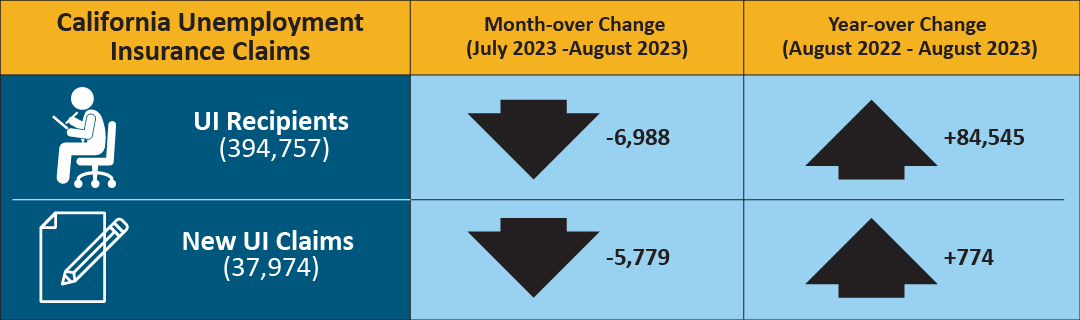
| California Unemployment Insurance Claims |
Month-over Change (July 2023 - Aug. 2023) |
Year-over Change (Aug. 2022 - Aug. 2023) |
| UI Recipients (394,757) |
-6,988 |
+84,545 |
| New UI Claims (37,974) |
-5,779 |
+774 |
MONTHLY LABOR FORCE DATA FOR COUNTIES
August 2023 (Preliminary); 2022 Benchmark
NOT SEASONALLY ADJUSTED
| COUNTY |
LABOR FORCE |
EMPLOYMENT |
UNEMPLOYMENT |
RATE |
| STATE TOTAL |
19,340,800 |
18,347,200 |
993,600 |
5.1% |
| ALAMEDA |
831,600 |
794,200 |
37,400 |
4.5% |
| ALPINE |
510 |
470 |
40 |
7.5% |
| AMADOR |
14,570 |
13,830 |
740 |
5.1% |
| BUTTE |
91,100 |
86,200 |
4,900 |
5.3% |
| CALAVERAS |
22,5100 |
21,560 |
950 |
4.2% |
| COLUSA |
10,5500 |
9,560 |
1,000 |
9.4% |
| CONTRA COSTA |
553,600 |
528,700 |
24,900 |
4.5% |
| DEL NORTE |
9,480 |
8,920 |
560 |
5.9% |
| EL DORADO |
93,900 |
90,100 |
3,900 |
4.1% |
| FRESNO |
458,400 |
426,100 |
32,300 |
7.0% |
| GLENN |
12,240 |
11,450 |
800 |
6.5% |
| HUMBOLDT |
58,800 |
55,800 |
2,900 |
5.0% |
| IMPERIAL |
71,900 |
57,700 |
14,200 |
19.7% |
| INYO |
8,360 |
8,040 |
320 |
3.8% |
| KERN |
397,400 |
365,300 |
32,000 |
8.1% |
| KINGS |
57,500 |
53,100 |
4,400 |
7.7% |
| LAKE |
28,1600 |
26,590 |
1,570 |
5.6% |
| LASSEN |
8,760 |
8,340 |
420 |
4.8% |
| LOS ANGELES |
5,004,300 |
4,712,300 |
292,000 |
5.8% |
| MADERA |
64,700 |
60,100 |
4,600 |
7.0% |
| MARIN |
132,300 |
127,400 |
4,900 |
3.7% |
| MARIPOSA |
7,700 |
7,330 |
370 |
4.8% |
| MENDOCINO |
36,630 |
34,930 |
1,700 |
4.6% |
| MERCED |
116,100 |
106,100 |
10,000 |
8.6% |
| MODOC |
3,230 |
3,070 |
160 |
5.1% |
| MONO |
9,160 |
8,810 |
350 |
3.9% |
| MONTEREY |
237,300 |
225,700 |
11,700 |
4.9% |
| NAPA |
72,000 |
69,400 |
2,600 |
3.6% |
| NEVADA |
47,630 |
45,640 |
1,990 |
4.2% |
| ORANGE |
1,592,500 |
1,529,900 |
62,600 |
3.9% |
| PLACER |
195,700 |
187,800 |
7,800 |
4.0% |
| PLUMAS |
7,520 |
7,090 |
430 |
5.7% |
| RIVERSIDE |
1,143,100 |
1,081,300 |
61,800 |
5.4% |
| SACRAMENTO |
734,900 |
700,400 |
34,500 |
4.7% |
| SAN BENITO |
32,500 |
30,700 |
1,800 |
5.6% |
| SAN BERNARDINO |
999,400 |
948,400 |
51,000 |
5.1% |
| SAN DIEGO |
1,594,100 |
1,525,700 |
68,400 |
4.3% |
| SAN FRANCISCO |
578,400 |
557,800 |
20,600 |
3.6% |
| SAN JOAQUIN |
345,900 |
324,400 |
21,500 |
6.2% |
| SAN LUIS OBISPO |
138,100 |
133,000 |
5,100 |
3.7% |
| SAN MATEO |
457,100 |
441,900 |
15,200 |
3.3% |
| SANTA BARBARA |
226,100 |
217,300 |
8,800 |
3.9% |
| SANTA CLARA |
1,051,800 |
1,011,100 |
40,700 |
3.9% |
| SANTA CRUZ |
135,800 |
128,900 |
6,900 |
5.1% |
| SHASTA |
73,000 |
69,300 |
3,700 |
5.1% |
| SIERRA |
1,350 |
1,290 |
60 |
4.1% |
| SISKIYOU |
17,230 |
16,240 |
1,000 |
5.8% |
| SOLANO |
202,000 |
192,100 |
9,900 |
4.9% |
| SONOMA |
250,100 |
240,500 |
9,600 |
3.8% |
| STANISLAUS |
241,200 |
225,500 |
15,700 |
6.5% |
| SUTTER |
47,700 |
44,700 |
3,100 |
6.5% |
| TEHAMA |
25,770 |
24,210 |
1,560 |
6.0% |
| TRINITY |
4,650 |
4,410 |
240 |
5.2% |
| TULARE |
209,400 |
188,800 |
20,600 |
9.8% |
| TUOLUMNE |
20,280 |
19,240 |
1,040 |
5.1% |
| VENTURA |
412,100 |
393,000 |
19,100 |
4.6% |
| YOLO |
110,400 |
105,300 |
5,100 |
4.7% |
| YUBA |
32,300 |
30,300 |
2,000 |
6.3% |