NR No. 23-36
Contact: Loree Levy/Aubrey Henry
916-654-9029
mediainquiries@edd.ca.gov
IMPORTANT NOTE: The employment data for the month of Aug. 2023 is taken from the survey week including Aug. 12th. Data for the month of Sept. is scheduled for release on Oct. 20, 2023.
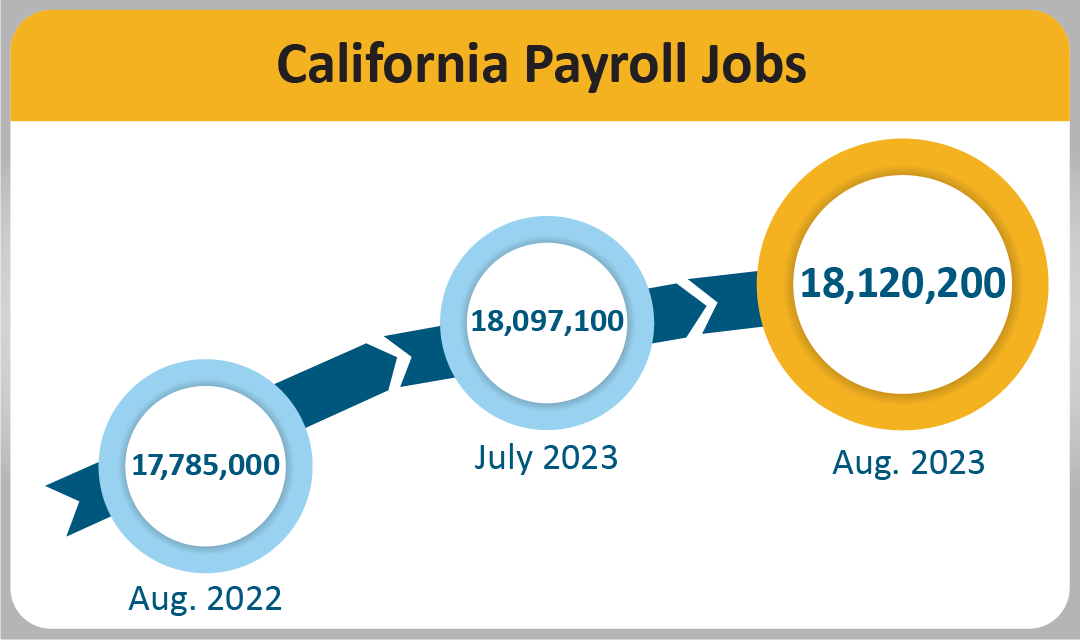
Employers added 23,100 nonfarm payroll jobs
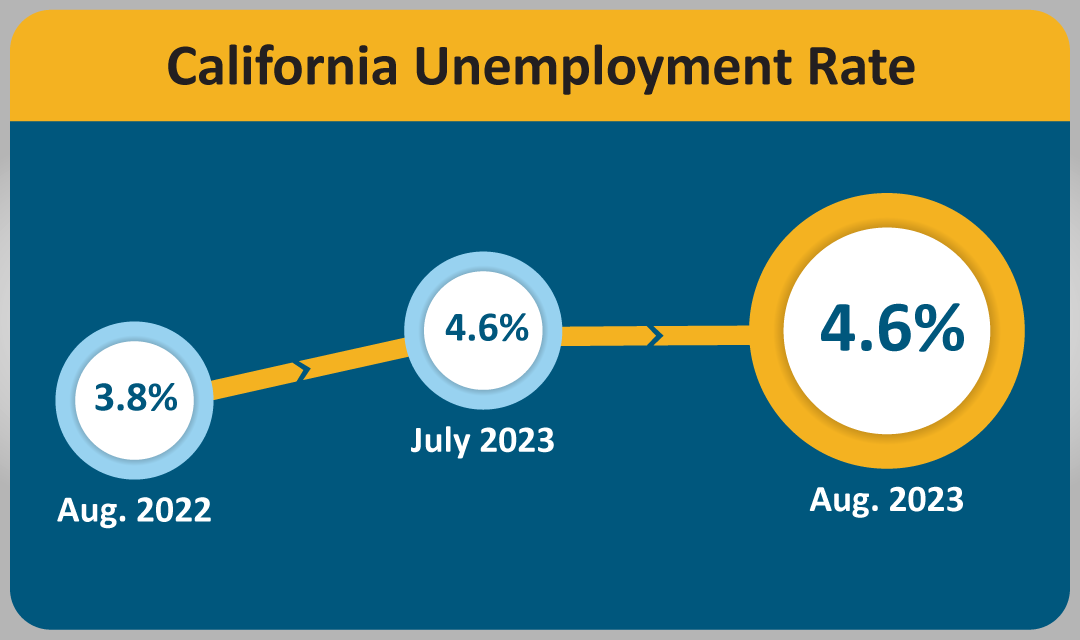
SACRAMENTO – California’s unemployment rate remained at 4.6 percent1, for the third consecutive month as the state’s employers added 23,100 nonfarm payroll jobs2 to the economy, according to data released today by the California Employment Development Department (EDD) from two surveys. Total nonfarm employment for July 2023 was revised down by 19,000 jobs due to revised reductions in Leisure & Hospitality, Information, and Government industry sectors.
California’s Labor Market, by the Numbers…
- Since the current economic expansion began in April 2020, California has gained 3,202,200 jobs, which averages out to a gain of 80,055 jobs per month.
- California’s August nonfarm job gain was 12.4 percent of the national job gain, more than California’s 11.6% share of the U.S total nonfarm employment.
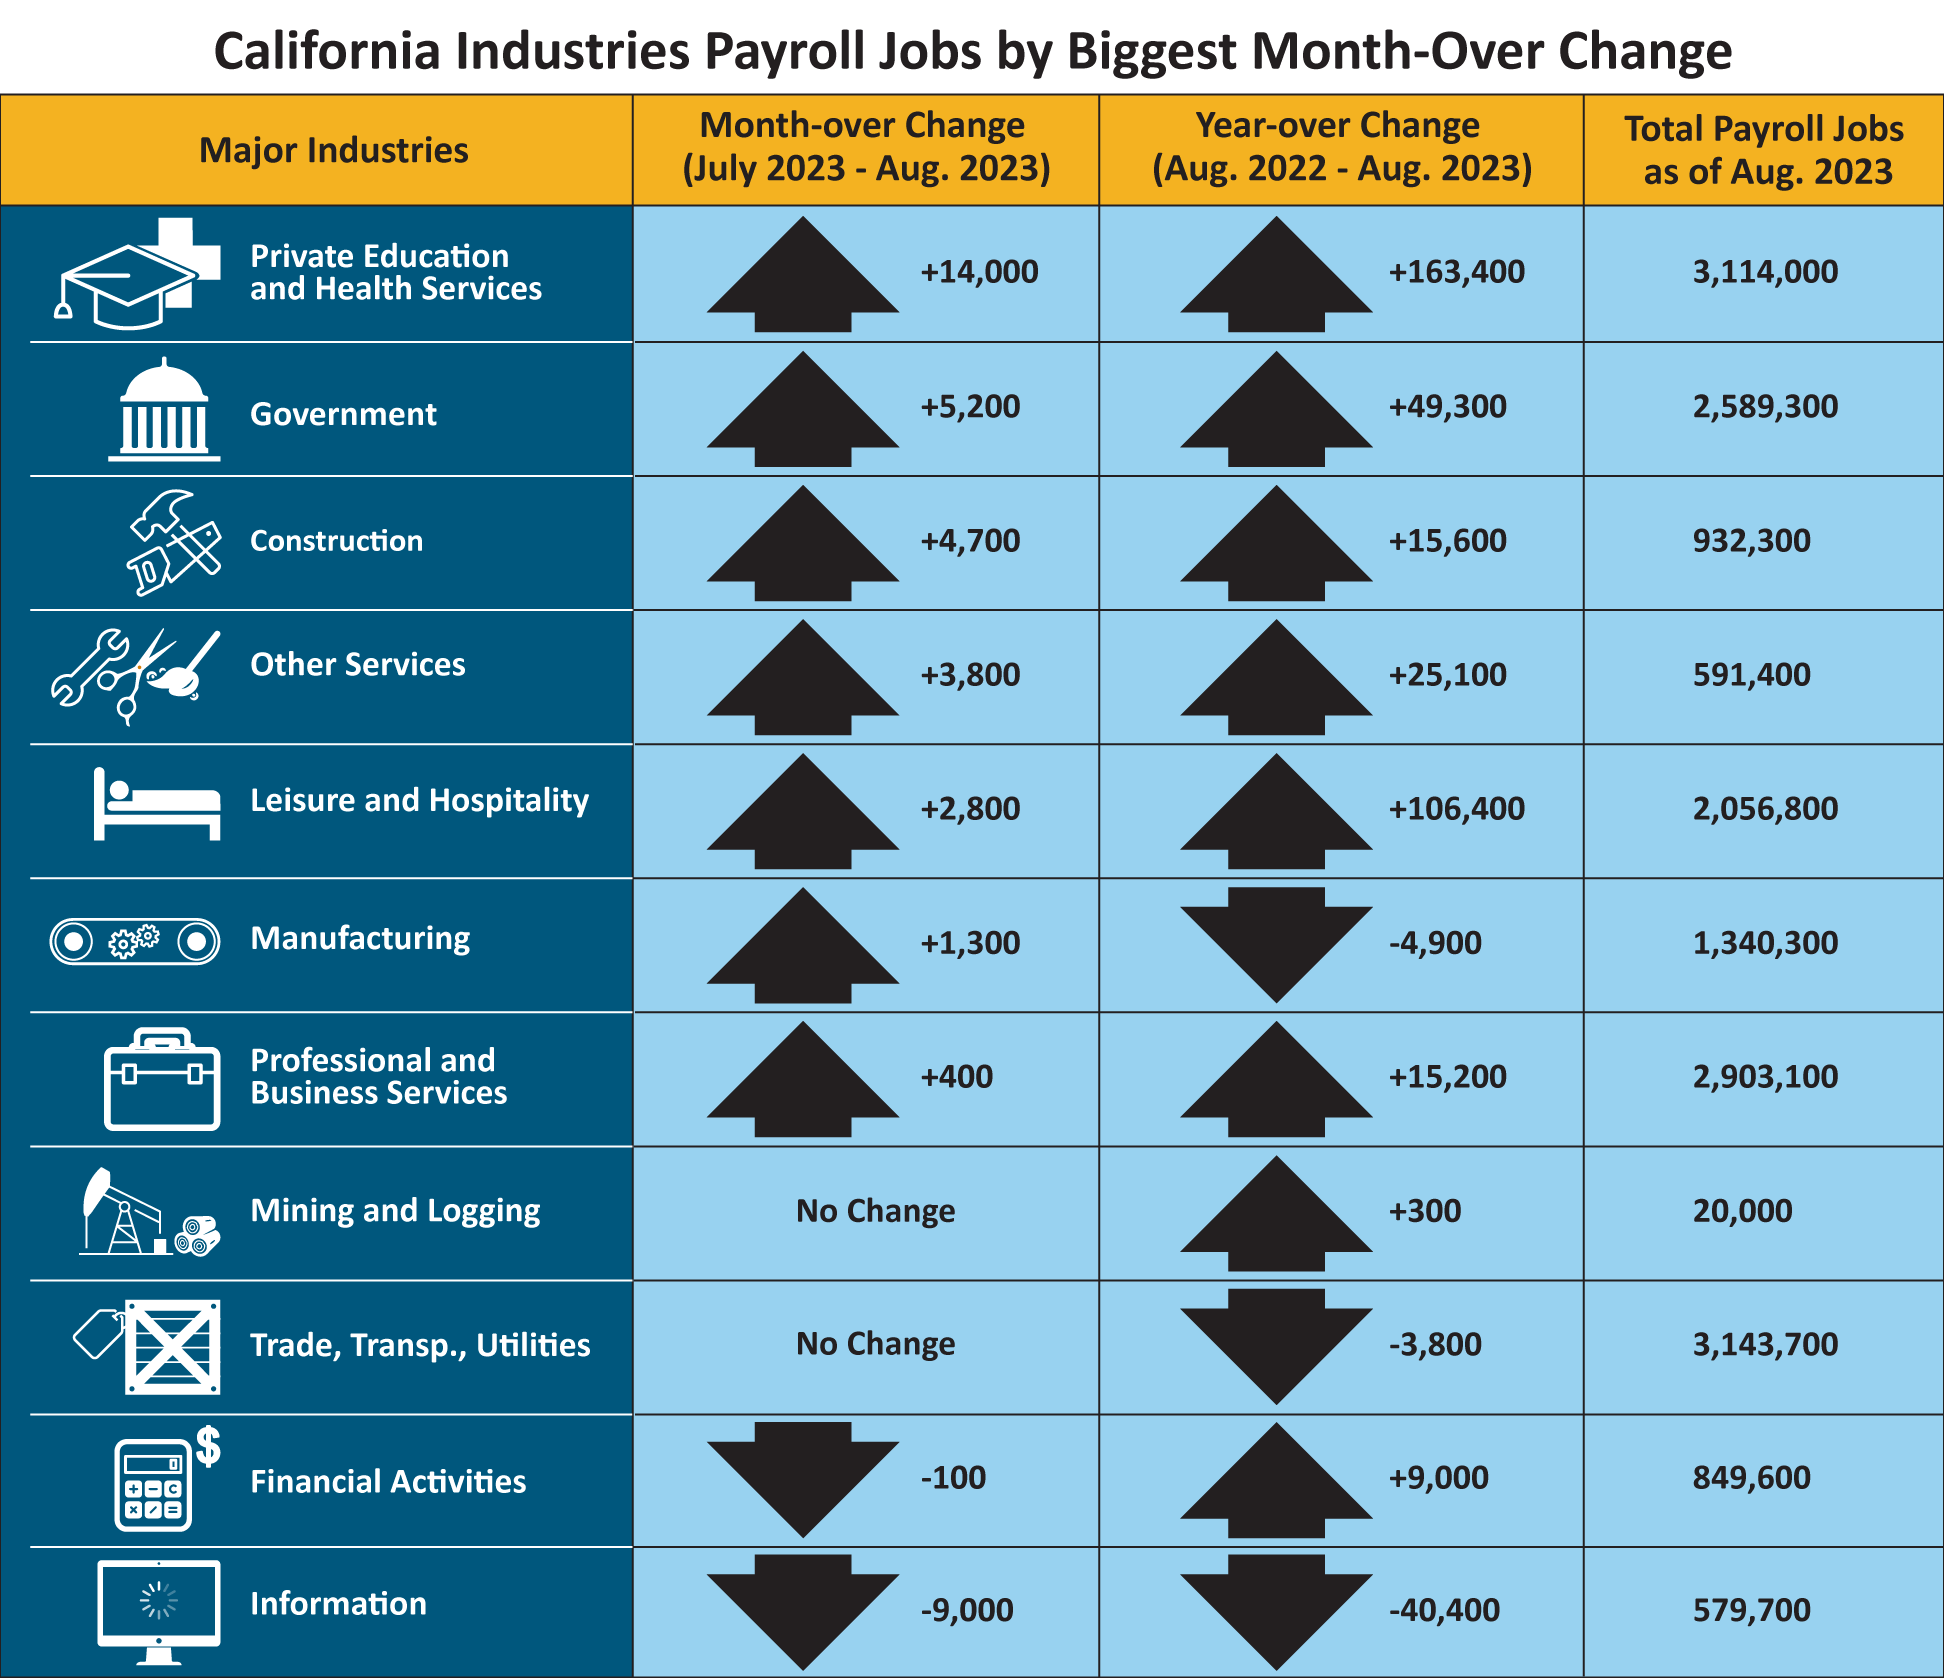
- Seven of California’s 11 industry sectors gained jobs in August with Private Education & Health Services (+14,000) leading the way thanks to strength in Individual and Family Services, as well as increases in Private Colleges, Universities, and Professional Schools.
- Government (+5,200) also showed good gains thanks largely to increases in Local Government Educational Services.
- Most of the losses in Information (-9,000) came in Motion Picture and Sound Recording, impacted at least in part by the writers’ and actors’ strikes. Additional losses coming in Computing Infrastructure Providers, Data Processing, Web Hosting, and Related Services
1. The unemployment rate comes from a separate federal survey of 5,100 California households.
2. The nonfarm payroll job numbers come from a federal survey of 80,000 California businesses.
Data Trends about Jobs in the Economy
Total Nonfarm Payroll Jobs (Comes from a monthly survey of approximately 80,000 California businesses that estimates jobs in the economy – seasonally adjusted)
- Month-over – Total nonfarm jobs in California’s 11 major industries totaled 18,120,200 in August – a net gain of 23,100 from July. This followed a downward revised (-19,000) month-over gain of 8,900 jobs in July.
- Year-over – Total nonfarm jobs increased by 335,200 (a 1.9 percent increase) from August 2022 to August 2023 compared to the U.S. annual gain of 3,087,000 jobs (a 2.0 percent increase).
| Major Industries |
Month-over Change (June 2023–July 2023) |
Year-over Change (July 2022–July 2023) |
Total Payroll Jobs as of July 2023 |
|
Government
|
+15,000 |
+57,600 |
2,594,600 |
|
Private Education and Health Services
|
+10,800 |
+159,400 |
3,102,900 |
|
Leisure and Hospitality
|
+10,300 |
+120,100 |
2,061,800 |
|
Trade, Transp., Utilities
|
+4,500 |
-2,700 |
3,144,500 |
|
Other Services
|
+2,200 |
+23,800 |
588,000 |
| Manufacturing |
+1,900 |
+1,800 |
1,339,700 |
|
Construction
|
+500 |
+13,800 |
928,300 |
|
Mining and Logging
|
-100 |
+200 |
19,900 |
|
Financial Activities
|
-2,000 |
+4,500 |
847,000 |
|
Information
|
-3,800 |
-26,000 |
593,600 |
|
Professional and Business Services
|
-11,400 |
+14,700 |
2,895,800 |
Total Farm jobs – The number of jobs in the agriculture industry decreased from July by 1,300 to a total of 430,500 jobs in August. The agricultural industry had 8,600 more farm jobs in August 2023 than it did in August a year ago.
Data trends about Workers in the Economy
Employment and Unemployment in California (Based on a monthly federal survey of 5,100 California households which focuses on workers in the economy)
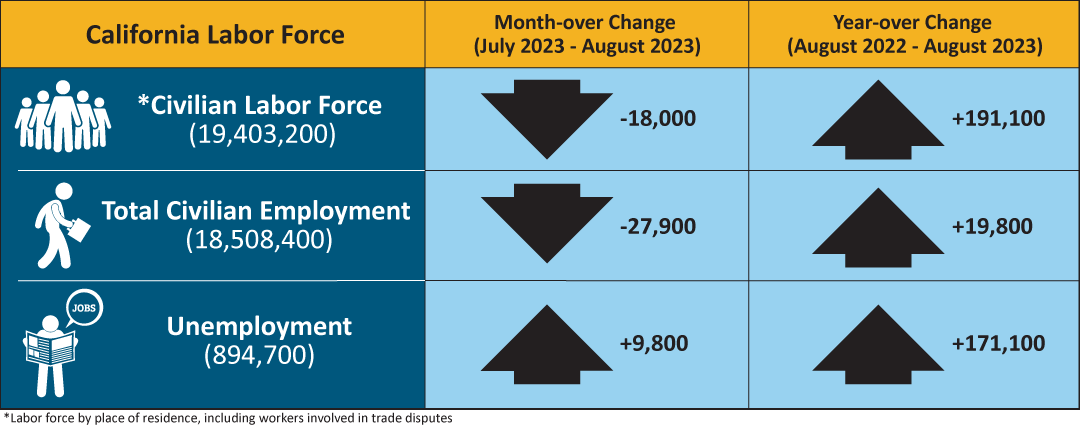
- Employed – The number of Californians employed in August was 18,508,400, a decrease of 27,900 persons from July’s total of 18,536,300, but up 19,800 from the employment total in August 2022.
- Unemployed – The number of unemployed Californians was 894,700 in August, an increase of 9,800 over the month and up 171,100 in comparison to August 2022.
| California Labor Force |
Month-over Change (June 2023–July 2023) |
Year-over Change (July 2022–July 2023) |
| * Civilian Labor Force (19,422,000) |
-21,700 |
+183,700 |
| Total Civilian Employment (18,537,400) |
-17,000 |
+31,300 |
| Unemployment (884,600) |
-4,700 |
+152,400 |
* Labor force by place of residence, including workers involved in trade disputes.
Unemployment Insurance Claims (not seasonally adjusted)
The following data is from a sample week that includes the 19th of each month: In related data that figures into the state’s unemployment rate, there were 394,757 people certifying for Unemployment Insurance benefits during the August 2023 sample week. That compares to 401,745 people in July and 310,212 people in August 2022. Concurrently, 37,974 initial claims were processed in the August 2023 sample week, which was a month-over decrease of 5,779 claims from July, but a year-over increase of 774 claims from August 2022.
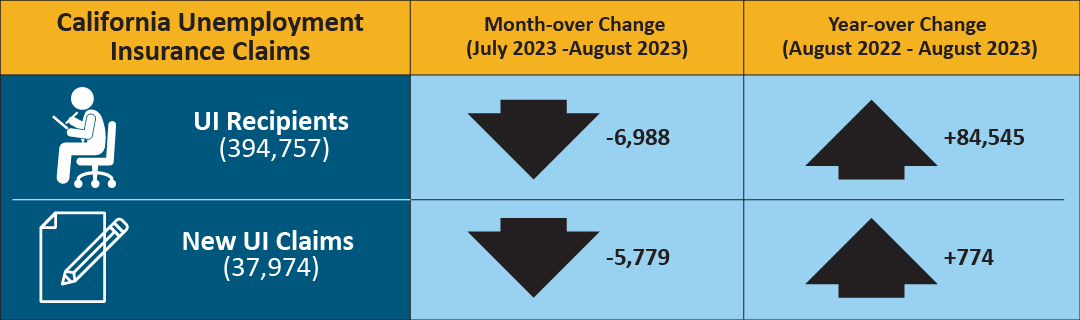
| California Unemployment Insurance Claims |
Month-over Change (July 2023 - Aug. 2023) |
Year-over Change (Aug. 2022 - Aug. 2023) |
| UI Recipients (394,757) |
-6,988 |
+84,545 |
| New UI Claims (37,974) |
-5,779 |
+774 |
MONTHLY LABOR FORCE DATA FOR COUNTIES
August 2023 (Preliminary); 2022 Benchmark
NOT SEASONALLY ADJUSTED
| COUNTY |
LABOR FORCE |
EMPLOYMENT |
UNEMPLOYMENT |
RATE |
| STATE TOTAL |
19,340,800 |
18,347,200 |
993,600 |
5.1% |
| ALAMEDA |
831,600 |
794,200 |
37,400 |
4.5% |
| ALPINE |
510 |
470 |
40 |
7.5% |
| AMADOR |
14,570 |
13,830 |
740 |
5.1% |
| BUTTE |
91,100 |
86,200 |
4,900 |
5.3% |
| CALAVERAS |
22,5100 |
21,560 |
950 |
4.2% |
| COLUSA |
10,5500 |
9,560 |
1,000 |
9.4% |
| CONTRA COSTA |
553,600 |
528,700 |
24,900 |
4.5% |
| DEL NORTE |
9,480 |
8,920 |
560 |
5.9% |
| EL DORADO |
93,900 |
90,100 |
3,900 |
4.1% |
| FRESNO |
458,400 |
426,100 |
32,300 |
7.0% |
| GLENN |
12,240 |
11,450 |
800 |
6.5% |
| HUMBOLDT |
58,800 |
55,800 |
2,900 |
5.0% |
| IMPERIAL |
71,900 |
57,700 |
14,200 |
19.7% |
| INYO |
8,360 |
8,040 |
320 |
3.8% |
| KERN |
397,400 |
365,300 |
32,000 |
8.1% |
| KINGS |
57,500 |
53,100 |
4,400 |
7.7% |
| LAKE |
28,1600 |
26,590 |
1,570 |
5.6% |
| LASSEN |
8,760 |
8,340 |
420 |
4.8% |
| LOS ANGELES |
5,004,300 |
4,712,300 |
292,000 |
5.8% |
| MADERA |
64,700 |
60,100 |
4,600 |
7.0% |
| MARIN |
132,300 |
127,400 |
4,900 |
3.7% |
| MARIPOSA |
7,700 |
7,330 |
370 |
4.8% |
| MENDOCINO |
36,630 |
34,930 |
1,700 |
4.6% |
| MERCED |
116,100 |
106,100 |
10,000 |
8.6% |
| MODOC |
3,230 |
3,070 |
160 |
5.1% |
| MONO |
9,160 |
8,810 |
350 |
3.9% |
| MONTEREY |
237,300 |
225,700 |
11,700 |
4.9% |
| NAPA |
72,000 |
69,400 |
2,600 |
3.6% |
| NEVADA |
47,630 |
45,640 |
1,990 |
4.2% |
| ORANGE |
1,592,500 |
1,529,900 |
62,600 |
3.9% |
| PLACER |
195,700 |
187,800 |
7,800 |
4.0% |
| PLUMAS |
7,520 |
7,090 |
430 |
5.7% |
| RIVERSIDE |
1,143,100 |
1,081,300 |
61,800 |
5.4% |
| SACRAMENTO |
734,900 |
700,400 |
34,500 |
4.7% |
| SAN BENITO |
32,500 |
30,700 |
1,800 |
5.6% |
| SAN BERNARDINO |
999,400 |
948,400 |
51,000 |
5.1% |
| SAN DIEGO |
1,594,100 |
1,525,700 |
68,400 |
4.3% |
| SAN FRANCISCO |
578,400 |
557,800 |
20,600 |
3.6% |
| SAN JOAQUIN |
345,900 |
324,400 |
21,500 |
6.2% |
| SAN LUIS OBISPO |
138,100 |
133,000 |
5,100 |
3.7% |
| SAN MATEO |
457,100 |
441,900 |
15,200 |
3.3% |
| SANTA BARBARA |
226,100 |
217,300 |
8,800 |
3.9% |
| SANTA CLARA |
1,051,800 |
1,011,100 |
40,700 |
3.9% |
| SANTA CRUZ |
135,800 |
128,900 |
6,900 |
5.1% |
| SHASTA |
73,000 |
69,300 |
3,700 |
5.1% |
| SIERRA |
1,350 |
1,290 |
60 |
4.1% |
| SISKIYOU |
17,230 |
16,240 |
1,000 |
5.8% |
| SOLANO |
202,000 |
192,100 |
9,900 |
4.9% |
| SONOMA |
250,100 |
240,500 |
9,600 |
3.8% |
| STANISLAUS |
241,200 |
225,500 |
15,700 |
6.5% |
| SUTTER |
47,700 |
44,700 |
3,100 |
6.5% |
| TEHAMA |
25,770 |
24,210 |
1,560 |
6.0% |
| TRINITY |
4,650 |
4,410 |
240 |
5.2% |
| TULARE |
209,400 |
188,800 |
20,600 |
9.8% |
| TUOLUMNE |
20,280 |
19,240 |
1,040 |
5.1% |
| VENTURA |
412,100 |
393,000 |
19,100 |
4.6% |
| YOLO |
110,400 |
105,300 |
5,100 |
4.7% |
| YUBA |
32,300 |
30,300 |
2,000 |
6.3% |