Important Note: The employment data for the month of April 2026 comes from the survey week that included April 12. The release date for May 2026 data is scheduled for release on June 19.
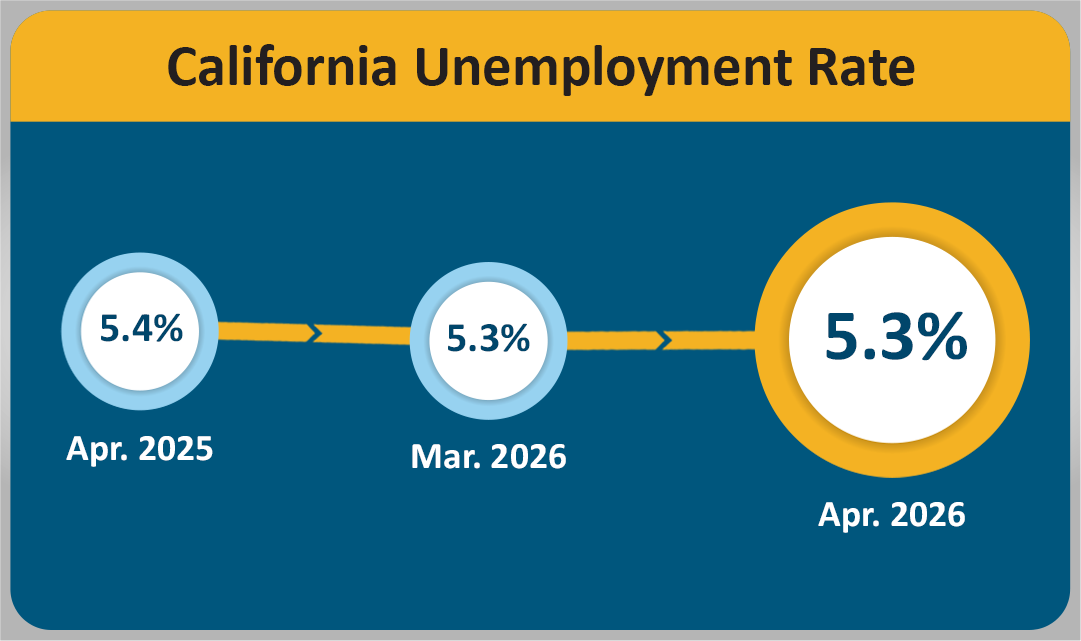
SACRAMENTO — California’s unemployment rate stayed at 5.3 percent1 in April 2026, matching the rate from the previous month. The State lost 3,300 nonfarm payroll jobs2 in April 2026, according to recent data released by the Employment Development Department (EDD) coming from two separate surveys. Total nonfarm employment for March was revised up (+8,800) to a total gain of 37,500 jobs for the month.
California's Labor Market, by the Numbers...
- California has added 97,200 jobs since the beginning of 2026, which averages out to 24,300 jobs per month.
- April’s number of unemployed Californians (-7,500 for the month) marks the sixth consecutive month of declines, totaling 51,400 persons over that timeframe.
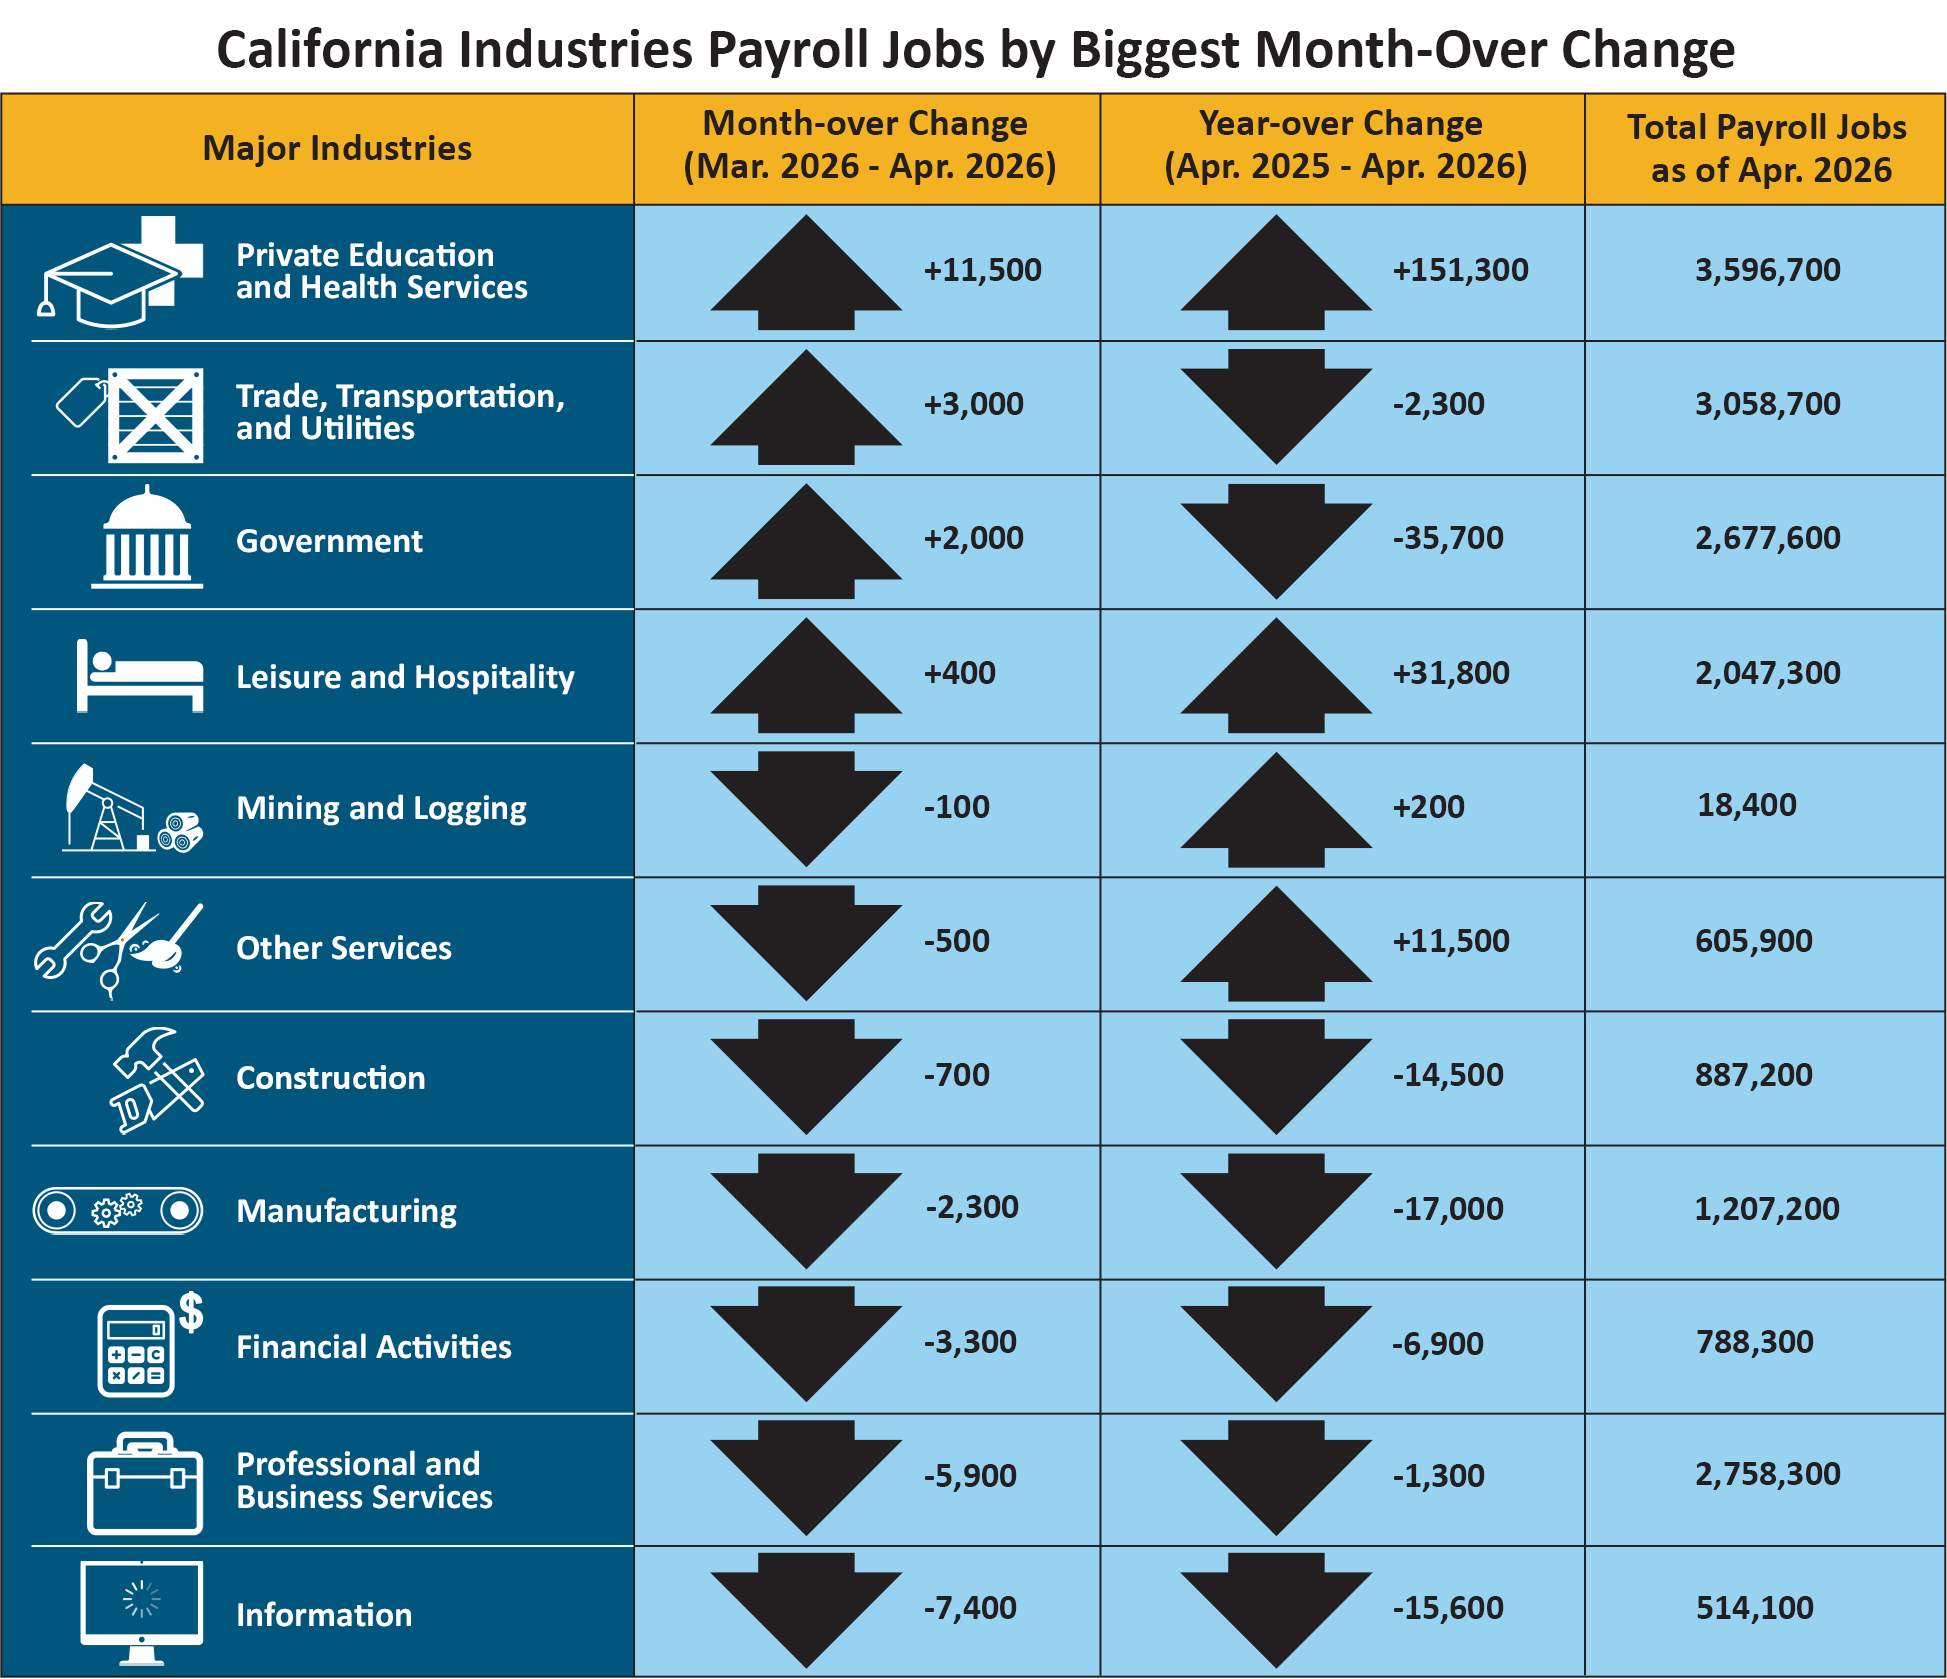
- Four of California's 11 industry sectors gained jobs in April, led once again by gains in Private Education & Health Services (+11,500) with above-average gains being seen in Offices of Dentists, Home Health Care Services, Nursing Care Facilities, and Individual and Family Services as California’s population continues to age.
- Trade, Transportation, and Utilities (+3,000) moved against trend and showed gains thanks to increased employment in Building Materials and Garden Equipment Supply Dealers, Gas Stations and Fuel Dealers, and Truck Transportation despite rising gas prices.
- Information (-7,400) suffered the largest month-over loss for the State as declines were experienced in Publishing Industries as well as with Broadcasting and Computing Infrastructure Providers, Data Processing, Web Hosting, and Related Services. Software Publishers has declined to its lowest employment level since before the COVID-19 pandemic.
1. The unemployment rate comes from a separate federal survey of 4,400 California households.
2. The nonfarm payroll job numbers come from a federal survey of 80,000 California businesses.
Data Trends about Jobs in the Economy
Total Nonfarm Payroll Jobs (Comes from a monthly survey of approximately 80,000 California businesses – seasonally adjusted)
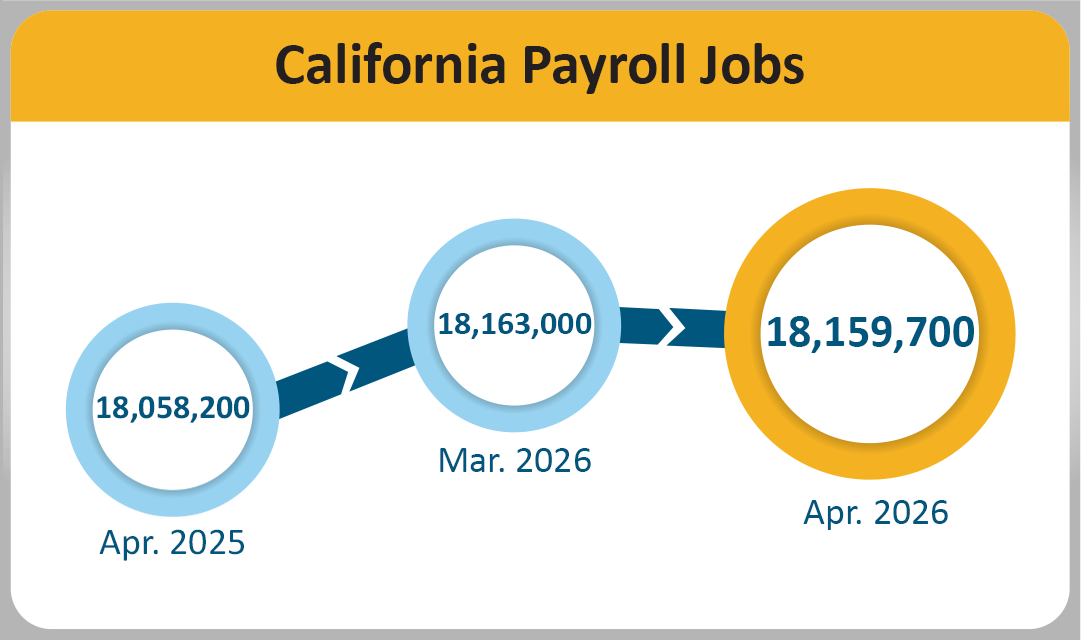
- Month-over – Total nonfarm jobs in California’s 11 major industries amounted to 18,159,700 in April – a loss of 3,300 from March. This followed March’s upward revision of 8,800 jobs, resulting in a month-over March gain of 37,500 jobs.
- Year-over – Total nonfarm jobs increased by 101,500 (0.56 percent increase) from April 2025 to April 2026 compared to the U.S. year-over gain of 251,000 jobs (0.16 percent increase).
| Major Industries | Month-over Change (Mar. 2026 - Apr. 2026) |
Year-over Change (Apr. 2025 - Apr. 2026) |
Total Payroll Jobs as of Apr. 2026 |
|---|---|---|---|
|
Private Education and Health Services |
+11,500 | +151,300 | 3,596,700 |
|
Trade, Transportation, and Utilities |
+3,000 | -2,300 | 3,058,700 |
|
Government |
+2,000 | -35,700 | 2,677,600 |
|
Leisure and Hospitality |
+400 | +31,800 | 2,047,300 |
|
Mining and Logging |
-100 | +200 | 18,400 |
| Other Services | -500 | +11,500 | 605,900 |
|
Construction |
-700 | -14,500 | 887,200 |
|
Manufacturing |
-2,300 | -17,000 | 1,207,200 |
|
Financial Activities |
-3,300 | -6,900 | 788,300 |
| Professional and Business Services | -5,900 | -1,300 | 2,758,300 |
|
Information |
-7,400 | -15,600 | 514,100 |
Total Farm Jobs – The number of jobs in the agriculture industry decreased from March by 3,300 to a total of 409,800 jobs in April. The agriculture industry had 16,100 more farm jobs in April 2026 than it did in April 2025.
Data Trends about Workers in the Economy
Employment and Unemployment in California (Based on a monthly federal survey of 4,400 California households which focuses on workers in the economy)
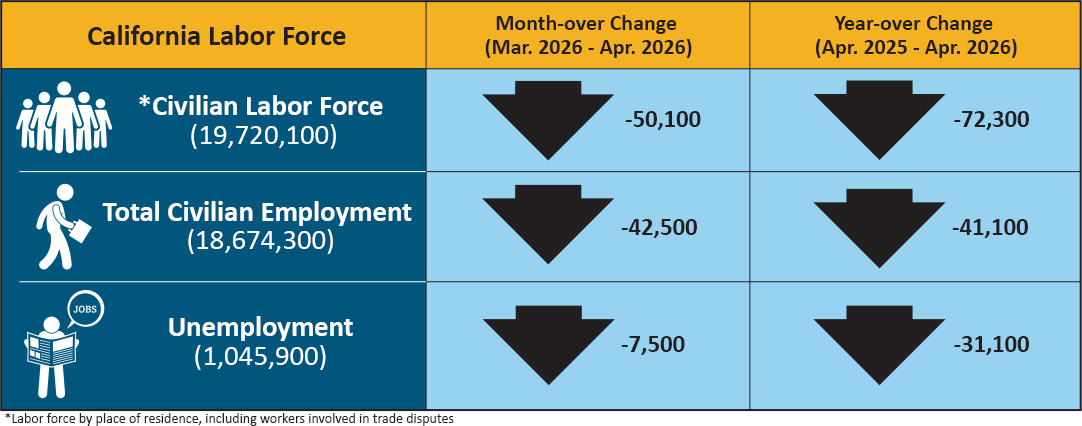
- Employed – The number of Californians employed in April was 18,674,300, a decrease of 42,500 from March and down 41,100 compared to April of last year.
- Unemployed – The number of unemployed Californians was 1,045,900 in April, a decrease of 7,500 from March and a decrease of 31,100 from April 2025.
Data Trends Accordion Panel
| California Labor Force | Month-over Change (Mar. 2026 – Apr. 2026) | Year-over Change (Apr. 2025 – Apr. 2026) |
|---|---|---|
| * Civilian Labor Force (19,720,100) | -50,100 | -72,300 |
| Total Civilian Employment (18,674,300) | -42,500 | -41,100 |
| Unemployment (1,045,600) | -7,500 | -31,100 |
* Labor force by place of residence, including workers involved in trade disputes.
Unemployment Insurance Claims (Not Seasonally Adjusted)
The following data is from a sample week that includes the 19th of each month:
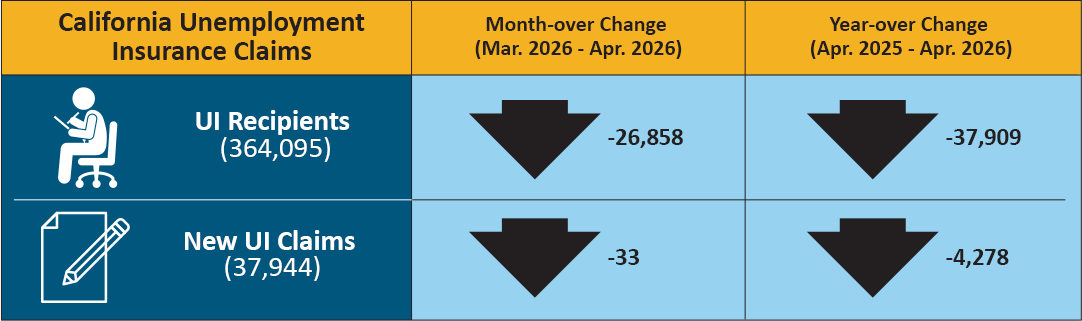
In related data that figures into the State’s unemployment rate, there were 364,095 people certifying for Unemployment Insurance (UI) benefits during the April 2026 sample week. That compares to 390,953 people in March and 402,004 people in April 2025. Concurrently, 37,944 initial claims were processed in the April 2026 sample week, which was a month-over decrease of 33 claims from March and a year-over decrease of 4,278 claims from April 2025.
| California Unemployment Insurance Claims | Month-over Change (Mar. 2026 – Apr. 2026) | Year-over Change (Apr. 2025 – Apr. 2026) |
|---|---|---|
| UI Recipients (364,095) | -26,858 | -37,909 |
| New UI Claims (37,944) | -33 | -4,278 |
| COUNTY | LABOR FORCE | EMPLOYMENT | UNEMPLOYMENT | RATE |
|---|---|---|---|---|
| STATE TOTAL |
19,532,800 |
18,565,500 |
967,300 |
5.0% |
| ALAMEDA | 856,300 | 821,400 | 34,900 | 4.1% |
| ALPINE | 550 | 510 | 40 | 6.9% |
| AMADOR | 15,030 | 14,230 | 800 | 5.3% |
| BUTTE | 90,200 | 85,200 | 5,100 | 5.6% |
| CALAVERAS | 17,430 | 16,420 | 1,010 | 5.8% |
| COLUSA | 11,650 | 10,080 | 1,570 | 13.5% |
| CONTRA COSTA | 574,800 | 550,600 | 24,200 | 4.2% |
| DEL NORTE | 9,270 | 8,720 | 560 | 6.0% |
| EL DORADO | 89,800 | 85,700 | 4,100 | 4.6% |
| FRESNO | 476,700 | 437,700 | 39,000 | 8.2% |
| GLENN | 11,740 | 10,950 | 790 | 6.7% |
| HUMBOLDT | 59,900 | 57,100 | 2,900 | 4.8% |
| IMPERIAL | 72,500 | 60,500 | 12,000 | 16.5% |
| INYO | 8,270 | 7,920 | 350 | 4.2% |
| KERN | 408,100 | 372,600 | 35,500 | 8.7% |
| KINGS | 59,300 | 54,000 | 5,300 | 8.9% |
| LAKE | 26,360 | 24,600 | 1,760 | 6.7% |
| LASSEN | 8,050 | 7,530 | 520 | 6.4% |
| LOS ANGELES | 5,021,900 | 4,762,800 | 259,100 | 5.2% |
| MADERA | 70,500 | 65,100 | 5,400 | 7.7% |
| MARIN | 122,500 | 117,900 | 4,500 | 3.7% |
| MARIPOSA | 7,090 | 6,660 | 420 | 6.0% |
| MENDOCINO | 36,390 | 34,500 | 1,890 | 5.2% |
| MERCED | 123,000 | 111,200 | 11,800 | 9.6% |
| MODOC | 3,070 | 2,860 | 220 | 7.0% |
| MONO | 8,970 | 8,690 | 290 | 3.2% |
| MONTEREY | 222,900 | 206,900 | 16,000 | 7.2% |
| NAPA | 73,200 | 70,300 | 2,900 | 4.0% |
| NEVADA | 46,720 | 44,630 | 2,100 | 4.5% |
| ORANGE | 1,605,600 | 1,546,600 | 59,000 | 3.7% |
| PLACER | 207,800 | 199,800 | 8,000 | 3.9% |
| PLUMAS | 7,410 | 6,840 | 570 | 7.6% |
| RIVERSIDE | 1,186,800 | 1,128,400 | 58,400 | 4.9% |
| SACRAMENTO | 781,800 | 746,400 | 35,300 | 4.5% |
| SAN BENITO | 34,300 | 32,200 | 2,100 | 6.2% |
| SAN BERNARDINO | 1,026,900 | 977,600 | 49,200 | 4.8% |
| SAN DIEGO | 1,654,800 | 1,587,000 | 67,800 | 4.1% |
| SAN FRANCISCO | 498,000 | 480,400 | 17,600 | 3.5% |
| SAN JOAQUIN | 370,800 | 348,100 | 22,600 | 6.1% |
| SAN LUIS OBISPO | 131,700 | 126,400 | 5,200 | 4.0% |
| SAN MATEO | 407,600 | 393,900 | 13,600 | 3.3% |
| SANTA BARBARA | 223,600 | 214,500 | 9,200 | 4.1% |
| SANTA CLARA | 1,025,400 | 987,900 | 37,500 | 3.7% |
| SANTA CRUZ | 136,200 | 127,700 | 8,400 | 6.2% |
| SHASTA | 81,200 | 77,200 | 4,000 | 5.0% |
| SIERRA | 1,350 | 1,270 | 70 | 5.5% |
| SISKIYOU | 16,140 | 14,960 | 1,170 | 7.3% |
| SOLANO | 217,900 | 207,500 | 10,300 | 4.7% |
| SONOMA | 244,600 | 234,800 | 9,800 | 4.0% |
| STANISLAUS | 252,500 | 235,400 | 17,100 | 6.8% |
| SUTTER | 46,100 | 42,100 | 4,000 | 8.6% |
| TEHAMA | 27,150 | 25,590 | 1,560 | 5.8% |
| TRINITY | 5,480 | 5,170 | 310 | 5.6% |
| TULARE | 219,200 | 196,800 | 22,300 | 10.2% |
| TUOLUMNE | 21,620 | 20,490 | 1,130 | 5.2% |
| VENTURA | 420,700 | 403,100 | 17,600 | 4.2% |
| YOLO | 112,100 | 106,100 | 5,900 | 5.3% |
| YUBA | 36,000 | 33,700 | 2,300 | 6.4% |