NR No. 23-45
Contact: Loree Levy/Aubrey Henry
916-654-9029
mediainquiries@edd.ca.gov
IMPORTANT NOTE: The employment data for the month of Oct. 2023 is taken from the survey week including Oct. 12th. Data for the month of Nov. is scheduled for release on Dec. 22, 2023.
Employers added 40,200 nonfarm payroll jobs
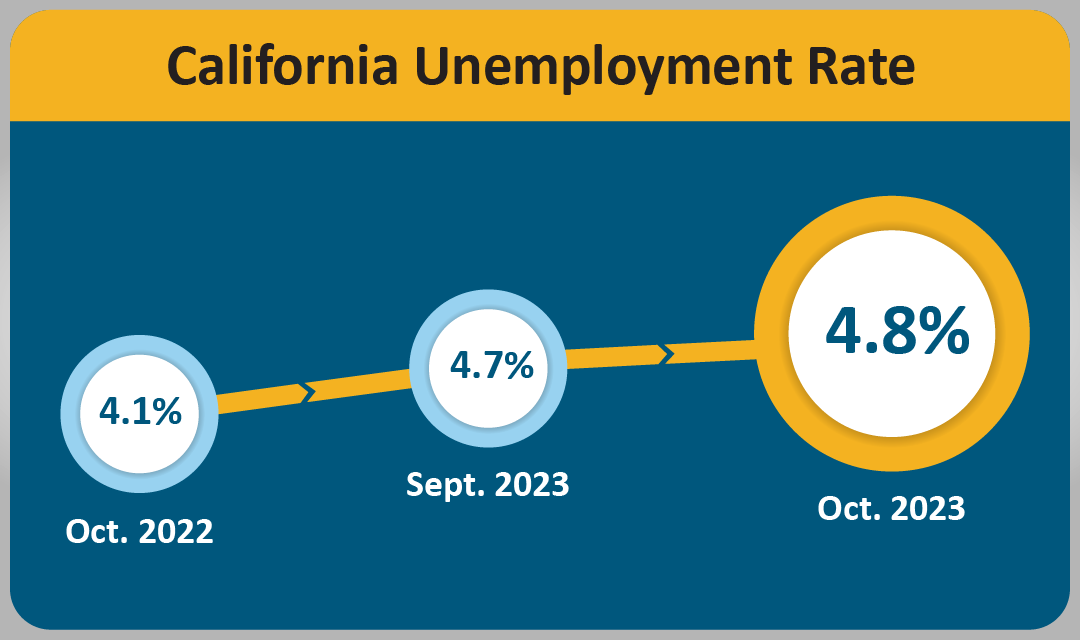
SACRAMENTO – California’s unemployment rate rose by 0.1 percentage point to 4.8 percent1 in October 2023 despite the state’s employers adding 40,200 nonfarm payroll jobs2 to the economy, according to data released today by the California Employment Development Department (EDD) from two separate surveys.
California's Labor Market, by the Numbers...
- Since the current economic expansion began in April 2020, California has gained 3,236,900 jobs, which averages out to a gain of 77,069 jobs per month.
- California’s 40,200 October nonfarm job gain accounted for 26.8 percent of the national job gain of 150,000 for the month.
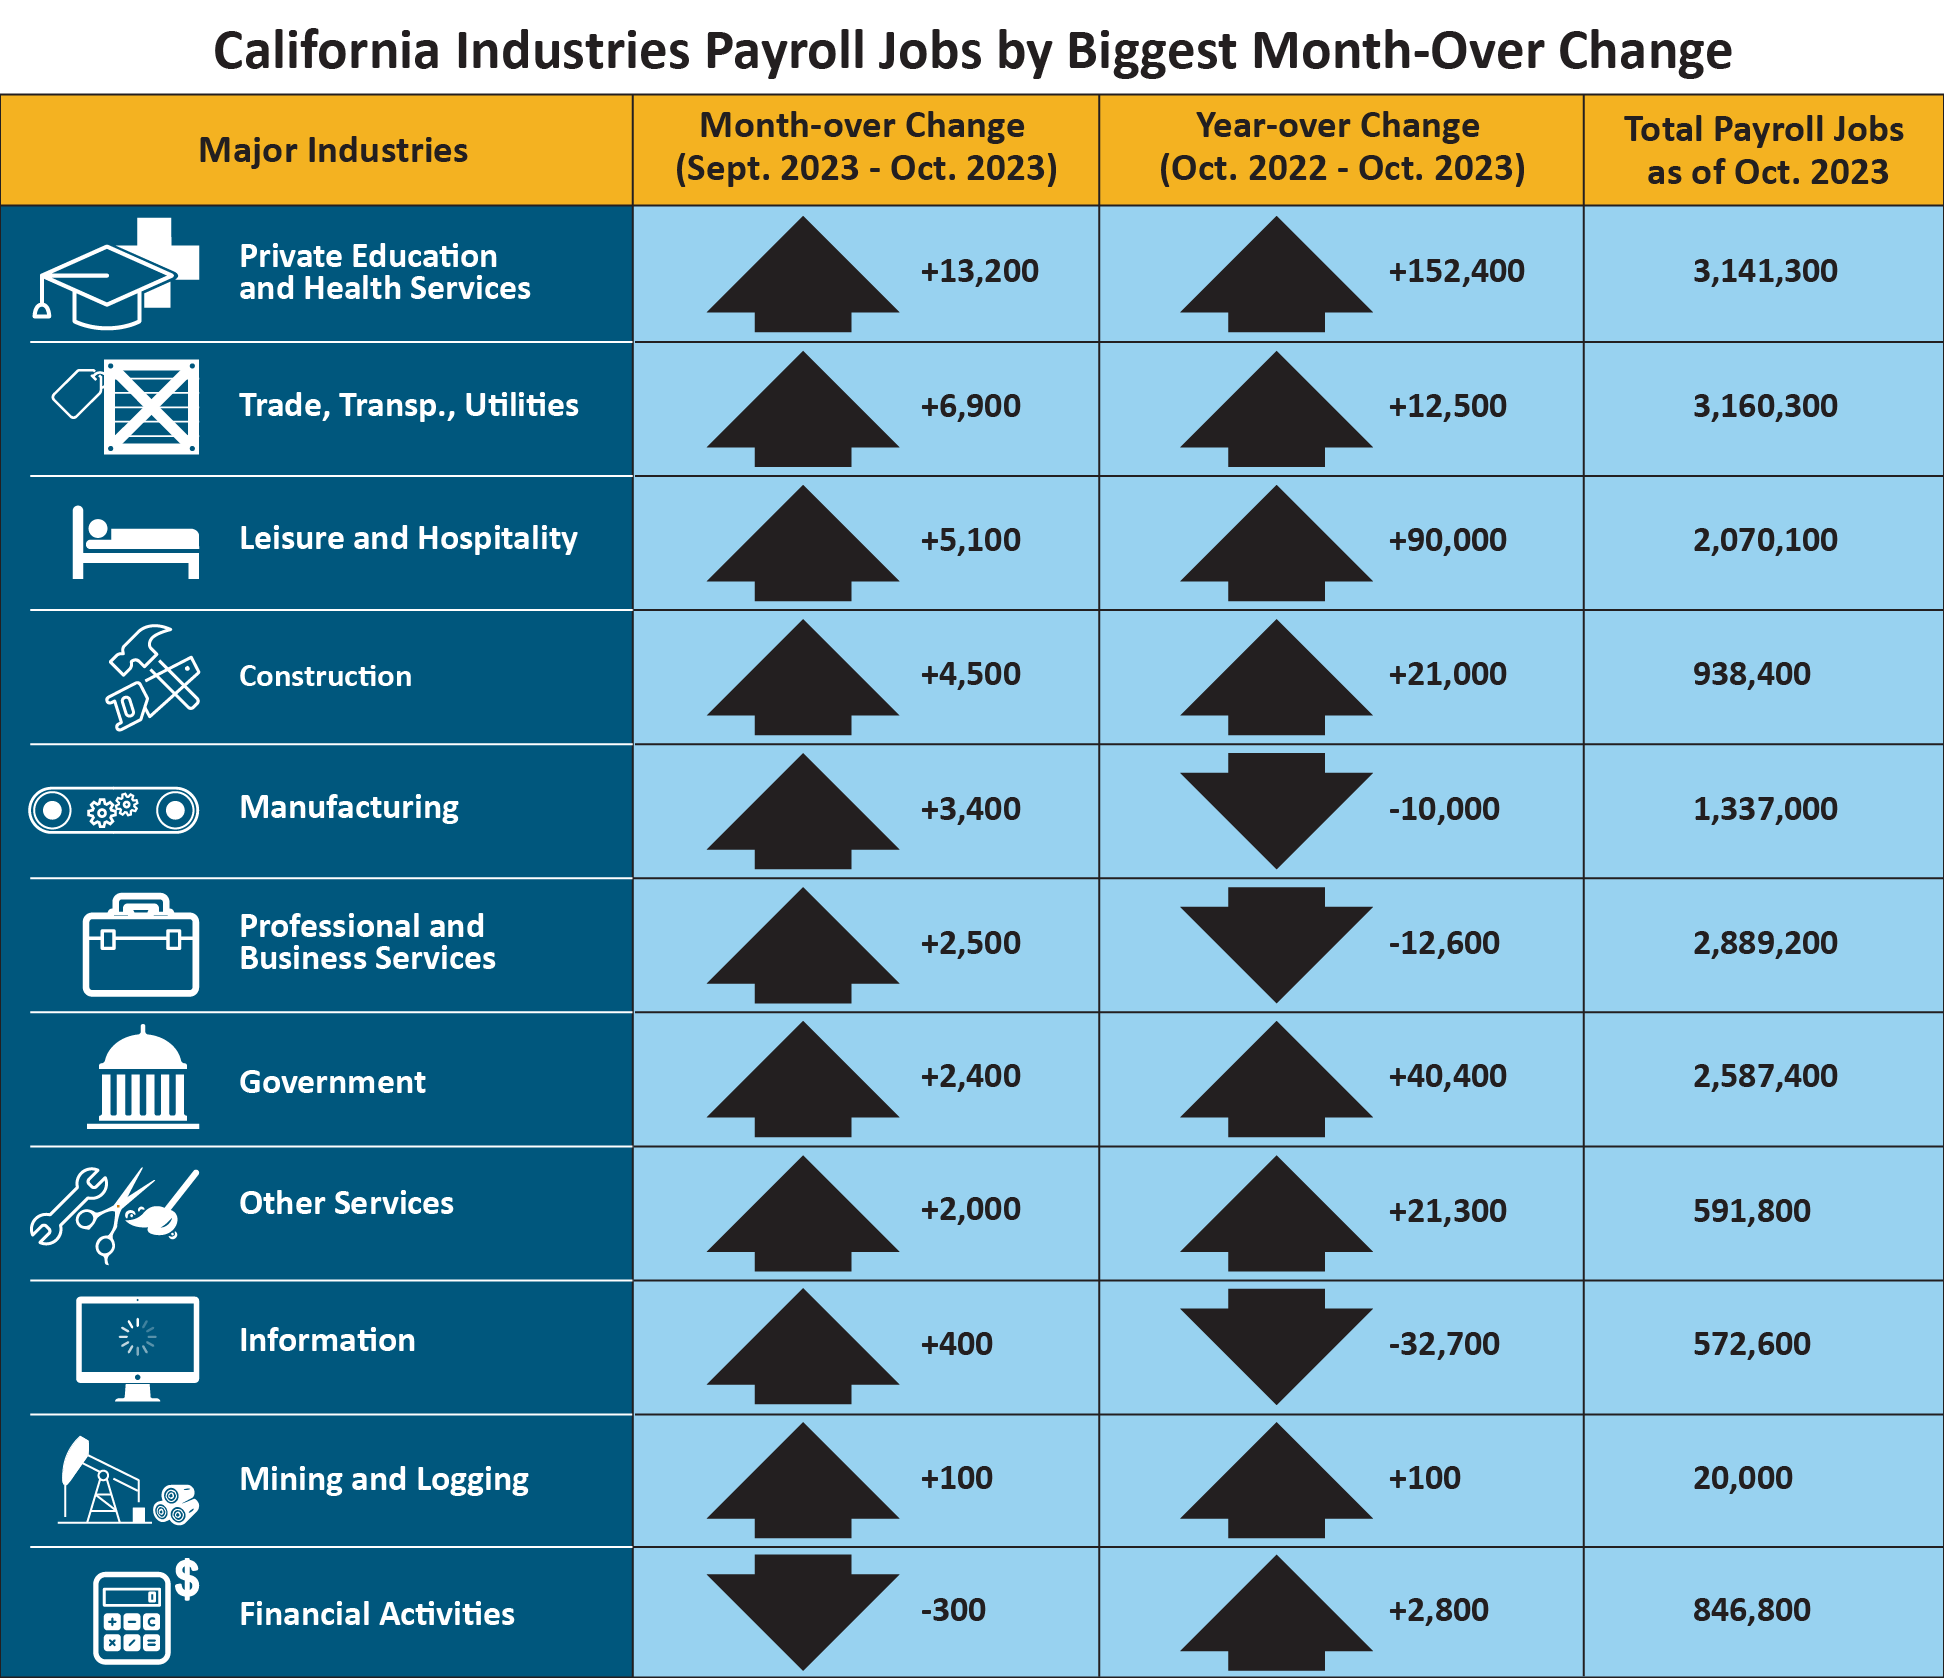
- Ten of California's 11 industry sectors gained jobs in October with Private Education & Health Services (+13,200) once again leading the way. Health Care and Social Assistance experienced a large increase with above average gains in Outpatient Care Centers, Nursing Care Facilities, and Individual and Family Services.
- Trade, Transportation, & Utilities (+6,900) also had strong month-over job gains thanks to increases in Air Transportation along with Couriers and Messengers.
- Financial Activities (-300) was the only industry sector to show a month-over job loss, which was caused by reductions in Credit Intermediation and Related Activities.
1. The unemployment rate comes from a separate federal survey of 5,100 California households.
2. The nonfarm payroll job numbers come from a federal survey of 80,000 California businesses.
Data Trends about Jobs in the Economy
Total Nonfarm Payroll Jobs
Total Nonfarm Payroll Jobs (Comes from a monthly survey of approximately 80,000 California businesses that estimates jobs in the economy – seasonally adjusted)
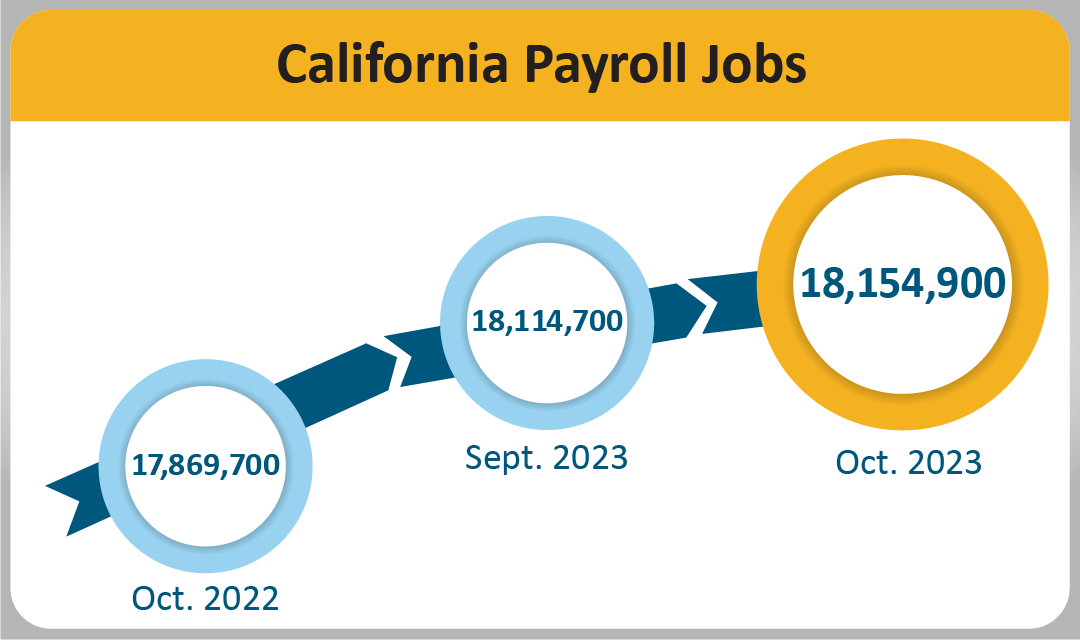
- Month-over – Total nonfarm jobs in California’s 11 major industries totaled 18,154,900 in October – a net gain of 40,200 from September. This followed an upward revised (+5,700) month-over gain of 14,400 jobs in September.
- Year-over – Total nonfarm jobs increased by 285,200 (a 1.6 percent increase) from October 2022 to October 2023 compared to the U.S. annual gain of 2,917,000 jobs (a 1.9 percent increase).
| Major Industries |
Month-over Change (September 2023–October 2023) |
Year-over Change (October 2022–October 2023) |
Total Payroll Jobs as of October 2023 |
|
Private Education and Health Services
|
+13,200 |
+152,400 |
3,141,300 |
|
Trade, Transp., Utilities
|
+6,900 |
+12,500 |
3,160,300 |
|
Leisure and Hospitality
|
+5,100 |
+90,000 |
2,070,100 |
|
Construction
|
+4,500 |
+21,000 |
938,400 |
|
Manufacturing
|
+3,400 |
-10,000 |
1,337,000 |
| Professional and Business Services |
+2,500 |
-12,600 |
2,889,200 |
|
Government
|
+2,400 |
+40,400 |
2,587,400 |
|
Other Services
|
+2,000 |
+21,300 |
591,800 |
|
Information
|
+400 |
-32,700 |
572,600 |
|
Mining and Logging
|
+100 |
+100 |
20,000 |
|
Financial Activities
|
-300 |
+2,800 |
846,800 |
Total Farm jobs – The number of jobs in the agriculture industry decreased from September by 800 to a total of 430,500 jobs in October. The agricultural industry had 4,800 more farm jobs in October 2023 than it did in October a year ago.
Data Trends about Workers in the Economy
Employment and Unemployment in California (Based on a monthly federal survey of 5,100 California households which focuses on workers in the economy)
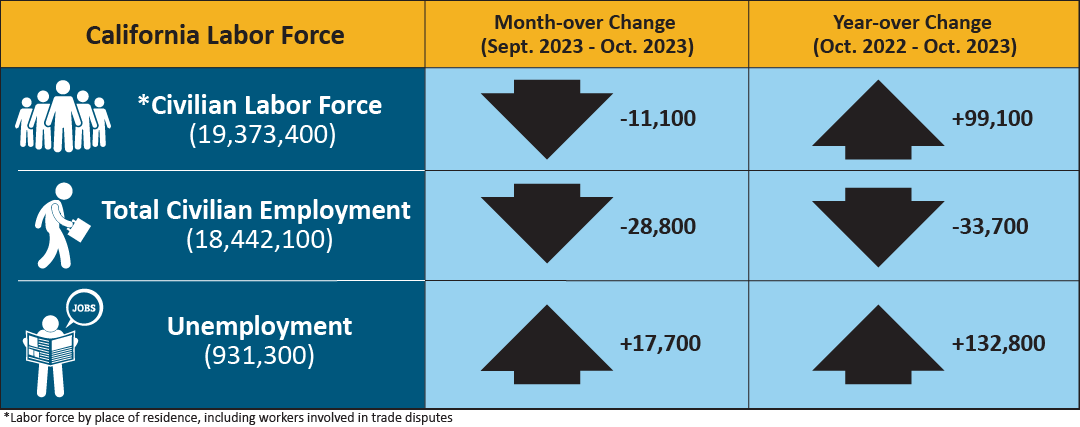
- Employed – The number of Californians employed in October was 18,442,100, a decrease of 28,800 persons from September’s total of 18,470,900 and down 33,700 from the employment total in October
- Unemployed – The number of unemployed Californians was 931,300 in October, an increase of 17,700 over the month and up 132,800 in comparison to October 2022.
| California Labor Force |
Month-over Change (September 2023–October 2023) |
Year-over Change (October 2022–October 2023) |
| * Civilian Labor Force (19,373,400) |
-11,100 |
+99,100 |
| Total Civilian Employment (18,442,100) |
-28,800 |
-33,700 |
| Unemployment (931,300) |
+17,700 |
+132,800 |
* Labor force by place of residence, including workers involved in trade disputes.
Unemployment Insurance Claims (Not Seasonally Adjusted)
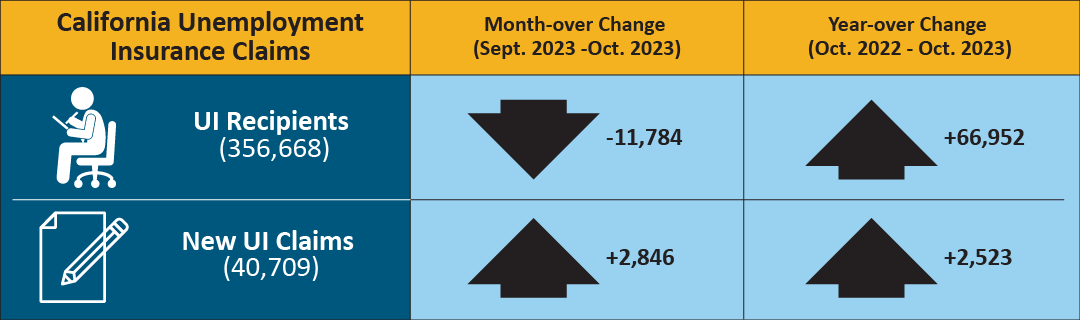
The following data is from a sample week that includes the 19th of each month: In related data that figures into the state’s unemployment rate, there were 356,668 people certifying for Unemployment Insurance benefits during the October 2023 sample week. That compares to 368,452 people in September and 289,716 people in October 2022. Concurrently, 40,709 initial claims were processed in the October 2023 sample week, which was a month-over increase of 2,846 claims from September, and a year-over increase of 2,523 claims from October 2022.
| California Unemployment Insurance Claims |
Month-over Change (September 2023–October 2023) |
Year-over Change (October 2022–October 2023) |
| UI Recipients (356,668) |
-11,784 |
+66,952 |
| New UI Claims (40,709) |
+2,846 |
+2,523 |
MONTHLY LABOR FORCE DATA FOR COUNTIES
October 2023 (Preliminary); 2022 Benchmark
NOT SEASONALLY ADJUSTED
| COUNTY |
LABOR FORCE |
EMPLOYMENT |
UNEMPLOYMENT |
RATE |
| STATE TOTAL |
19,408,700
|
18,480,800
|
927,900
|
4.8%
|
| ALAMEDA |
832,600
|
796,200
|
36,400
|
4.4%
|
| ALPINE |
480
|
450
|
40
|
7.3%
|
| AMADOR |
14,600
|
13,880
|
720
|
4.9%
|
| BUTTE |
92,700
|
88,000
|
4,600
|
5.0%
|
| CALAVERAS |
22,350
|
21,440
|
910
|
4.1%
|
| COLUSA |
10,470
|
9,550
|
920
|
8.8%
|
| CONTRA COSTA |
554,400
|
530,100
|
24,200
|
4.4%
|
| DEL NORTE |
9,470
|
8,940
|
530
|
5.5%
|
| EL DORADO |
94,500
|
90,700
|
3,800
|
4.0%
|
| FRESNO |
458,700
|
426,900
|
31,800
|
6.9%
|
| GLENN |
12,920
|
12,230
|
700
|
5.4%
|
| HUMBOLDT |
61,000
|
58,200
|
2,700
|
4.4%
|
| IMPERIAL |
74,600
|
60,200
|
14,400
|
19.3%
|
| INYO |
8,350
|
8,050
|
300
|
3.6%
|
| KERN |
401,300
|
371,100
|
30,100
|
7.5%
|
| KINGS |
57,600
|
53,300
|
4,300
|
7.4%
|
| LAKE |
27,890
|
26,330
|
1,560
|
5.6%
|
| LASSEN |
9,480
|
9,090
|
390
|
4.1%
|
| LOS ANGELES |
4,977,600
|
4,730,100
|
247,400
|
5.0%
|
| MADERA |
63,400
|
59,100
|
4,300
|
6.8%
|
| MARIN |
132,800
|
128,100
|
4,700
|
3.6%
|
| MARIPOSA |
8,000
|
7,650
|
350
|
4.4%
|
| MENDOCINO |
36,600
|
34,940
|
1,660
|
4.5%
|
| MERCED |
114,800
|
105,800
|
9,000
|
7.8%
|
| MODOC |
3,240
|
3,090
|
150
|
4.7%
|
| MONO |
8,580
|
8,200
|
380
|
4.5%
|
| MONTEREY |
232,700
|
221,600
|
11,100
|
4.8%
|
| NAPA |
71,500
|
69,000
|
2,500
|
3.5%
|
| NEVADA |
47,420
|
45,530
|
1,890
|
4.0%
|
| ORANGE |
1,611,700
|
1,551,300
|
60,300
|
3.7%
|
| PLACER |
196,800
|
189,200
|
7,600
|
3.9%
|
| PLUMAS |
7,290
|
6,890
|
410
|
5.6%
|
| RIVERSIDE |
1,160,900
|
1,100,700
|
60,300
|
5.2%
|
| SACRAMENTO |
738,900
|
705,300
|
33,500
|
4.5%
|
| SAN BENITO |
32,800
|
31,000
|
1,800
|
5.4%
|
| SAN BERNARDINO |
1,015,800
|
965,100
|
50,600
|
5.0%
|
| SAN DIEGO |
1,602,600
|
1,535,800
|
66,800
|
4.2%
|
| SAN FRANCISCO |
576,700
|
557,000
|
19,700
|
3.4%
|
| SAN JOAQUIN |
349,600
|
328,100
|
21,500
|
6.2%
|
| SAN LUIS OBISPO |
139,700
|
134,800
|
4,900
|
3.5%
|
| SAN MATEO |
455,900
|
441,400
|
14,500
|
3.2%
|
| SANTA BARBARA |
229,700
|
221,100
|
8,600
|
3.7%
|
| SANTA CLARA |
1,055,000
|
1,015,400
|
39,600
|
3.8%
|
| SANTA CRUZ |
135,500
|
129,000
|
6,600
|
4.8%
|
| SHASTA |
72,000
|
68,400
|
3,600
|
4.9%
|
| SIERRA |
1,350
|
1,290
|
50
|
3.9%
|
| SISKIYOU |
17,620
|
16,700
|
930
|
5.3%
|
| SOLANO |
202,400
|
192,900
|
9,500
|
4.7%
|
| SONOMA |
252,000
|
242,800
|
9,100
|
3.6%
|
| STANISLAUS |
247,100
|
232,200
|
14,800
|
6.0%
|
| SUTTER |
46,900
|
44,000
|
3,000
|
6.4%
|
| TEHAMA |
25,890
|
24,510
|
1,380
|
5.3%
|
| TRINITY |
4,370
|
4,150
|
220
|
5.1%
|
| TULARE |
209,100
|
189,000
|
20,100
|
9.6%
|
| TUOLUMNE |
20,030
|
19,080
|
950
|
4.8%
|
| VENTURA |
418,700
|
399,700
|
19,000
|
4.5%
|
| YOLO |
110,500
|
105,600
|
4,900
|
4.4%
|
| YUBA |
32,200
|
30,200
|
2,000
|
6.1%
|