NR No. 24-10
Contact: Loree Levy/Aubrey Henry
916-654-9029
mediainquiries@edd.ca.gov
Important Note: The employment data for the month of January 2024 is taken from the survey week including January 12. Data for February is scheduled for release on March 22, 2024. These statistics reflect updates to initial 2023 monthly estimates as part of EDD’s annual benchmark revision process.
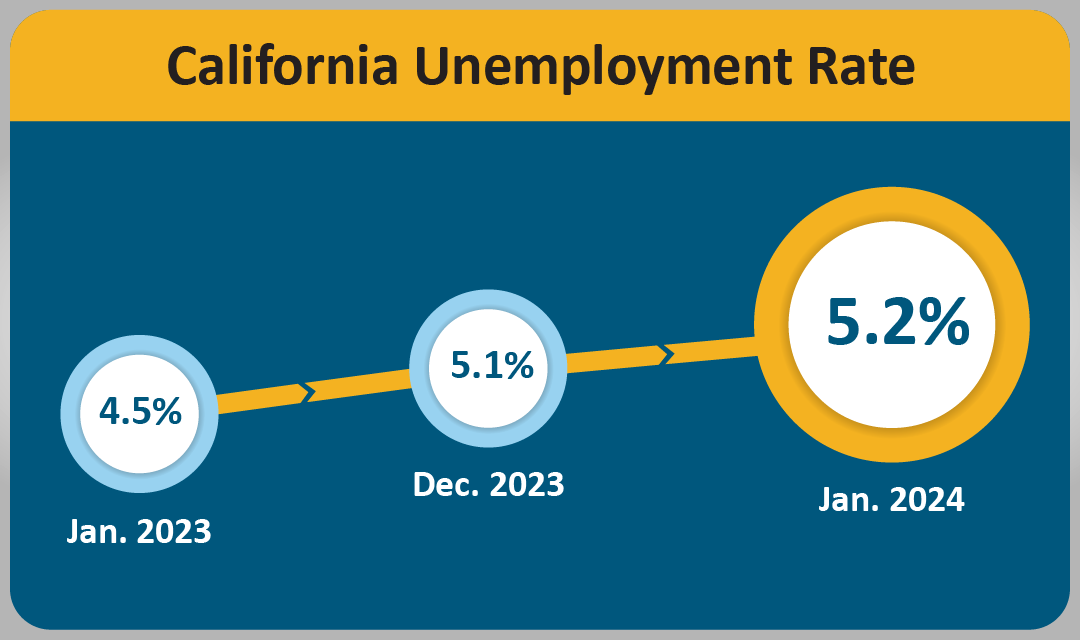
California’s unemployment rate slightly increases
SACRAMENTO – California’s employers added 58,100 nonfarm payroll jobs in January 2024 while the State’s unemployment rate increased to 5.2 percent1 in January 2024 from 5.1% in December, according to data released today by the Employment Development Department (EDD) from two surveys.
California's Labor Market, by the Numbers...
- California’s job market expansion turned 45 months old in January with the month’s job growth accounting for 16.5 percent of the nation’s 353,000 overall job gain.
- Ten of California's 11 industry sectors gained jobs in January with Private Education & Health Services (+18,100) topping the gains thanks to strength in Nursing Care Facilities and Individual and Family Services.
- Professional & Business Services (+15,700) also showed strong month-over growth thanks in part to gains in Specialized Design Services, Investigation and Security Services, and Services to Buildings and Dwellings.
- Manufacturing (-800) was the only industry sector to lose jobs within the State for January 2024. This was due, in part, to above-average losses in the Semiconductor and Other Electronic Component Manufacturing industry group.
- As part of annual revisions to prior estimates that factor in more comprehensive employment data that becomes available, job growth was slower than estimated in the year following August 2022 with gains picking up over the last several months. Revisions reflect some lingering impacts of the unprecedented pandemic that are still working their way out of estimation models.
1. The unemployment rate comes from a separate federal survey of 5,100 California households.
2. The nonfarm payroll job numbers come from a federal survey of 80,000 California businesses.
Data Trends about Jobs in the Economy
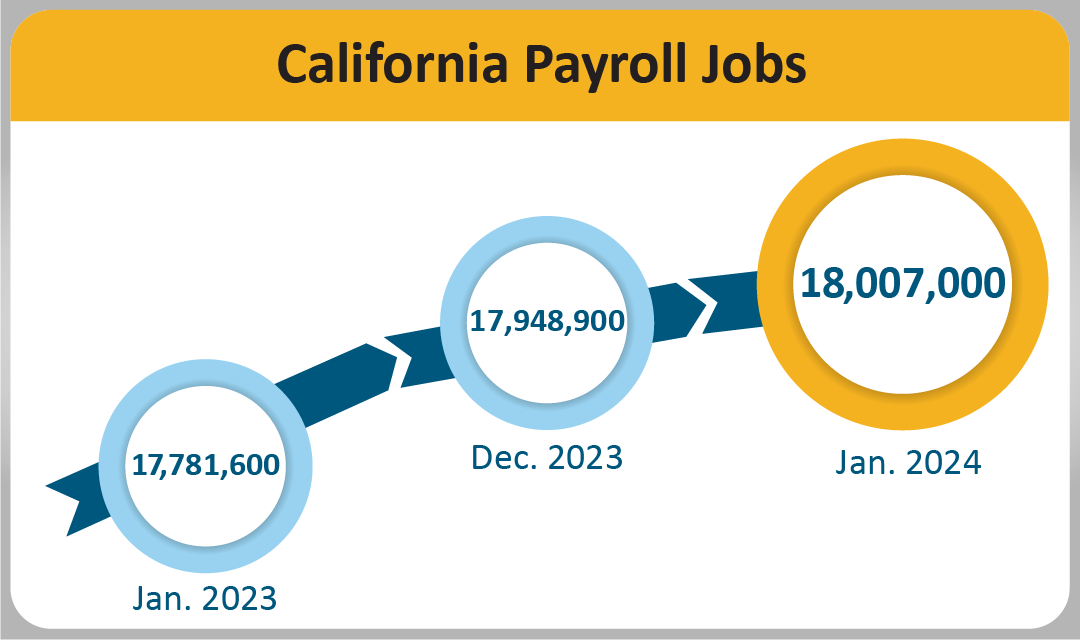
Total Nonfarm Payroll Jobs (Comes from a monthly survey of approximately 80,000 California businesses that estimates jobs in the economy – seasonally adjusted)
- Month-over – Total nonfarm jobs in California’s 11 major industries totaled, 18,007,000 in January – a net gain of 58,100 from December. This followed a downward revised (-231,800) month-over gain of 41,500 jobs in December.
- Year-over – Total nonfarm jobs increased by 225,400 (a 1.3 percent increase) from January 2023 to January 2024 compared to the U.S. annual gain of 2,927,000 jobs (a 1.9 percent increase).
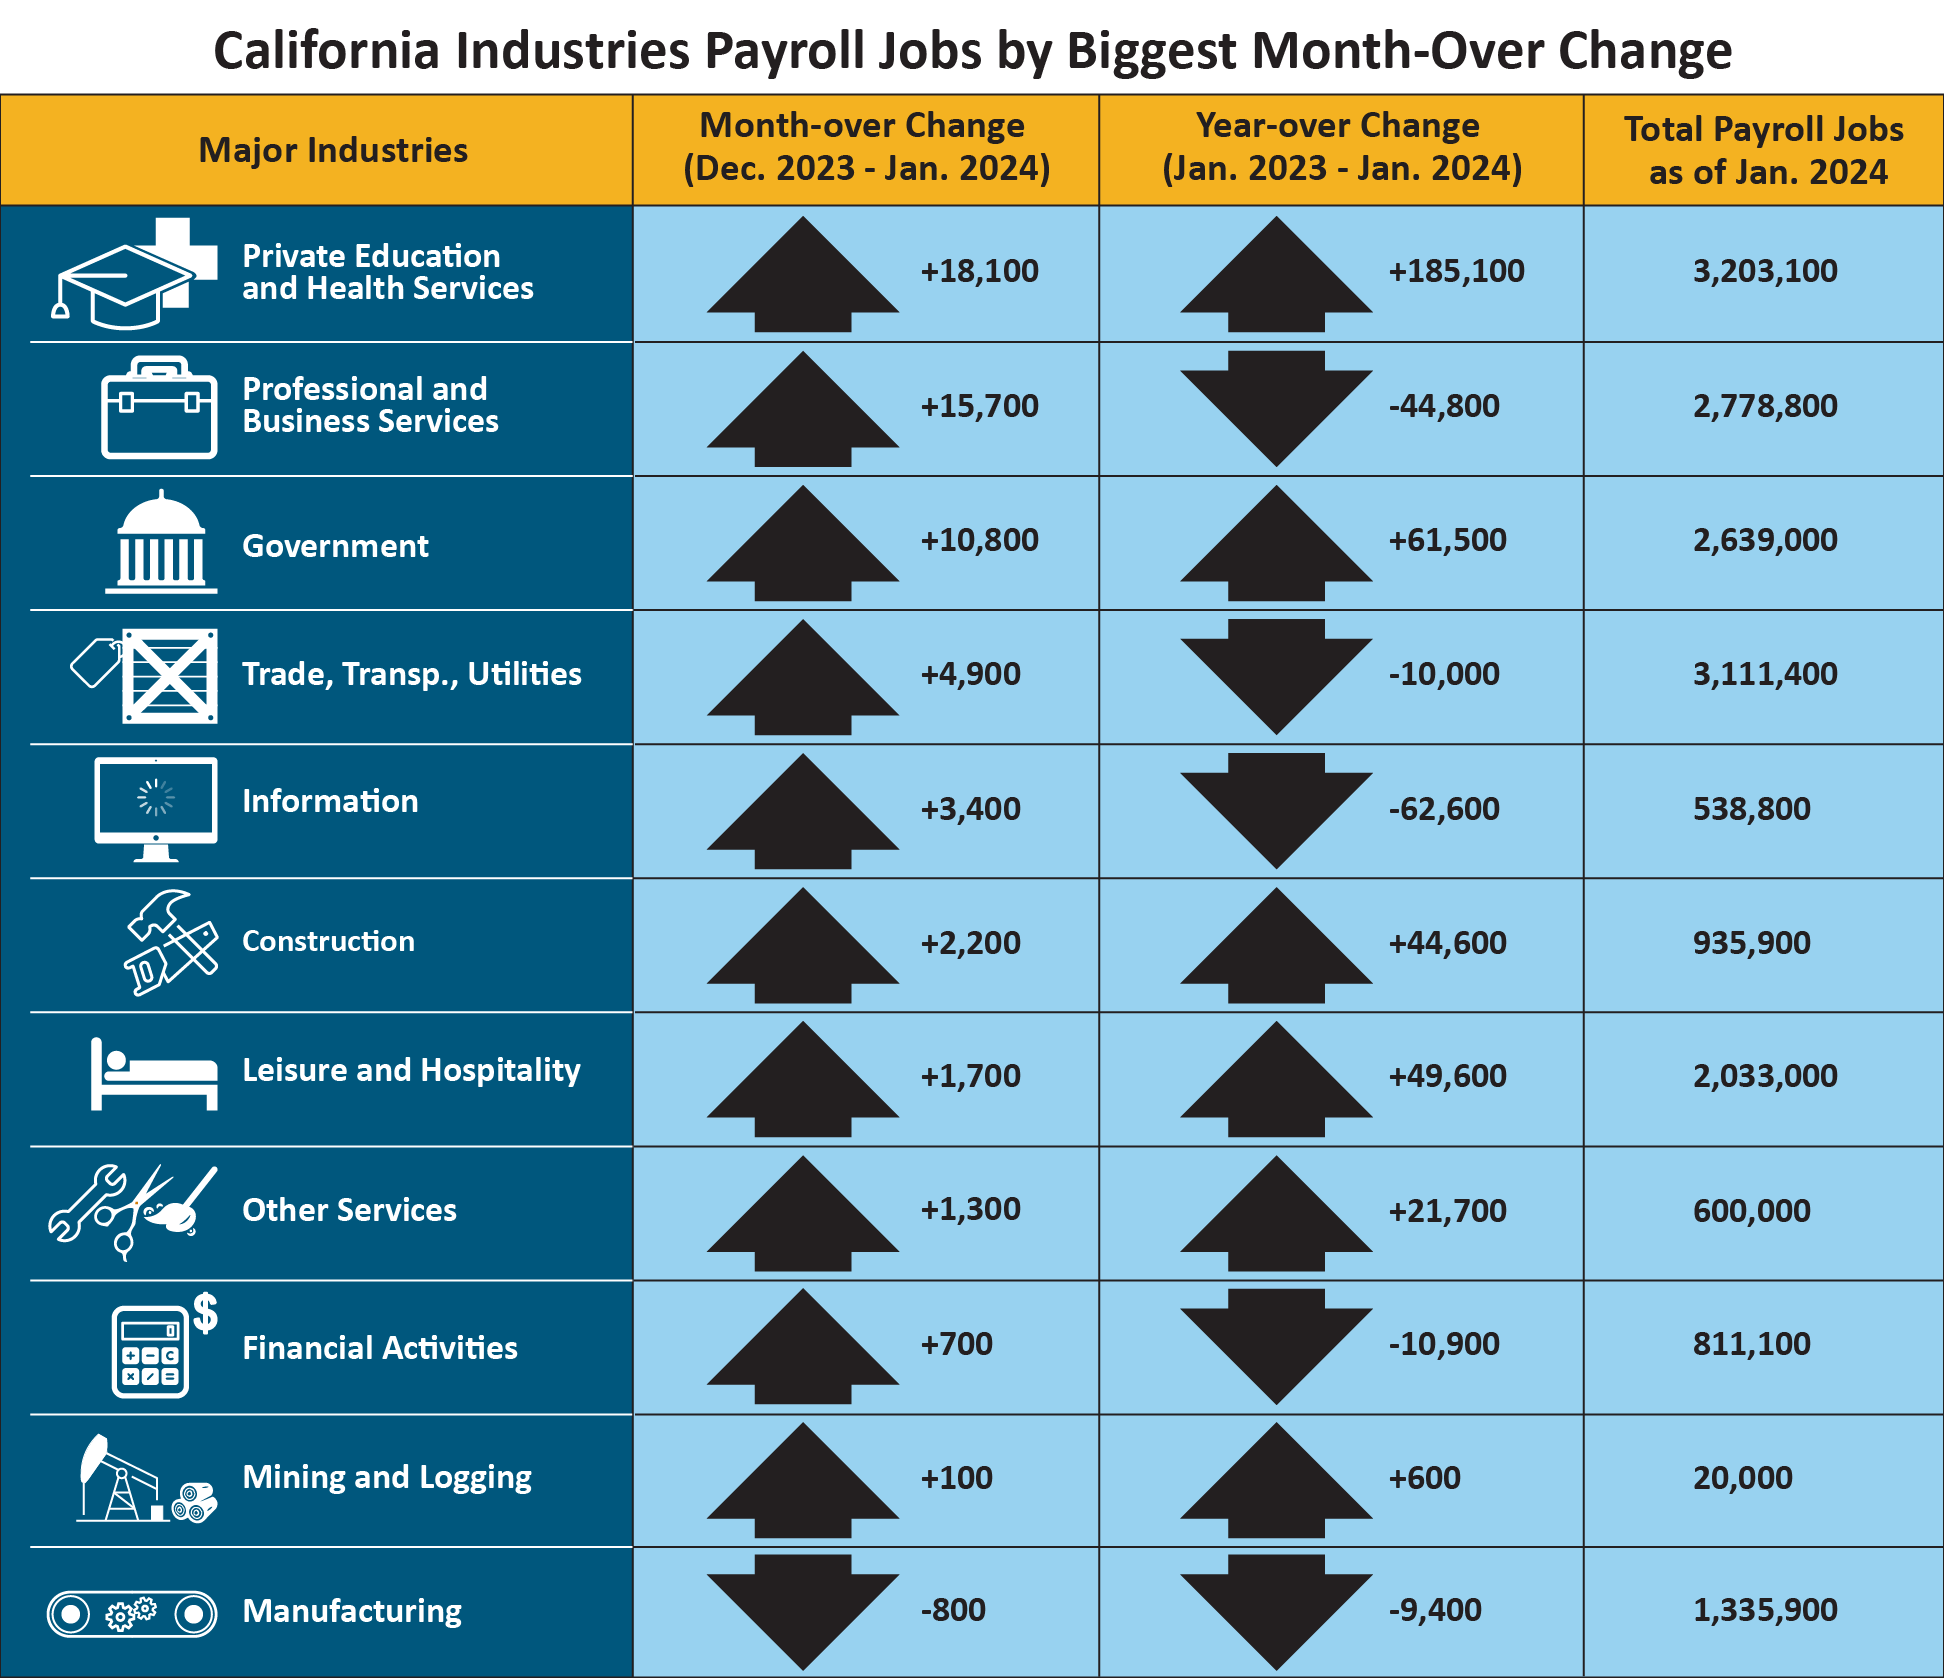
| Major Industries |
Month-over Change (December 2023–January 2024) |
Year-over Change (January 2023–January 2024) |
Total Payroll Jobs as of January 2024 |
|
Private Education and Health Services
|
+18,100 |
+185,100 |
3,203,100 |
|
Professional and Business Services
|
+15,700 |
-44,800 |
2,778,800 |
| Government |
+10,800 |
+61,500 |
2,639,000 |
|
Trade, Transp., Utilities
|
+4,900 |
-10,000 |
3,111,400 |
|
Information
|
+3,400 |
-62,600 |
538,800 |
| Construction |
+2,200 |
+44,600 |
935,900 |
|
Leisure and Hospitality
|
+1,700 |
+49,600 |
2,033,000 |
|
Other Services
|
+1,300 |
+21,700 |
600,000 |
|
Financial Activities
|
+700 |
-10,900 |
811,100 |
|
Mining and Logging
|
+100 |
+600 |
20,000 |
|
Manufacturing
|
-800 |
-9,400 |
1,335,900 |
Total Farm jobs – The number of jobs in the agriculture industry decreased from December by 21,300 to a total of 427,100 jobs in January. The agriculture industry had 36,300 more farm jobs in January 2024 than it did in January a year ago.
Data Trends about Workers in the Economy
Employment and Unemployment in California (Based on a monthly federal survey of 5,100 California households which focuses on workers in the economy)
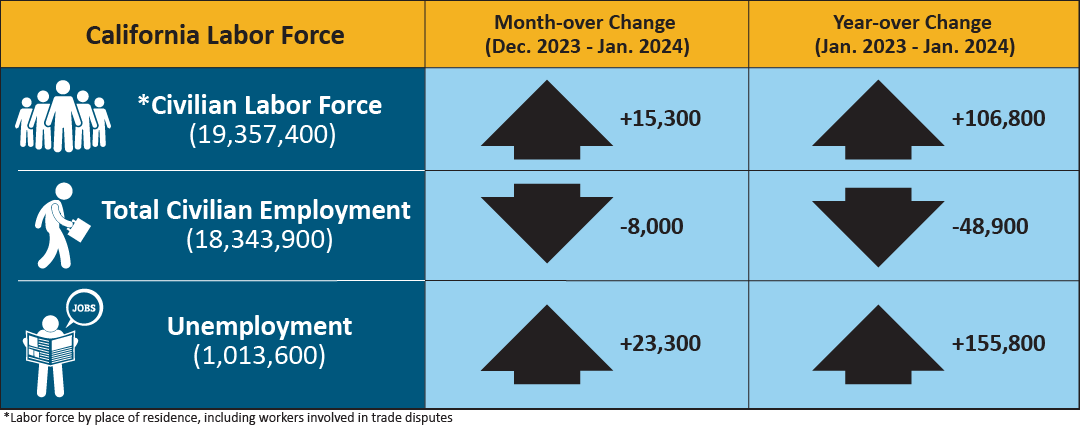
- Employed – The number of Californians employed in January was 18,343,900, a decrease of 8,000 persons from December’s total of 18,351,900 and down 48,900 from the employment total in January
- Unemployed – The number of unemployed Californians was 1,013,600 in January, an increase of 23,300 over the month and up 155,800 in comparison to January 2023.
| California Labor Force |
Month-over Change (December 2023–January 2024) |
Year-over Change (January 2023-January 2024) |
| * Civilian Labor Force (19,357,400) |
+15,300 |
+106,800 |
| Total Civilian Employment (18,343,900) |
-8,000 |
-48,900 |
| Unemployment (1,013,600) |
+23,300 |
+155,800 |
* Labor force by place of residence, including workers involved in trade disputes.
Unemployment Insurance Claims (not seasonally adjusted)
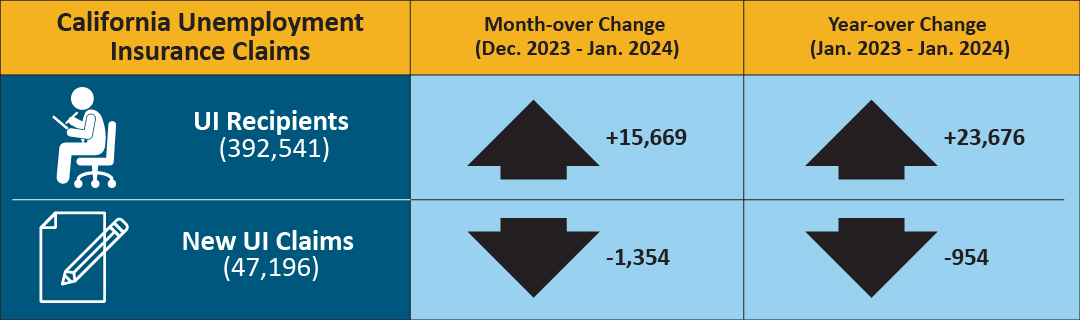
The following data is from a sample week that includes the 19th of each month: In related data that figures into the State’s unemployment rate, there were 392,541 people certifying for Unemployment Insurance (UI) benefits during the January 2024 sample week. That compares to 376,872 people in December and 368,865 people in January 2023. Concurrently, 47,196 initial claims were processed in the January 2024 sample week, which was a month-over decrease of 1,354 claims from December, and a year-over decrease of 954 claims from January 2023.
| California Unemployment Insurance Claims |
Month-over Change (December 2023–January 2024) |
Year-over Change (January 2023-January 2024) |
| UI Recipients (392,541) |
+15,669 |
+26,676 |
| New UI Claims (47,196) |
-1,354 |
-954 |
MONTHLY LABOR FORCE DATA FOR COUNTIES
January 2024 (Preliminary); 2023 Benchmark
NOT SEASONALLY ADJUSTED
| COUNTY |
LABOR FORCE |
EMPLOYMENT |
UNEMPLOYMENT |
RATE |
| STATE TOTAL |
19,344,200 |
18,239,000 |
1,105,200 |
5.7% |
| ALAMEDA |
825,700 |
784,500 |
41,200 |
5.0% |
| ALPINE |
650 |
610 |
40 |
6.6% |
| AMADOR |
14,380 |
13,480 |
890 |
6.2% |
| BUTTE |
92,900 |
86,700 |
6,100 |
6.6% |
| CALAVERAS |
21,960 |
20,780 |
1,180 |
5.4% |
| COLUSA |
10,570 |
8,530 |
2,040 |
19.3% |
| CONTRA COSTA |
550,700 |
523,000 |
27,700 |
5.0% |
| DEL NORTE |
9,250 |
8,580 |
660 |
7.2% |
| EL DORADO |
94,700 |
90,000 |
4,700 |
5.0% |
| FRESNO |
464,500 |
423,600 |
41,000 |
8.8% |
| GLENN |
12,520 |
11,510 |
1,010 |
8.0% |
| HUMBOLDT |
60,000 |
56,400 |
3,500 |
5.9% |
| IMPERIAL |
75,000 |
61,600 |
13,300 |
17.8% |
| INYO |
8,240 |
7,850 |
390 |
4.8% |
| KERN |
398,900 |
361,000 |
37,900 |
9.5% |
| KINGS |
59,800 |
53,900 |
5,900 |
9.9% |
| LAKE |
29,310 |
27,150 |
2,160 |
7.4% |
| LASSEN |
8,510 |
7,900 |
610 |
7.1% |
| LOS ANGELES |
5,018,800 |
4,722,100 |
296,600 |
5.9% |
| MADERA |
67,100 |
61,300 |
5,900 |
8.7% |
| MARIN |
132,300 |
126,900 |
5,400 |
4.1% |
| MARIPOSA |
7,400 |
6,890 |
520 |
7.0% |
| MENDOCINO |
37,270 |
34,980 |
2,290 |
6.1% |
| MERCED |
121,000 |
107,800 |
13,200 |
10.9% |
| MODOC |
3,190 |
2,860 |
320 |
10.2% |
| MONO |
9,730 |
9,320 |
420 |
4.3% |
| MONTEREY |
210,300 |
188,200 |
22,100 |
10.5% |
| NAPA |
71,800 |
68,400 |
3,300 |
4.6% |
| NEVADA |
49,780 |
47,410 |
2,370 |
4.8% |
| ORANGE |
1,590,900 |
1,523,900 |
66,900 |
4.2% |
| PLACER |
196,400 |
187,600 |
8,900 |
4.5% |
| PLUMAS |
7,060 |
6,280 |
780 |
11.0% |
| RIVERSIDE |
1,164,200 |
1,099,800 |
64,300 |
5.5% |
| SACRAMENTO |
737,800 |
698,800 |
39,000 |
5.3% |
| SAN BENITO |
32,200 |
29,800 |
2,400 |
7.5% |
| SAN BERNARDINO |
1,018,900 |
964,000 |
54,900 |
5.4% |
| SAN DIEGO |
1,597,700 |
1,521,800 |
75,800 |
4.7% |
| SAN FRANCISCO |
561,000 |
538,700 |
22,400 |
4.0% |
| SAN JOAQUIN |
349,100 |
323,000 |
26,100 |
7.5% |
| SAN LUIS OBISPO |
135,000 |
129,200 |
5,700 |
4.2% |
| SAN MATEO |
443,400 |
427,000 |
16,400 |
3.7% |
| SANTA BARBARA |
214,100 |
202,100 |
12,000 |
5.6% |
| SANTA CLARA |
1,034,000 |
989,200 |
44,800 |
4.3% |
| SANTA CRUZ |
131,600 |
121,800 |
9,800 |
7.4% |
| SHASTA |
75,000 |
70,200 |
4,800 |
6.4% |
| SIERRA |
1,300 |
1,220 |
80 |
6.2% |
| SISKIYOU |
16,870 |
15,400 |
1,470 |
8.7% |
| SOLANO |
205,000 |
193,400 |
11,600 |
5.7% |
| SONOMA |
249,400 |
238,200 |
11,200 |
4.5% |
| STANISLAUS |
248,300 |
229,400 |
18,900 |
7.6% |
| SUTTER |
46,900 |
42,300 |
4,600 |
9.8% |
| TEHAMA |
26,240 |
24,400 |
1,830 |
7.0% |
| TRINITY |
4,510 |
4,170 |
340 |
7.5% |
| TULARE |
214,400 |
189,100 |
25,400 |
11.8% |
| TUOLUMNE |
19,970 |
18,740 |
1,230 |
6.2% |
| VENTURA |
413,600 |
392,200 |
21,400 |
5.2% |
| YOLO |
110,700 |
104,000 |
6,700 |
6.1% |
| YUBA |
32,500 |
29,800 |
2,700 |
8.3% |