NR No. 23-09
Contact: Loree Levy/Aubrey Henry
916-654-9029
mediainquiries@edd.ca.gov
IMPORTANT NOTE: The employment data for the month of January 2023 is taken from the survey week including Jan. 12th. Data for the month of February is scheduled for release on March 24, 2023. These statistics reflect updates to 2022 monthly data performed during EDD’s annual benchmark process.
Employers added 96,700 nonfarm payroll jobs
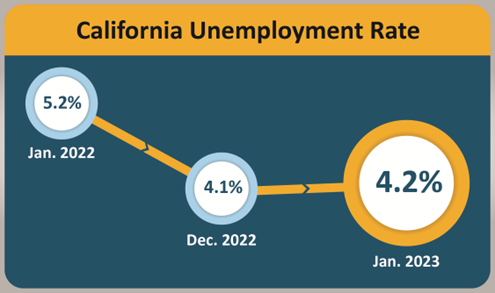
California’s unemployment rate crept up slightly for the month of January 2023 to 4.2 percent1 despite the state’s employers adding 96,700 nonfarm payroll jobs2 to the economy, according to data released today by the California Employment Development Department (EDD) from two surveys.
California’s Labor Market, by the Numbers...
- Updated data shows California fully recovered its nearly 2.8 million pandemic related job losses earlier in June 2022 rather than October 2022 as originally estimated, and the peak unemployment rate of 16.1% hit earlier in April 2020 rather than May.
- Of the 517,000 jobs gained nationally in January 2023, California accounted for 96,700, or nearly 19 percent, of the nation’s overall non-farm job growth.
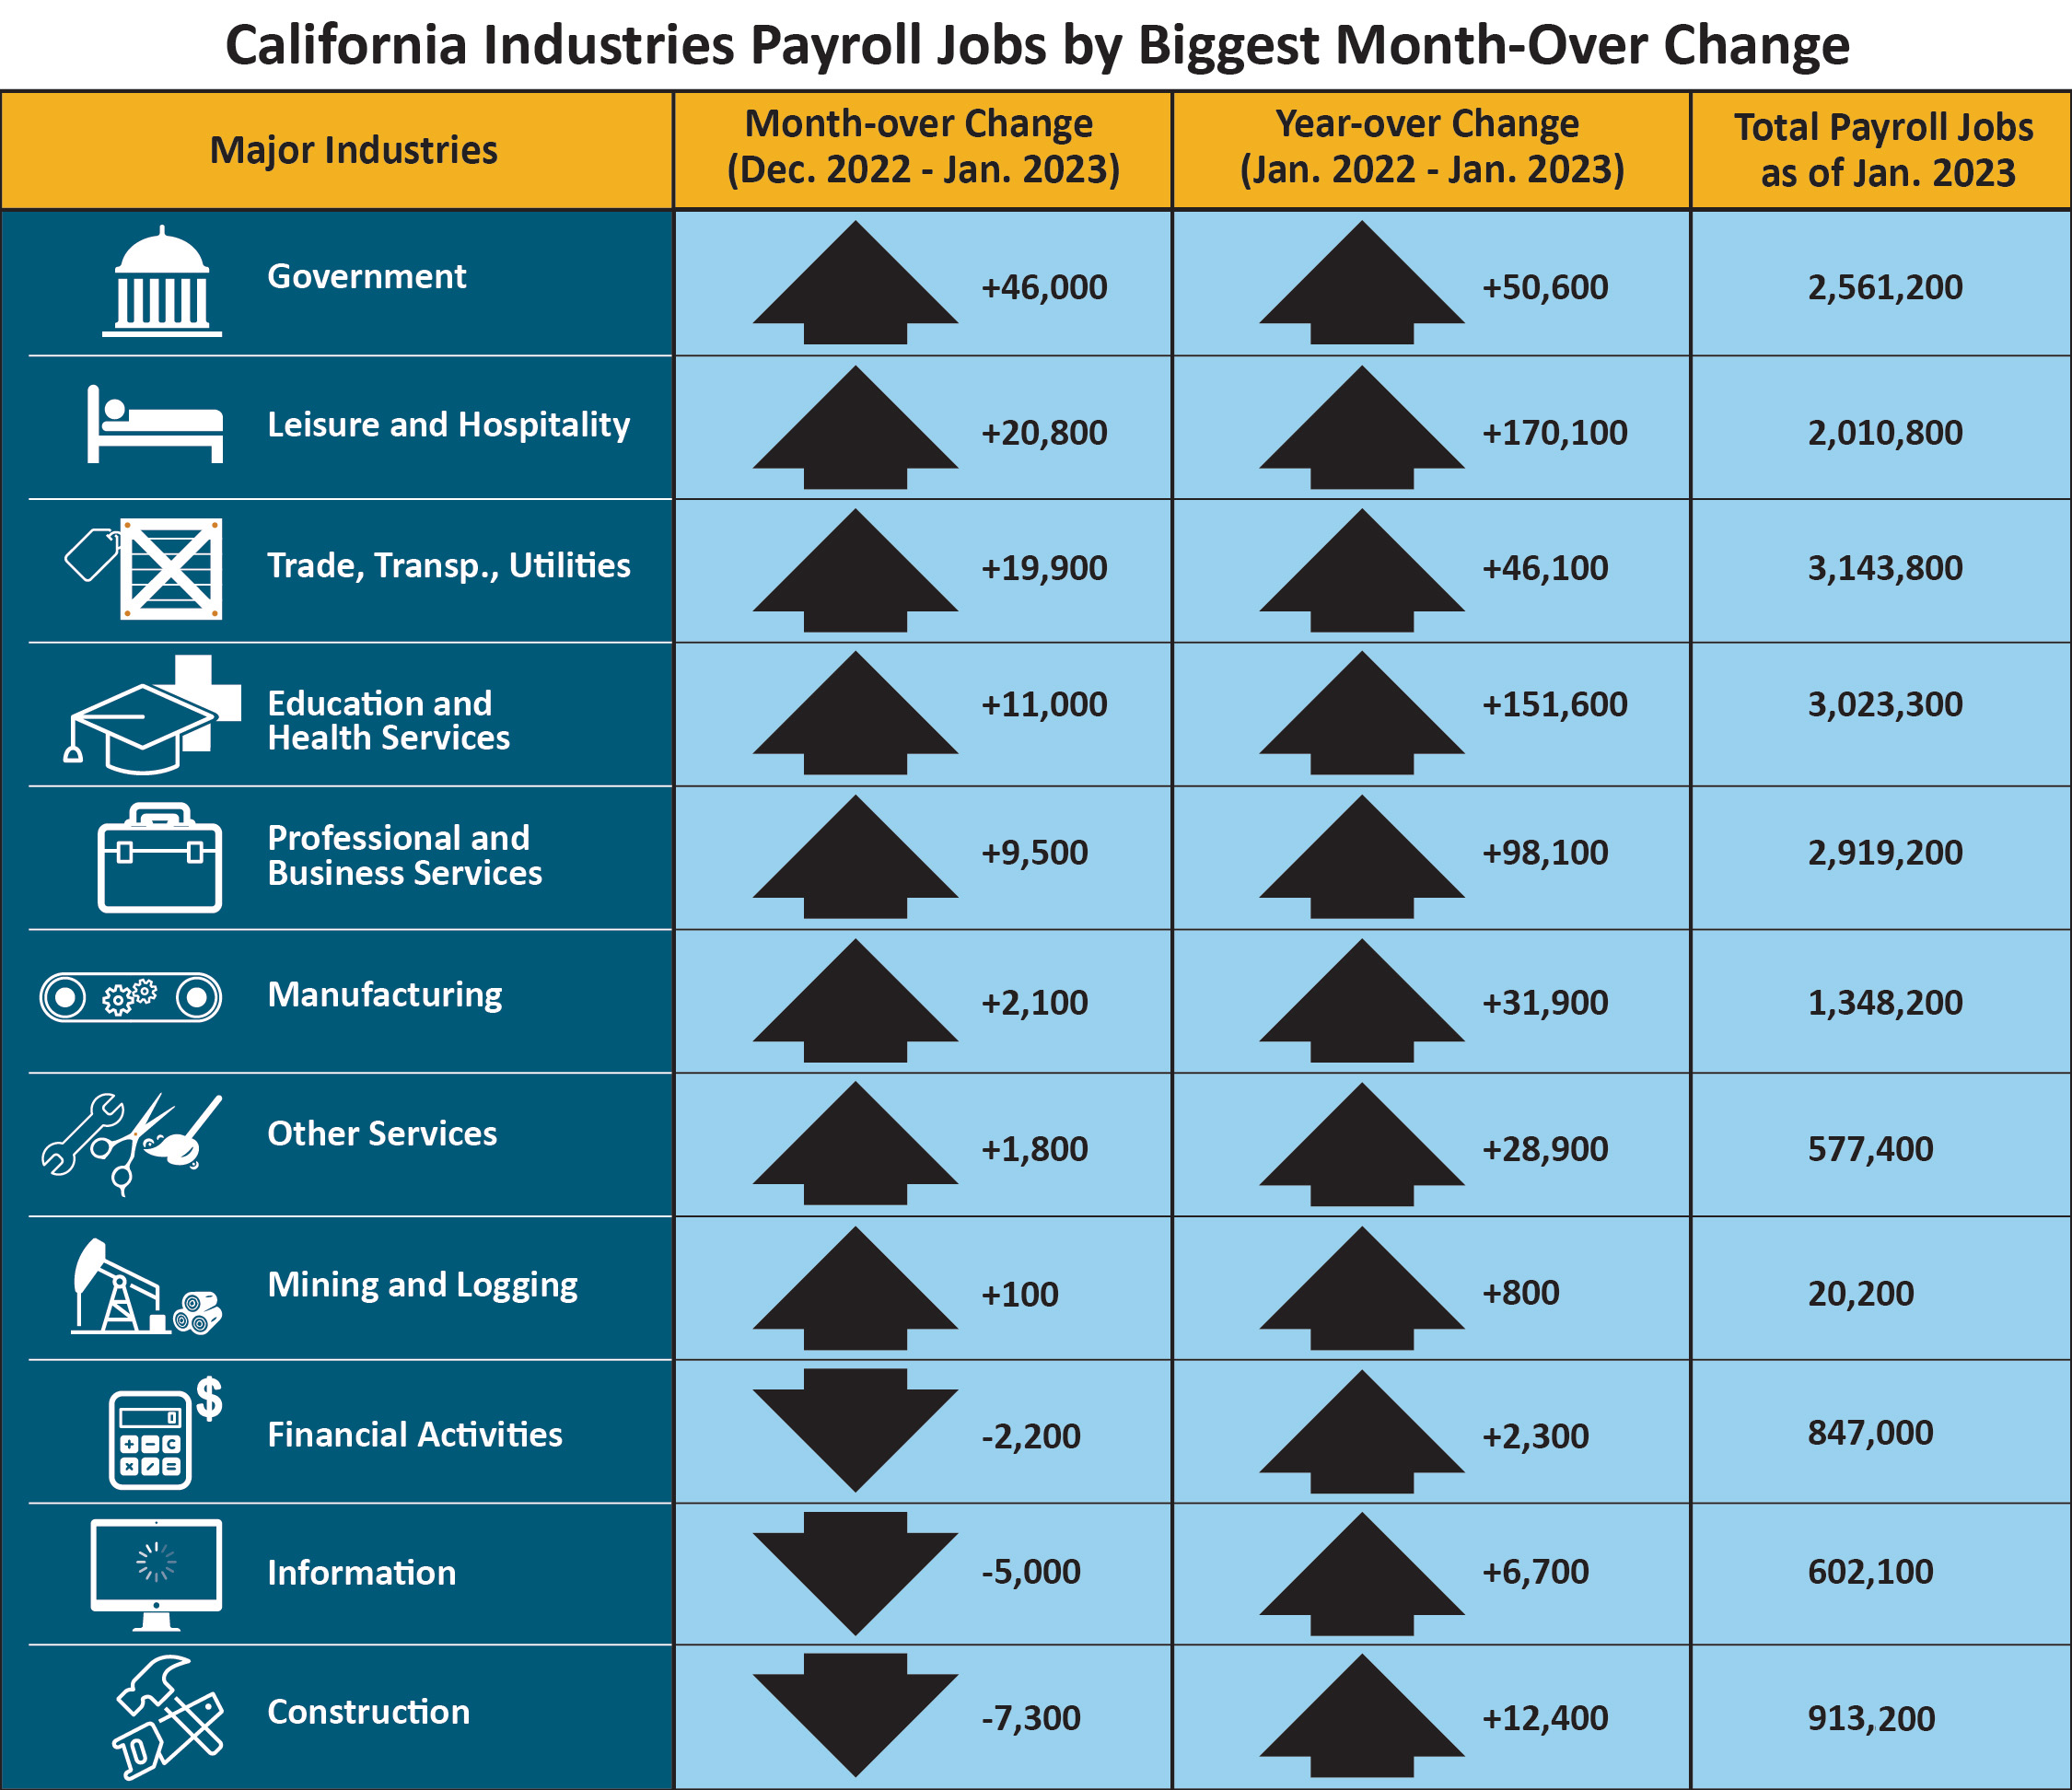
- Eight of California’s 11 industry sectors gained jobs in January with Government (+46,000) leading the way with strong gains in State Government Educational Services, boosted by the end of the University of California academic workers strike in December.
- Leisure & Hospitality (+20,800) also enjoyed an extremely strong month-over gain thanks, in part, to very good gains in not just Gambling Industries, but also in Performing Arts, Spectator Sports, and Talent and Sports Agents.
- Construction (-7,300) suffered the California’s largest month-over job loss for January 2023 due, in part, to the severe winter storms and extreme weather across the state, as well as from reductions in the Specialty Trade Contractors subsector.
1. The unemployment rate comes from a separate federal survey of 5,100 California households.
2. The nonfarm payroll job numbers come from a federal survey of 80,000 California businesses.
Data Trends about Jobs in the Economy
Total Nonfarm Payroll Jobs
Total Nonfarm Payroll Jobs (Comes from a monthly survey of approximately 80,000 California businesses that estimates jobs in the economy – seasonally adjusted)
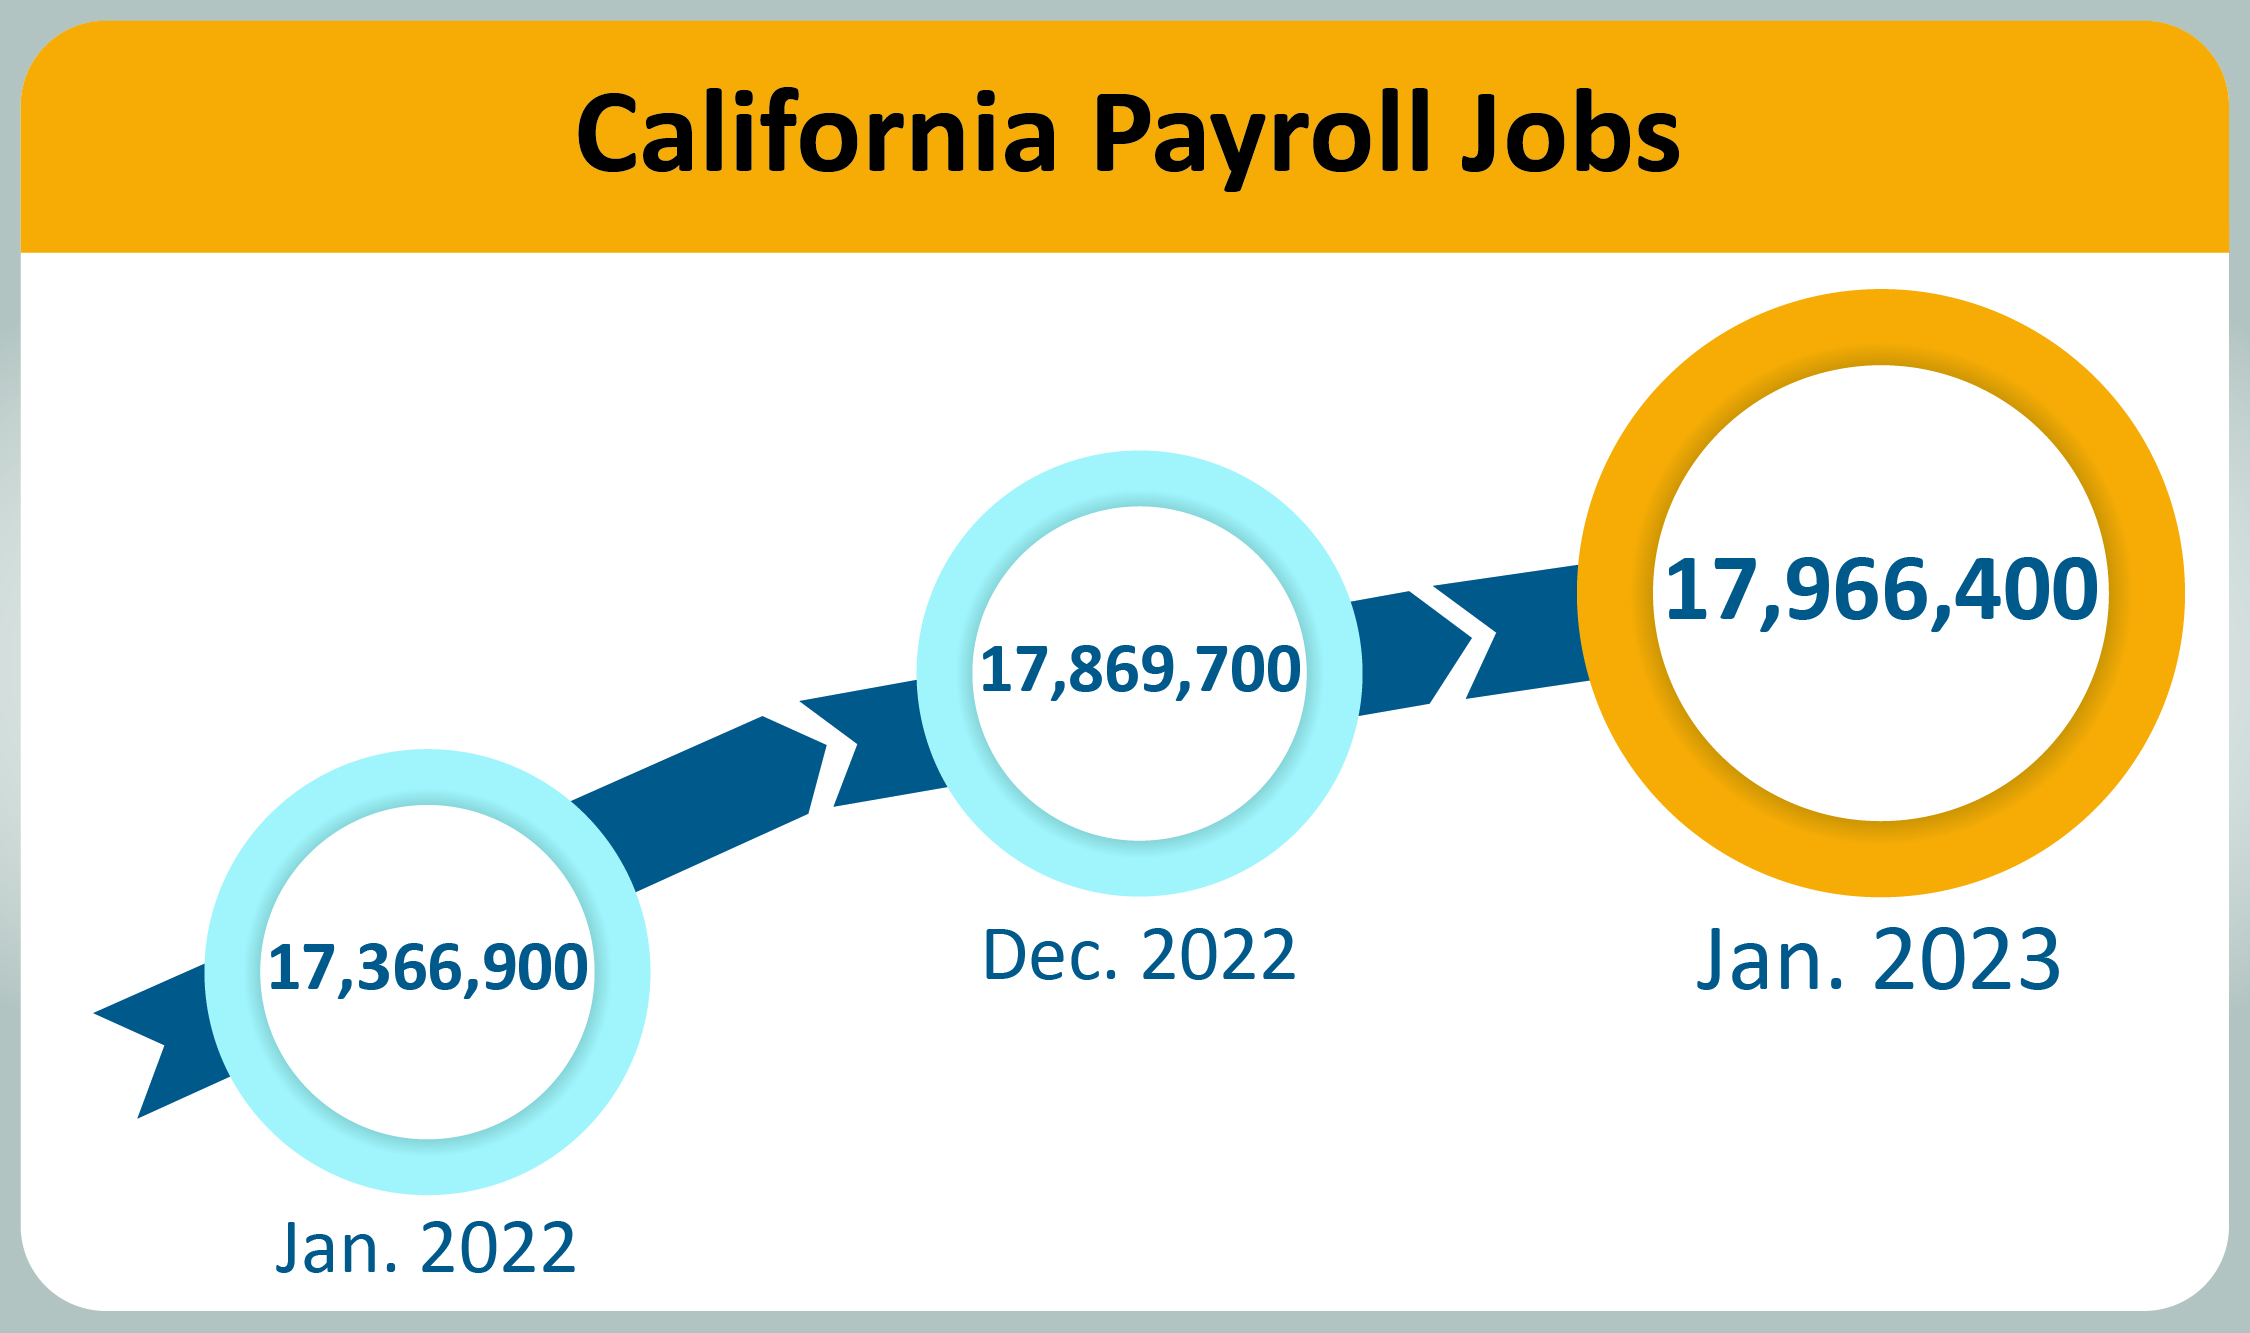
- Month-over – Total nonfarm jobs in California’s 11 major industries totaled 17,966,400 in January – a net gain of 96,700 from December. This followed a post-benchmarking upward revised (+107,800) month-over gain of 124,000 jobs in December.
- Year-over – Total nonfarm jobs increased by 599,500 (a 3.5 percent increase) from January 2022 to January 2023 compared to the U.S. annual gain 4,967,000 jobs (a 3.3 percent increase).
| Major Industries |
Month-over Change (December 2022–January 2023) |
Year-over Change (January 2022–January 2023) |
Total Payroll Jobs as of January 2023 |
|
Government
|
+46,000 |
+50,600 |
2,561,200 |
|
Leisure and Hospitality
|
+20,800 |
+170,100 |
2,010,800 |
| Trade, Transp., Utilities |
+19,900 |
+46,100 |
3,143,800 |
|
Education and Health Services
|
+11,000 |
+151,600 |
3,023,300 |
|
Professional and Business Services
|
+9,500 |
+98,100 |
2,919,200 |
|
Manufacturing
|
+2,100 |
+31,900 |
1,348,200 |
|
Other Services
|
+1,800 |
+28,900 |
577,400 |
|
Mining and Logging
|
+100 |
+800 |
20,200 |
| Financial Activities |
-2,200 |
+2,300 |
847,000 |
|
Information
|
-5,000 |
+6,700 |
602,100 |
|
Construction
|
-7,300 |
+12,400 |
913,200 |
Total Farm jobs – The number of jobs in the agriculture industry decreased from December by 2,400 to a total of 434,400 jobs in January. The agricultural industry had 21,000 more farm jobs in January 2023 than it did in January a year ago.
Data Trends about Workers in the Economy
Employment and Unemployment in California (Based on a monthly federal survey of 5,100 California households which focuses on workers in the economy)
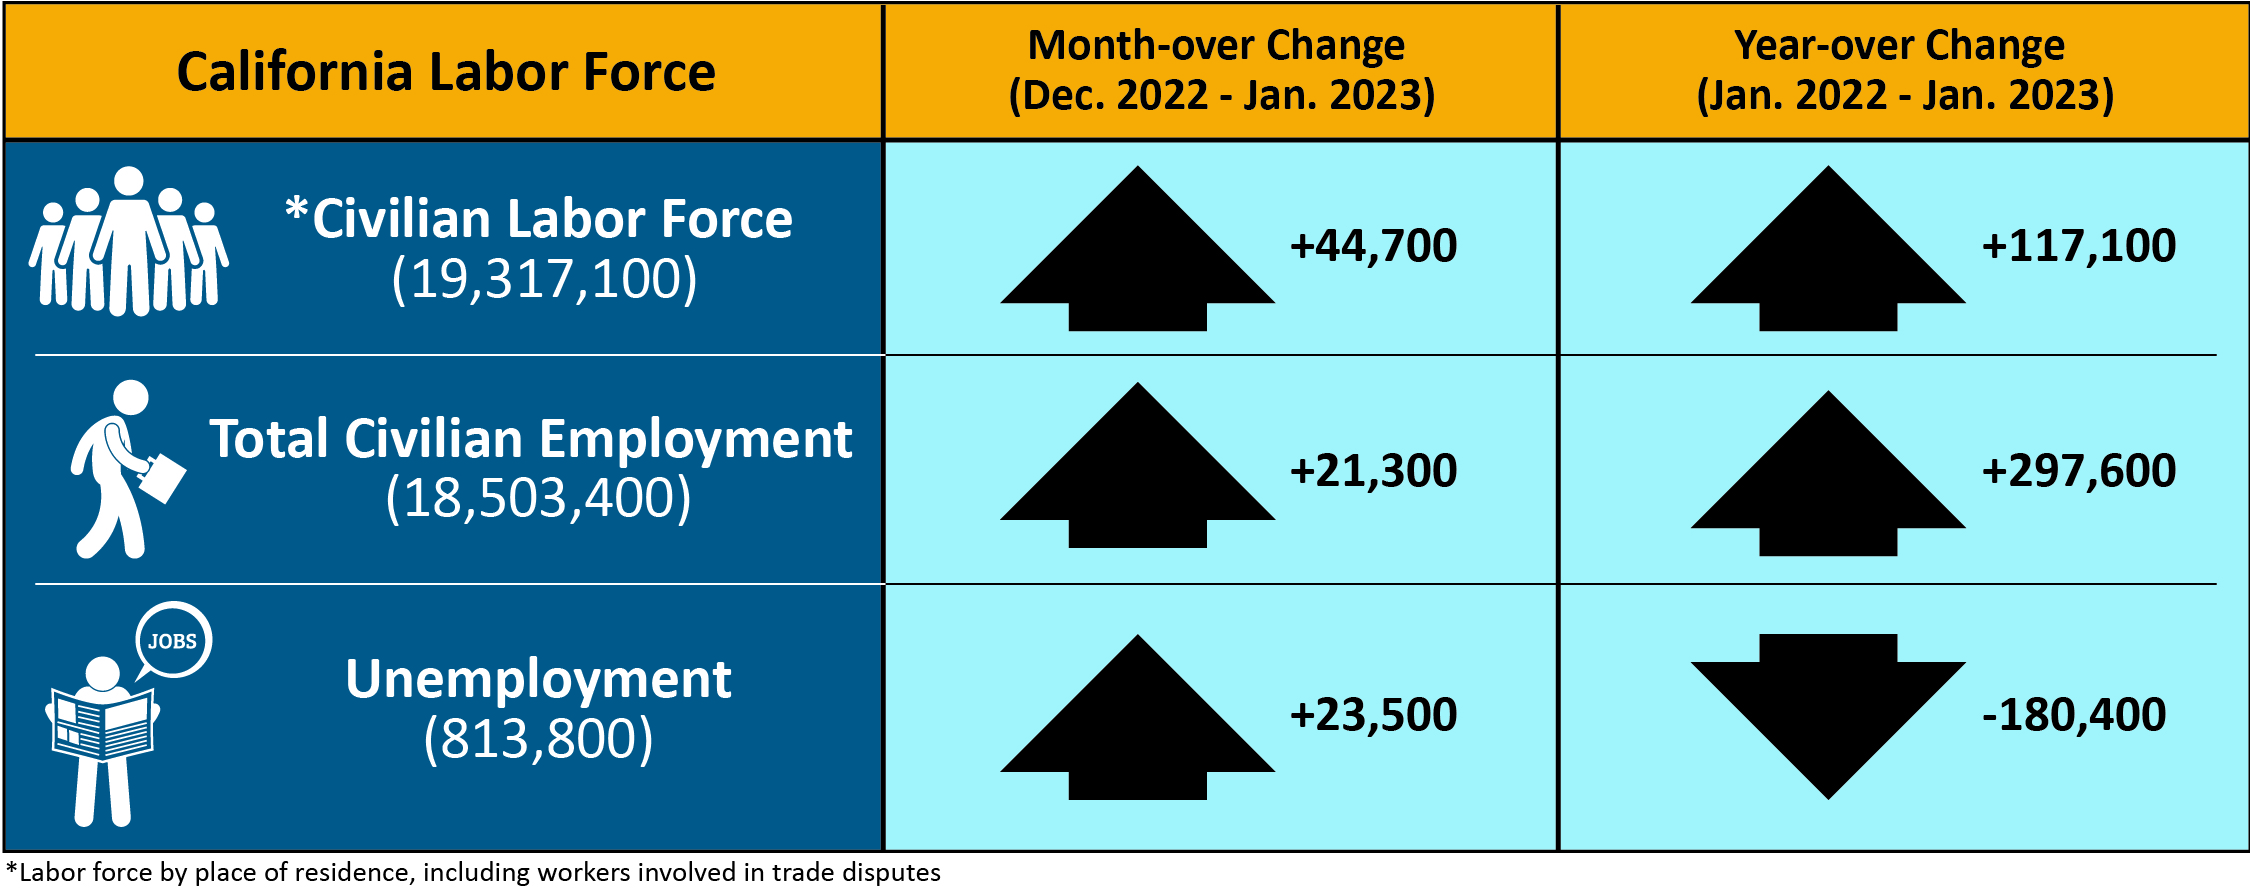
- Employed – The number of Californians employed in January was 18,503,400, an increase of 21,300 persons from December’s total of 18,482,100 and up 297,600 from the employment total in January 2022.
- Unemployed – The number of unemployed Californians was 813,800 in January, an increase of 23,500 over the month, but down 180,400 in comparison to January 2022.
| California Labor Force |
Month-over Change (December 2022–January 2023) |
Year-over Change (January 2022–January 2023) |
| * Civilian Labor Force (19,317,100) |
+44,700 |
+117,100 |
| Total Civilian Employment (18,503,400) |
+21,300 |
+297,600 |
| Unemployment (813,800) |
+23,500 |
-180,400 |
* Labor force by place of residence, including workers involved in trade disputes.
Unemployment Insurance Claims (Not Seasonally Adjusted)
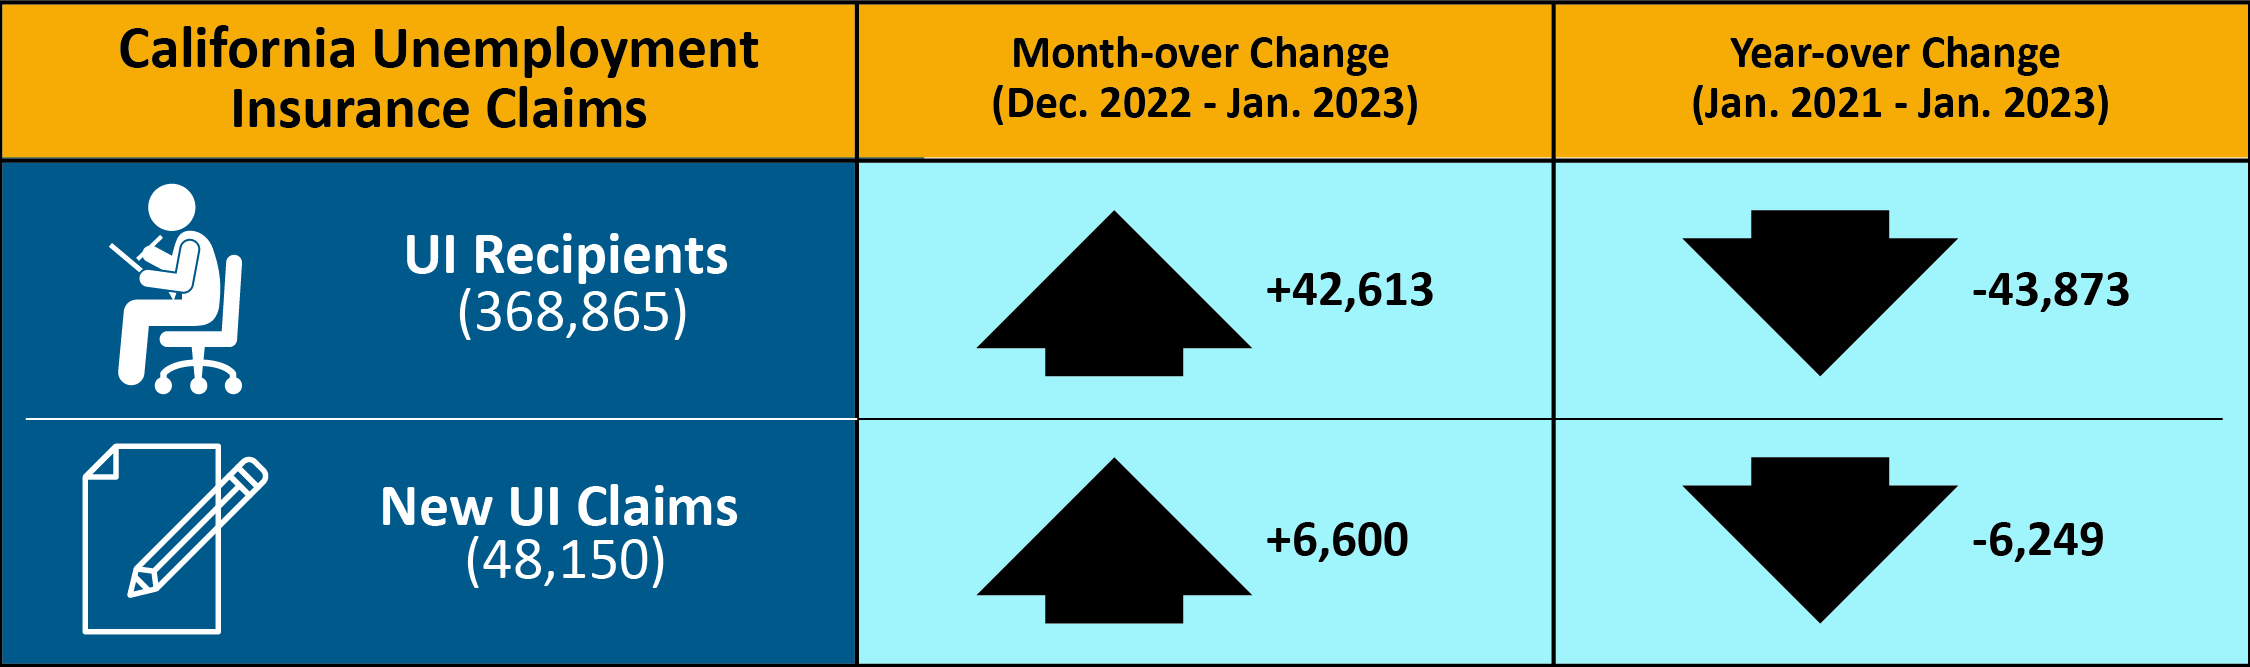
The following data is from a sample week that includes the 19th of each month: In related data that figures into the state’s unemployment rate, there were 368,865 people certifying for Unemployment Insurance benefits during the January 2023 sample week. That compares to 326,252 people in December and 412,738 people in January 2022. Concurrently, 48,150 initial claims were processed in the January 2023 sample week, which was a month-over increase of 6,600 claims from December, but a year-over decrease of 6,249 claims from January 2022.
| California Unemployment Insurance Claims |
Month-over Change (December 2022–January 2023) |
Year-over Change (January 2022–January 2023) |
| UI Recipients (368,865) |
+42,613 |
-43,873 |
| New UI Claims (48,150) |
+6,600 |
-6,249 |
MONTHLY LABOR FORCE DATA FOR COUNTIES
January 2023 (Preliminary); 2022 Benchmark
NOT SEASONALLY ADJUSTED
| COUNTY |
LABOR FORCE |
EMPLOYMENT |
UNEMPLOYMENT |
RATE |
| STATE TOTAL |
19,278,100 |
18,383,800 |
894,400 |
4.6% |
| ALAMEDA |
824,400 |
794,300 |
30,100 |
3.6% |
| ALPINE |
630 |
600 |
30 |
4.9% |
| AMADOR |
14,220 |
13,420 |
800 |
5.6% |
| BUTTE |
92,100 |
86,900 |
5,200 |
5.6% |
| CALAVERAS |
22,150 |
21,130 |
1,010 |
4.6% |
| COLUSA |
10,100 |
8,330 |
1,770 |
17.5% |
| CONTRA COSTA |
550,600 |
529,200 |
21,400 |
3.9% |
| DEL NORTE |
9,190 |
8,610 |
580 |
6.3% |
| EL DORADO |
93,400 |
89,800 |
3,700 |
3.9% |
| FRESNO |
458,200 |
423,600 |
34,600 |
7.5% |
| GLENN |
12,870 |
11,950 |
920 |
7.1% |
| HUMBOLDT |
59,380 |
56,510 |
2,870 |
4.8% |
| IMPERIAL |
72,100 |
60,400 |
11,700 |
16.2% |
| INYO |
8,230 |
7,880 |
350 |
4.3% |
| KERN |
394,400 |
362,500 |
31,900 |
8.1% |
| KINGS |
57,300 |
52,300 |
5,000 |
8.7% |
| LAKE |
28,560 |
26,630 |
1,920 |
6.7% |
| LASSEN |
8,950 |
8,410 |
540 |
6.0% |
| LOS ANGELES |
4,985,200 |
4,739,300 |
246,000 |
4.9% |
| MADERA |
65,800 |
60,900 |
5,000 |
7.5% |
| MARIN |
130,800 |
126,800 |
4,000 |
3.1% |
| MARIPOSA |
6,950 |
6,540 |
410 |
5.8% |
| MENDOCINO |
36,890 |
34,890 |
2,000 |
5.4% |
| MERCED |
115,300 |
104,100 |
11,200 |
9.7% |
| MODOC |
3,120 |
2,840 |
280 |
9.0% |
| MONO |
8,760 |
8,410 |
350 |
4.0% |
| MONTEREY |
217,600 |
198,400 |
19,200 |
8.8% |
| NAPA |
70,700 |
67,900 |
2,800 |
3.9% |
| NEVADA |
49,000 |
47,040 |
1,960 |
4.0% |
| ORANGE |
1,595,100 |
1,541,300 |
53,800 |
3.4% |
| PLACER |
194,000 |
187,000 |
7,000 |
3.6% |
| PLUMAS |
6,970 |
6,260 |
710 |
10.1% |
| RIVERSIDE |
1,152,300 |
1,100,500 |
51,800 |
4.5% |
| SACRAMENTO |
728,900 |
696,300 |
32,500 |
4.5% |
| SAN BENITO |
32,670 |
30,640 |
2,030 |
6.2% |
| SAN BERNARDINO |
1,007,700 |
963,600 |
44,200 |
4.4% |
| SAN DIEGO |
1,600,000 |
1,541,300 |
58,800 |
3.7% |
| SAN FRANCISCO |
575,900 |
559,600 |
16,200 |
2.8% |
| SAN JOAQUIN |
344,200 |
322,500 |
21,700 |
6.3% |
| SAN LUIS OBISPO |
137,200 |
132,500 |
4,700 |
3.5% |
| SAN MATEO |
455,700 |
443,700 |
12,000 |
2.6% |
| SANTA BARBARA |
220,300 |
210,300 |
9,900 |
4.5% |
| SANTA CLARA |
1,046,600 |
1,015,700 |
30,900 |
3.0% |
| SANTA CRUZ |
132,100 |
123,900 |
8,200 |
6.2% |
| SHASTA |
73,900 |
69,700 |
4,200 |
5.7% |
| SIERRA |
1,260 |
1,190 |
80 |
5.9% |
| SISKIYOU |
16,360 |
15,120 |
1,240 |
7.6% |
| SOLANO |
201,300 |
191,700 |
9,600 |
4.8% |
| SONOMA |
248,600 |
239,700 |
8,900 |
3.6% |
| STANISLAUS |
242,200 |
226,400 |
15,800 |
6.5% |
| SUTTER |
46,000 |
41,900 |
4,100 |
8.8% |
| TEHAMA |
25,580 |
24,000 |
1,580 |
6.2% |
| TRINITY |
4,450 |
4,130 |
320 |
7.2% |
| TULARE |
208,400 |
187,700 |
20,700 |
9.9% |
| TUOLUMNE |
19,600 |
18,600 |
1,100 |
5.4% |
| VENTURA |
413,300 |
395,900 |
17,400 |
4.2% |
| YOLO |
109,100 |
103,600 |
5,500 |
5.0% |
| YUBA |
31,800 |
29,500 |
2,300 |
7.2% |