NR No. 23-11
Contact: Loree Levy/Aubrey Henry
916-654-9029
mediainquiries@edd.ca.gov
IMPORTANT NOTE: The employment data for the month of February 2023 is taken from the survey week including Feb. 12th. Data for the month of March is scheduled for release on April 21, 2023.
Employers added 32,300 nonfarm payroll jobs
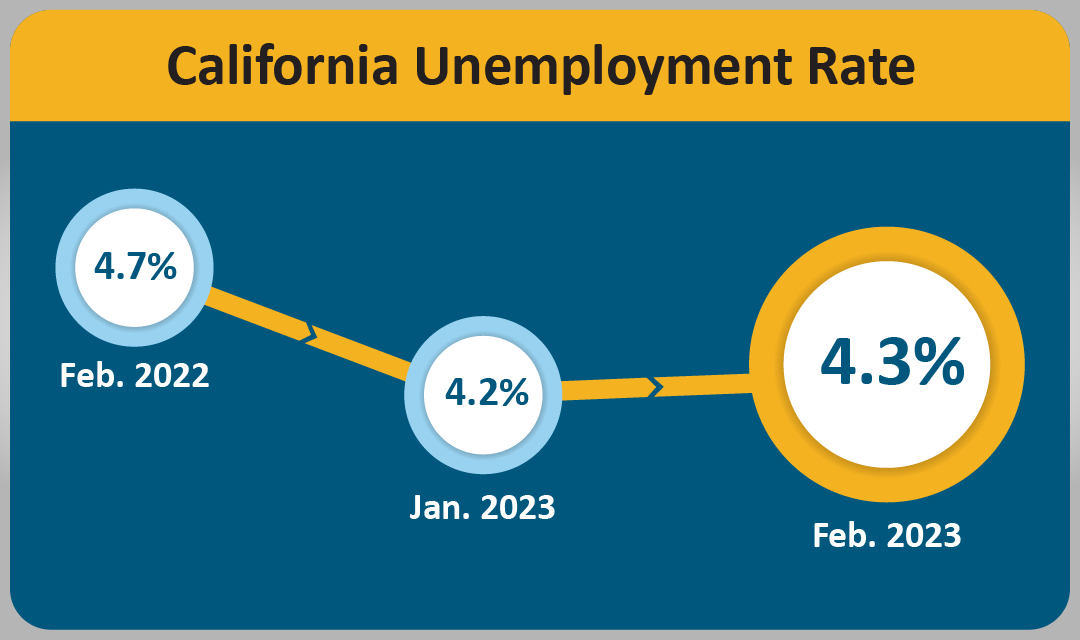
California’s unemployment rate increased by a tenth of a percentage point for the month of February 2023 to 4.3 percent1 despite the state’s employers adding 32,300 nonfarm payroll jobs2 to the economy, according to data released today by the California Employment Development Department (EDD) from two surveys
California’s Labor Market, by the Numbers...
- Of the 311,000 jobs gained nationally in February 2023, California accounted for 32,300, or 10.4 percent, of the nation’s overall non-farm job growth.
- Since the current economic expansion began in April 2020, California has gained 3,051,600 jobs, a monthly average of 89,753 jobs gained over that time.
- Eight of California’s 11 industry sectors gained jobs in February with Private Education & Health Services (+11,300) leading the way with strong gains in the Health Care and Social Assistance subsector where most of the gains were centralized in Offices of Physicians and Child Day Care Services.
- Leisure & Hospitality (+11,200) yet again enjoyed strong month-over gains, thanks largely to Limited-Service Restaurants and Other Eating Places, as well as gains in Performing Arts, Spectator Sports, and Related Industries Residual, which includes Event and Concert Promoters and Organizers, as well as Talent and Sports Agents.
- Information (-2,900) was the only industry sector to see a reduction in February 2023. Software Publishers contributed to the decline.
1. The unemployment rate comes from a separate federal survey of 5,100 California households.
2. The nonfarm payroll job numbers come from a federal survey of 80,000 California businesses.
Data Trends about Jobs in the Economy
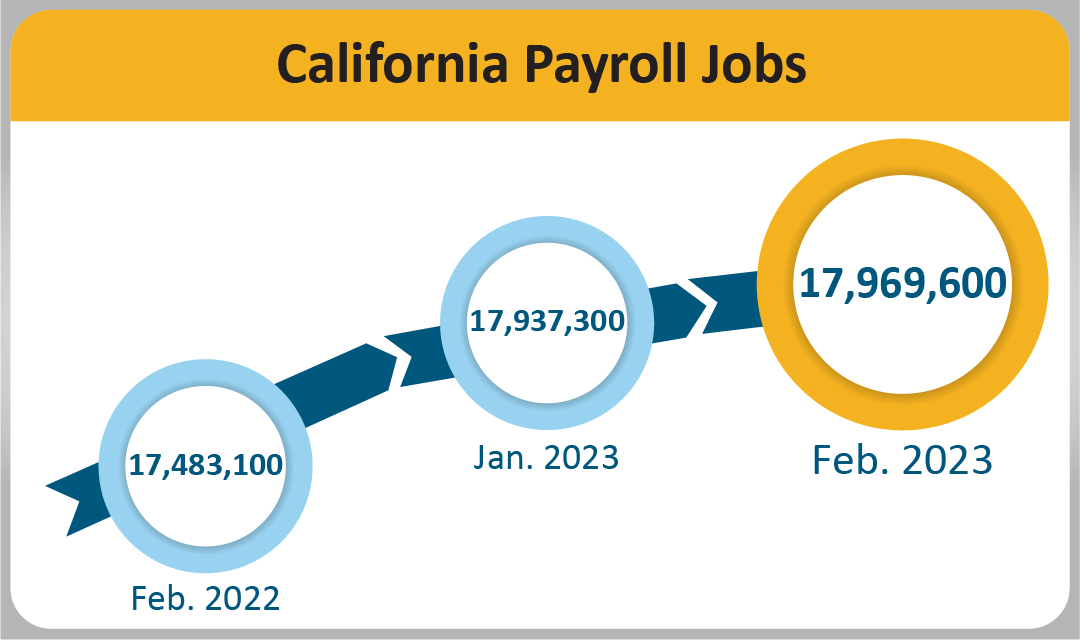
Total Nonfarm Payroll Jobs
Total Nonfarm Payroll Jobs (Comes from a monthly survey of approximately 80,000 California businesses that estimates jobs in the economy – seasonally adjusted)
- Month-over – Total nonfarm jobs in California’s 11 major industries totaled 17,969,600 in February – a net gain of 32,300 from January. This followed a downward revised (-29,100) month-over gain of 67,600 jobs in January.
- Year-over – Total nonfarm jobs increased by 486,500 (a 2.8 percent increase) from February 2022 to February 2023 compared to the U.S. annual gain 4,340,000 jobs (a 2.9 percent increase).
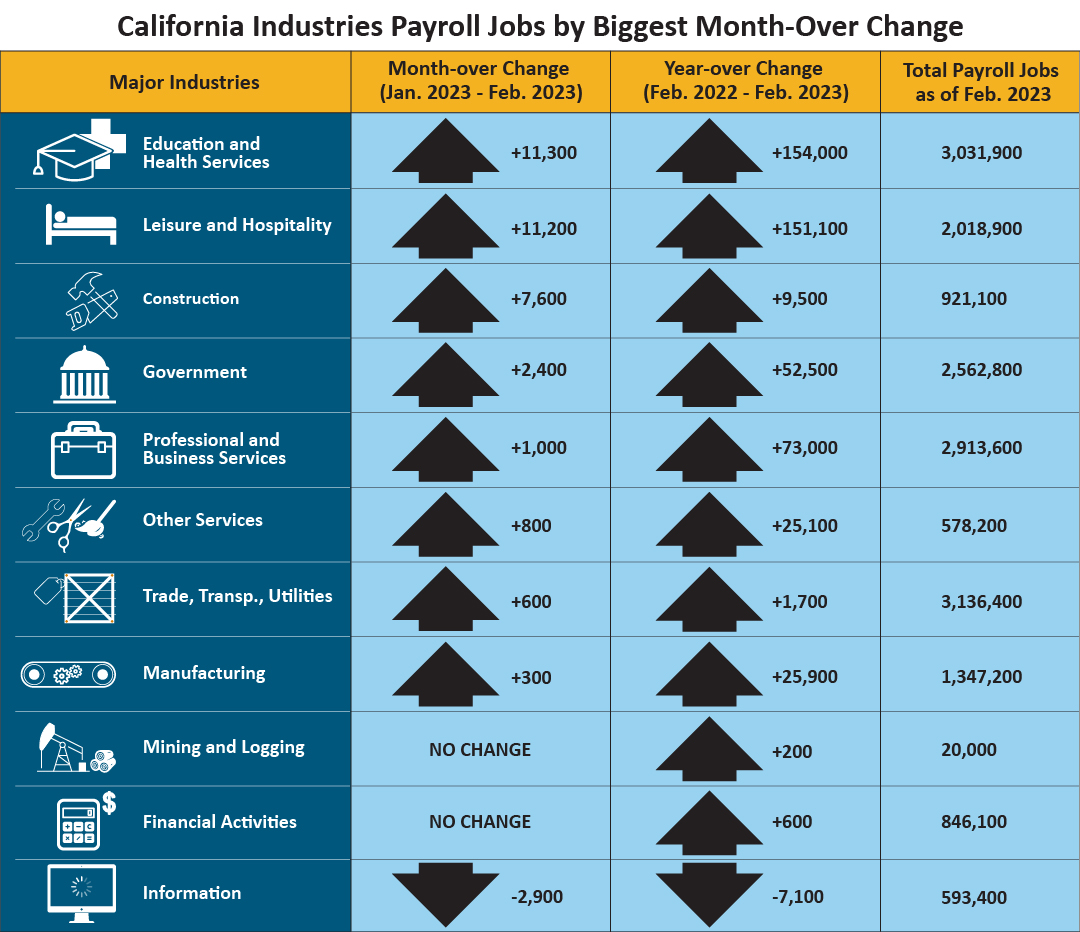
| Major Industries |
Month-over Change (January 2023–February 2023) |
Year-over Change (February 2022–February 2023) |
Total Payroll Jobs as of February 2023 |
| Education and Health Services |
+11,300 |
+154,000 |
3,031,900 |
| Leisure and Hospitality |
+11,200 |
+151,100 |
2,018,900 |
| Construction |
+7,600 |
+9,500 |
921,100 |
| Government |
+2,400 |
+52,500 |
2,562,800 |
| Professional and Business Services |
+1,000 |
+73,000 |
2,913,600 |
| Other Services |
+800 |
+25,100 |
578,200 |
| Trade, Transp., Utilities |
+600 |
+1,700 |
3,136,400 |
| Manufacturing |
+300 |
+25,900 |
1,347,200 |
| Mining and Logging |
No Change |
+200 |
20,000 |
| Financial Activities |
No Change |
+600 |
846,100 |
| Information |
-2,900 |
-7,100 |
593,400 |
Total Farm jobs – The number of jobs in the agriculture industry increased from January by 3,000 to a total of 437,400 jobs in February. The agricultural industry had 20,300 more farm jobs in February 2023 than it did in February a year ago.
Data Trends about Workers in the Economy
Employment and Unemployment in California (Based on a monthly federal survey of 5,100 California households which focuses on workers in the economy)
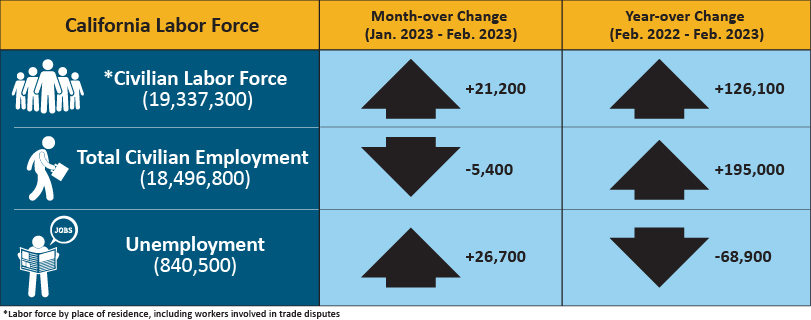
- Employed – The number of Californians employed in February was 18,496,800, a decrease of 5,400 persons from January’s total of 18,502,200, but up 195,000 from the employment total in February 2022.
- Unemployed – The number of unemployed Californians was 840,500 in February, an increase of 26,700 over the month, but down 68,900 in comparison to February 2022.
| California Labor Force |
Month-over Change (January 2023–February 2023) |
Year-over Change (February 2022–February 2023) |
| * Civilian Labor Force (19,337,300) |
+21,200 |
+126,100 |
| Total Civilian Employment (18,496,800) |
-5,400 |
+195,000 |
| Unemployment (840,500) |
+26,700 |
-68,900 |
* Labor force by place of residence, including workers involved in trade disputes.
Unemployment Insurance Claims (Not Seasonally Adjusted)
The following data is from a sample week that includes the 19th of each month: In related data that figures into the state’s unemployment rate, there were 380,768 people certifying for Unemployment Insurance benefits during the February 2023 sample week. That compares to 368,865 people in January and 425,221 people in February 2022. Concurrently, 40,583 initial claims were processed in the February 2023 sample week, which was a month-over decrease of 7,567 claims from January and also a year-over decrease of 3,119 claims from February 2022.
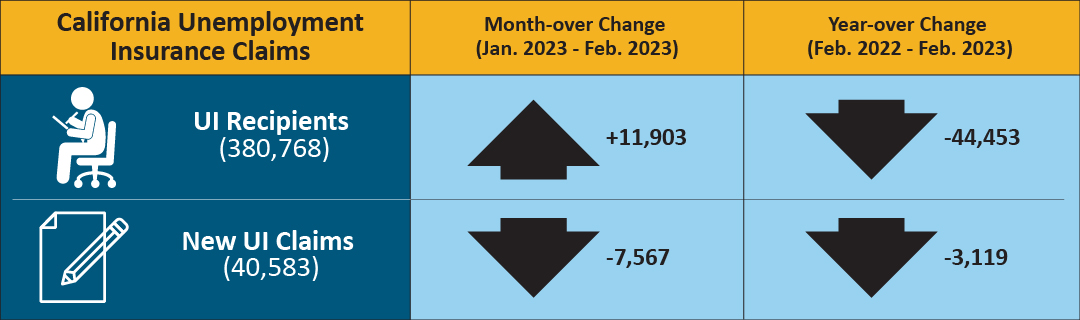
| California Unemployment Insurance Claims |
Month-over Change (January 2023–February 2023) |
Year-over Change (February 2022–February 2023) |
| UI Recipients (380,768) |
+11,903 |
-44,453 |
| New UI Claims (40,583) |
-7,567 |
-3,119 |
MONTHLY LABOR FORCE DATA FOR COUNTIES
February 2023 (Preliminary); 2022 Benchmark
NOT SEASONALLY ADJUSTED
| COUNTY |
LABOR FORCE |
EMPLOYMENT |
UNEMPLOYMENT |
RATE |
| STATE TOTAL |
19,464,000 |
18,526,400 |
937,600 |
4.8% |
| ALAMEDA |
832,300 |
801,300 |
31,000 |
3.7% |
| ALPINE |
640 |
600 |
40 |
5.7% |
| AMADOR |
14,440 |
13,640 |
800 |
5.5% |
| BUTTE |
93,400 |
88,200 |
5,200 |
5.6% |
| CALAVERAS |
22,360 |
21,390 |
970 |
4.3% |
| COLUSA |
10,440 |
8,520 |
1,910 |
18.3% |
| CONTRA COSTA |
555,800 |
534,000 |
21,800 |
3.9% |
| DEL NORTE |
9,210 |
8,670 |
550 |
5.9% |
| EL DORADO |
94,400 |
90,600 |
3,800 |
4.0% |
| FRESNO |
466,800 |
428,900 |
37,900 |
8.1% |
| GLENN |
13,070 |
12,190 |
880 |
6.7% |
| HUMBOLDT |
60,000 |
57,200 |
2,800 |
4.7% |
| IMPERIAL |
71,700 |
60,500 |
11,200 |
15.6% |
| INYO |
8,310 |
7,970 |
340 |
4.1% |
| KERN |
399,200 |
363,500 |
35,700 |
8.9% |
| KINGS |
58,800 |
53,400 |
5,400 |
9.2% |
| LAKE |
28,660 |
26,890 |
1,780 |
6.2% |
| LASSEN |
9,200 |
8,630 |
570 |
6.2% |
| LOS ANGELES |
5,042,700 |
4,777,500 |
265,200 |
5.3% |
| MADERA |
67,000 |
61,600 |
5,400 |
8.1% |
| MARIN |
131,900 |
127,800 |
4,100 |
3.1% |
| MARIPOSA |
7,190 |
6,710 |
480 |
6.7% |
| MENDOCINO |
37,320 |
35,360 |
1,950 |
5.2% |
| MERCED |
117,600 |
105,200 |
12,400 |
10.5% |
| MODOC |
3,150 |
2,870 |
280 |
8.8% |
| MONO |
8,930 |
8,590 |
340 |
3.8% |
| MONTEREY |
221,600 |
200,600 |
21,000 |
9.5% |
| NAPA |
71,700 |
69,100 |
2,700 |
3.7% |
| NEVADA |
49,000 |
47,010 |
1,980 |
4.0% |
| ORANGE |
1,606,500 |
1,551,400 |
55,100 |
3.4% |
| PLACER |
195,900 |
188,700 |
7,200 |
3.7% |
| PLUMAS |
7,130 |
6,360 |
770 |
10.8% |
| RIVERSIDE |
1,158,100 |
1,105,500 |
52,500 |
4.5% |
| SACRAMENTO |
735,500 |
702,700 |
32,800 |
4.5% |
| SAN BENITO |
33,100 |
31,000 |
2,100 |
6.4% |
| SAN BERNARDINO |
1,013,600 |
968,100 |
45,400 |
4.5% |
| SAN DIEGO |
1,610,800 |
1,551,000 |
59,800 |
3.7% |
| SAN FRANCISCO |
577,800 |
561,100 |
16,700 |
2.9% |
| SAN JOAQUIN |
350,300 |
328,000 |
22,300 |
6.4% |
| SAN LUIS OBISPO |
139,600 |
134,800 |
4,700 |
3.4% |
| SAN MATEO |
457,500 |
444,900 |
12,600 |
2.8% |
| SANTA BARBARA |
225,200 |
215,000 |
10,200 |
4.5% |
| SANTA CLARA |
1,051,400 |
1,018,800 |
32,600 |
3.1% |
| SANTA CRUZ |
134,700 |
125,700 |
9,000 |
6.7% |
| SHASTA |
74,100 |
69,900 |
4,300 |
5.8% |
| SIERRA |
1,280 |
1,200 |
80 |
6.0% |
| SISKIYOU |
16,500 |
15,220 |
1,270 |
7.7% |
| SOLANO |
203,500 |
193,900 |
9,600 |
4.7% |
| SONOMA |
250,700 |
241,700 |
9,000 |
3.6% |
| STANISLAUS |
244,500 |
228,300 |
16,200 |
6.6% |
| SUTTER |
46,800 |
42,600 |
4,200 |
9.0% |
| TEHAMA |
25,640 |
24,020 |
1,620 |
6.3% |
| TRINITY |
4,430 |
4,130 |
300 |
6.8% |
| TULARE |
212,700 |
190,000 |
22,600 |
10.6% |
| TUOLUMNE |
19,940 |
18,840 |
1,100 |
5.5% |
| VENTURA |
417,700 |
400,600 |
17,100 |
4.1% |
| YOLO |
110,200 |
104,600 |
5,500 |
5.0% |
| YUBA |
32,200 |
29,900 |
2,300 |
7.2% |