新闻发布号: 23-36
联络: Loree Levy/Aubrey Henry
916-654-9029
mediainquiries@edd.ca.gov
重要说明:2023 年 8 月的就业数据取自包括 8 月 12 日在内的取样周。 9月份的数据预计于2023年10月20日发布。
雇主增加了 23,100 个非农就业岗位
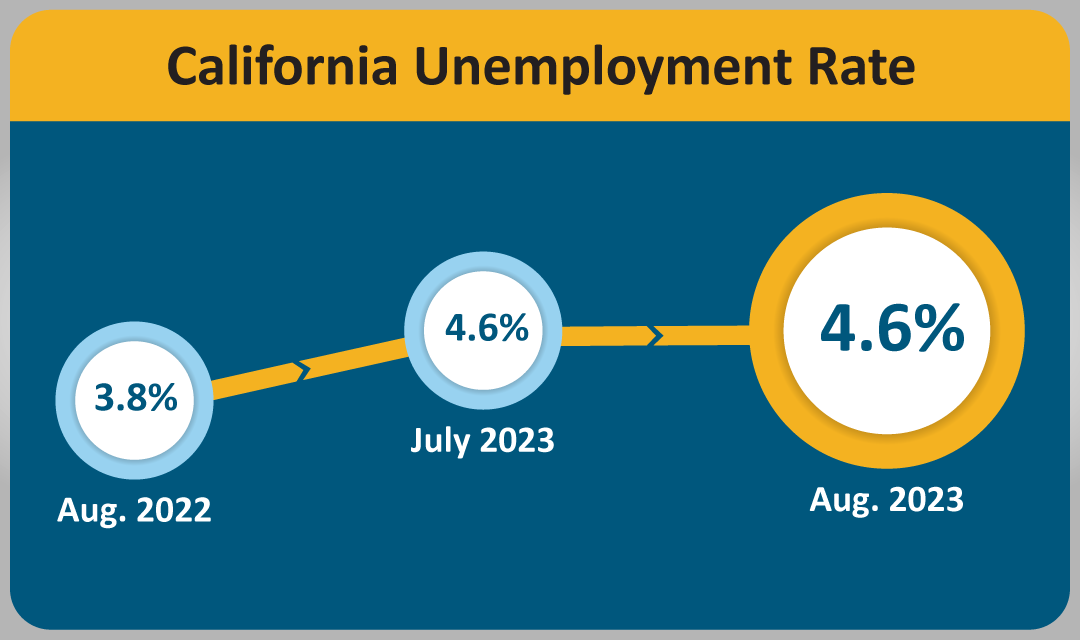
萨克拉门托—加州就业发展局 (EDD) 今天发布的两项调查数据显示,加州失业率连续第三个月保持在4.6%1,加州雇主为经济活动增加了 23,100 个非农就业岗位2。由于休闲与酒店业、信息产业和政府行业部门的职位削减,2023 年 7 月的非农就业总数下调了 19,000 个。
从数字看加州的劳动力市场…
-
自 2020 年 4 月开始当前经济扩张活动以来,加州已增加了 3,202,200 个工作岗位,平均每月增加80,055 个工作岗位。
-
加州 8 月份非农就业增长占全国就业增长的 12.4%,高于加州占美国非农就业总数 11.6% 的份额。
-
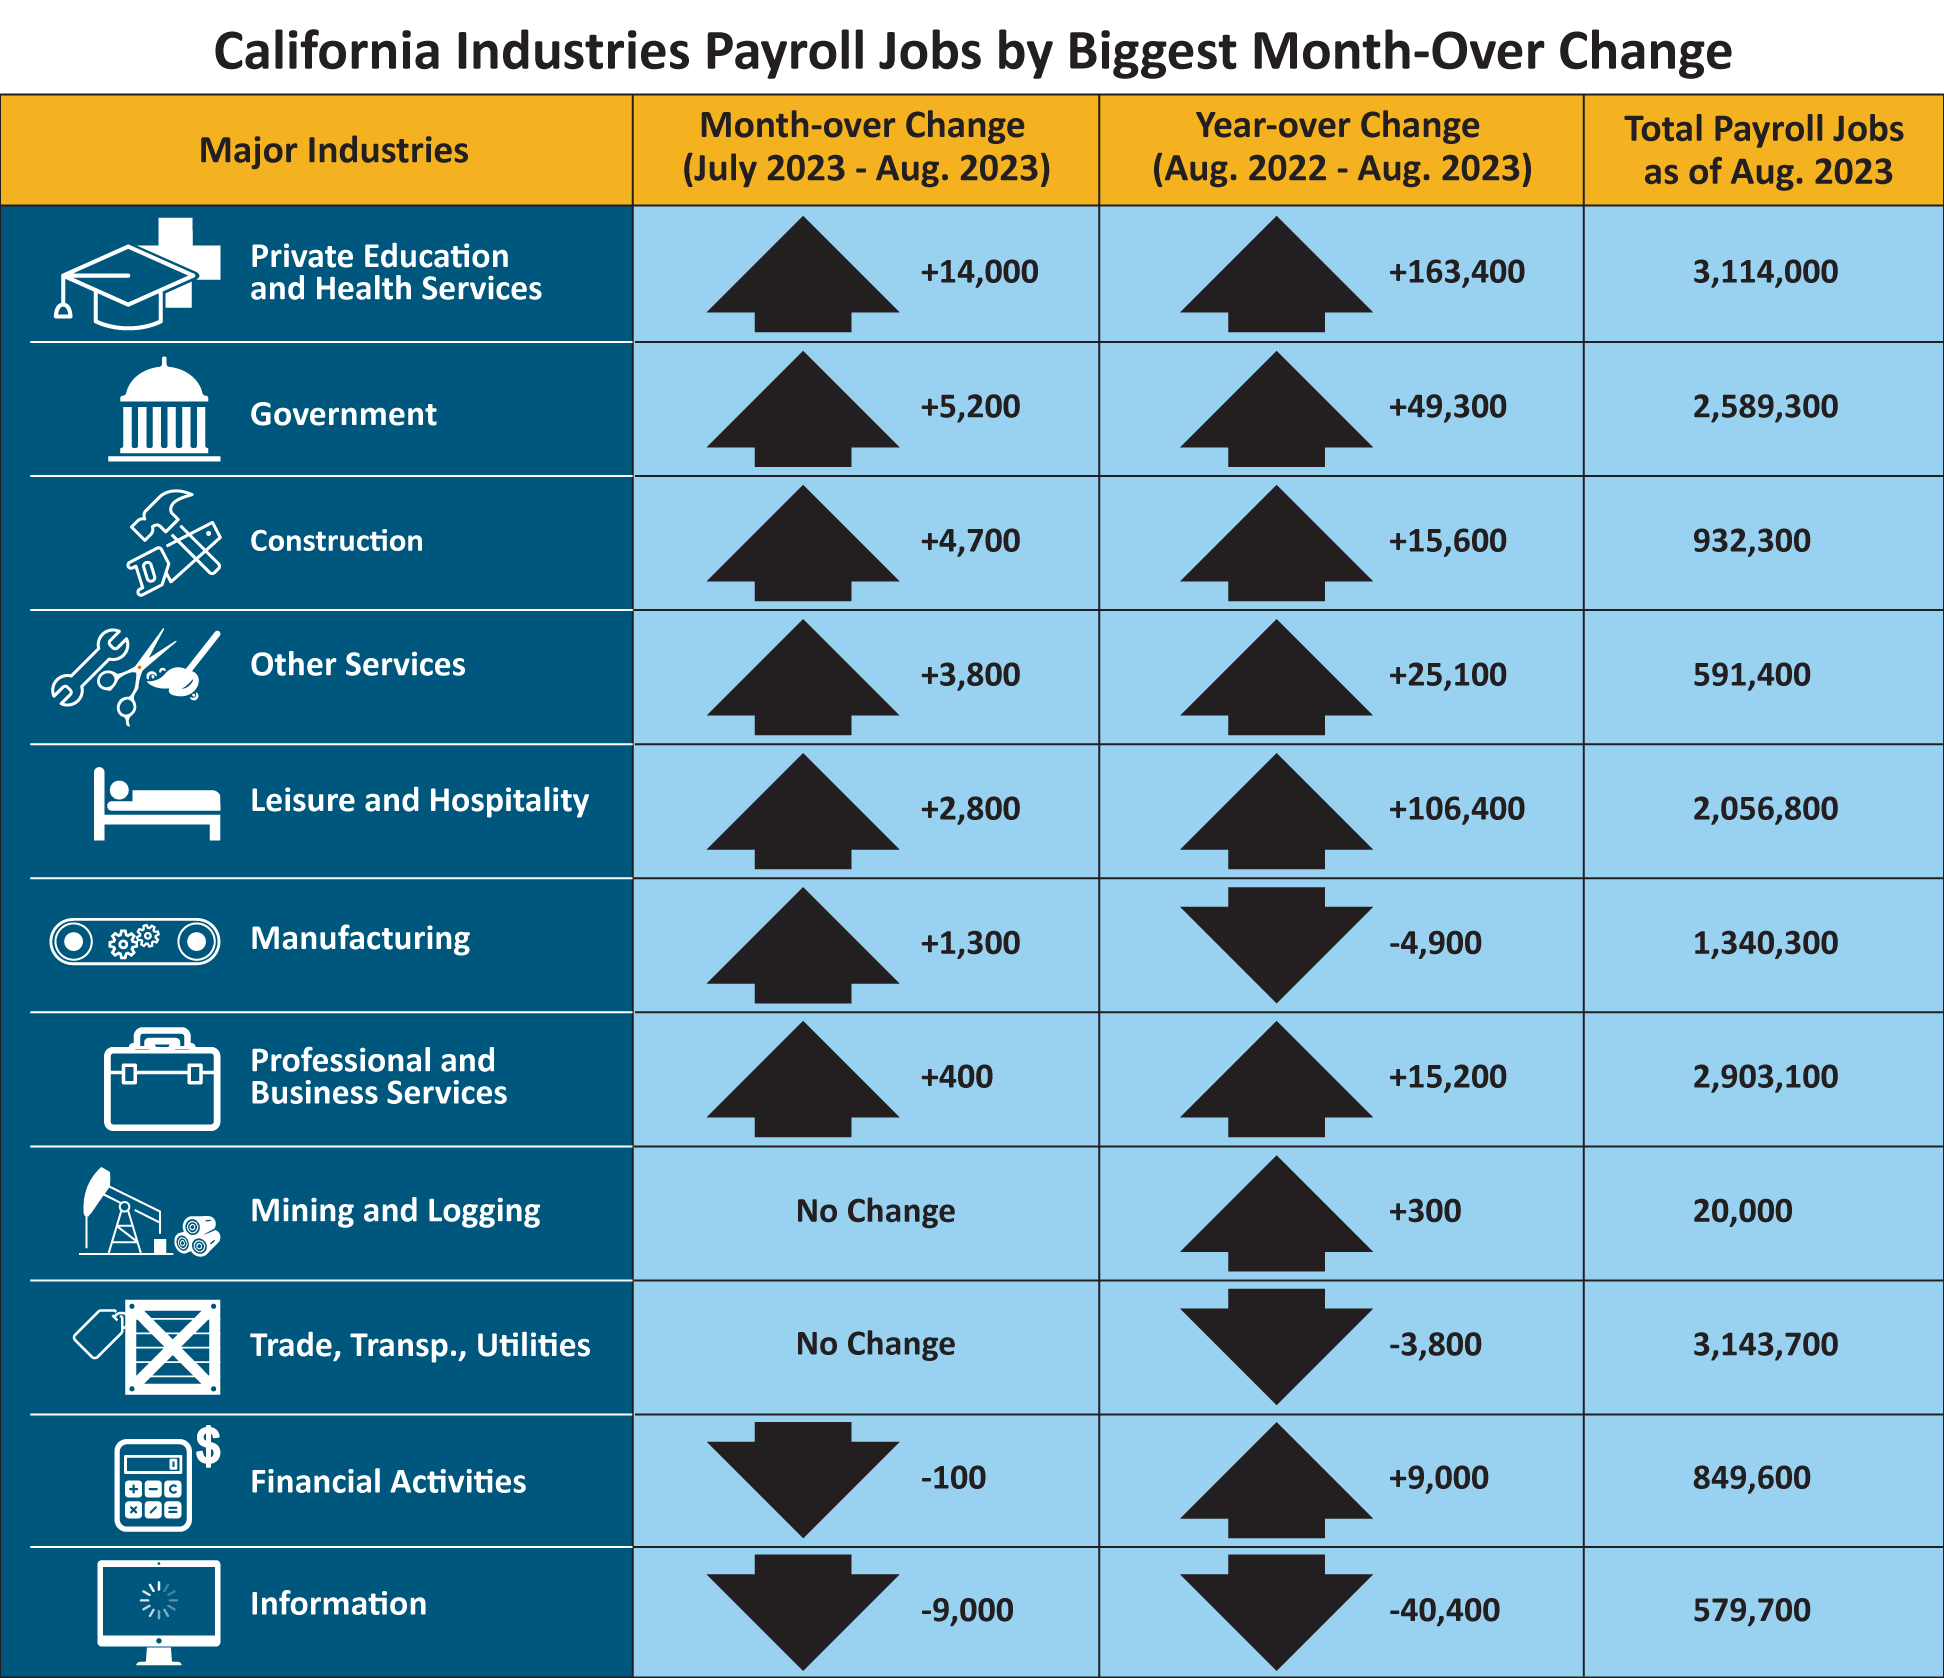
加州 11 个行业中的 7 个行业在 8 月份增加了就业,其中私立教育和健康服务 (+14,000) 领先,这要归功于个人和家庭服务的业务强劲以及私立学院、大学和专业学校的职位增加。
-
政府部门 (+5,200) 也取得了良好的进展,这主要归功于地方政府教育服务领域的增长。
-
信息部门的大部分职位损失(-9,000)来自电影和录音部门,至少部分受到了编剧和演员罢工的影响。其余的职位损失来自计算基础设施提供商、数据处理、网络托管和相关服务行业。
1. 失业率来自联邦另一项对 5,100 个加州家庭调查的资料。.
2. 非农就业人数来自联邦对 80,000 家加州企业调查的资料。
经济活动中的就业数据趋势
非农就业岗位总数 (数据来自对大约 80,000 家加州企业的月度调查,该调查评估经济活动中的就业岗位——经过季节性调整。)
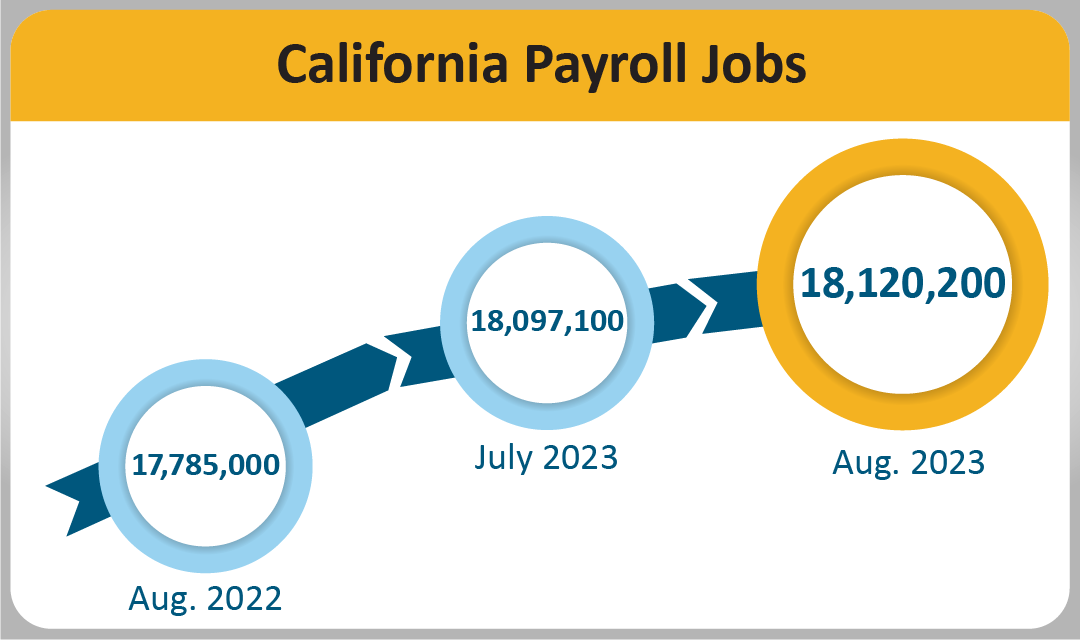
- 月环比—8 月份加州 11 个主要行业的非农就业岗位总数为 18,120,200 个,比 7 月份净增加 23,100 个。此前,7 月份就业岗位已向下修正(-19,000),环比增加了 8,900 个。
- 年同比—从 2022 年 8 月到 2023 年 8 月,非农就业岗位总数增加了 335,200 个(增长 1.9%),而美国的年度增长为 3,087,000 个(增长 2.0%)。
| Major Industries |
Month-over Change (June 2023–July 2023) |
Year-over Change (July 2022–July 2023) |
Total Payroll Jobs as of July 2023 |
|
Government
|
+15,000 |
+57,600 |
2,594,600 |
|
Private Education and Health Services
|
+10,800 |
+159,400 |
3,102,900 |
|
Leisure and Hospitality
|
+10,300 |
+120,100 |
2,061,800 |
|
Trade, Transp., Utilities
|
+4,500 |
-2,700 |
3,144,500 |
|
Other Services
|
+2,200 |
+23,800 |
588,000 |
| Manufacturing |
+1,900 |
+1,800 |
1,339,700 |
|
Construction
|
+500 |
+13,800 |
928,300 |
|
Mining and Logging
|
-100 |
+200 |
19,900 |
|
Financial Activities
|
-2,000 |
+4,500 |
847,000 |
|
Information
|
-3,800 |
-26,000 |
593,600 |
|
Professional and Business Services
|
-11,400 |
+14,700 |
2,895,800 |
农业就业岗位总数—8月份农业就业岗位数量较7月份减少1,300个,至430,500个。2023年8月,农业就业岗位比去年同期增加了8,600个。
经济活动中的人力资源数据趋势
加州就业与失业数据(基于一项针对加州5,100户家庭的月度联邦调查,该调查重点关注经济中的劳动者)
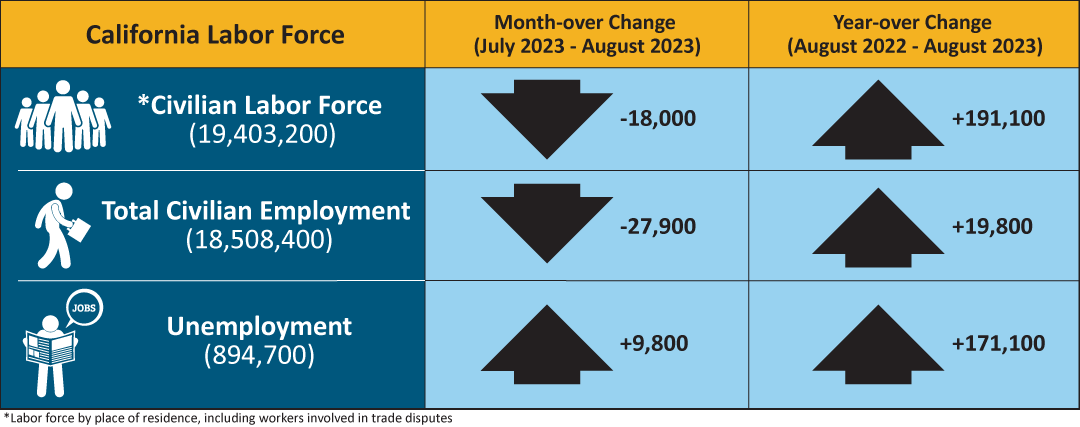
- 就业人数—8月份加州就业人数为18,508,400人,较7月份的18,536,300人减少27,900人,但较2022年8月的就业总人数增加19,800人。
- 失业人数—8月份加州失业人数为894,700人,较上月增加9,800人,较2022年8月增加171,100人。
| California Labor Force |
Month-over Change (June 2023–July 2023) |
Year-over Change (July 2022–July 2023) |
| * Civilian Labor Force (19,422,000) |
-21,700 |
+183,700 |
| Total Civilian Employment (18,537,400) |
-17,000 |
+31,300 |
| Unemployment (884,600) |
-4,700 |
+152,400 |
* Labor force by place of residence, including workers involved in trade disputes.
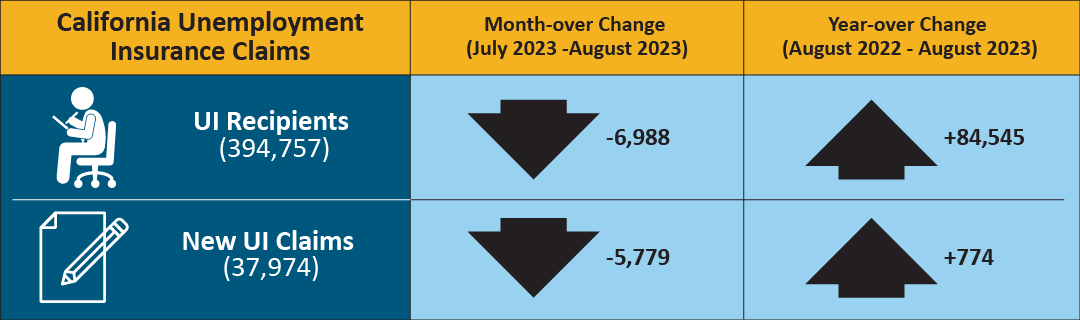
申领失业保险金的人数(未经季节性调整 )
以下数据来自包括每月 19 日在内的样本周:
根据用相关数据算出的加州失业率,在2023 年 8 月样本周期间394,757 人申领失业保险福利。相比之下,7 月有 401,745 人,2022 年 8 月有 310,212 人。同时,2023 年 8 月样本周处理了 37,974 名初次申请案例,比 7 月环比减少了 5,779 人,但和2022 年 8 月相比增加了 774 人。
| California Unemployment Insurance Claims |
Month-over Change (June 2023–July 2023) |
Year-over Change (July 2022–July 2023) |
| UI Recipients (401,745) |
+16,904 |
+85,482 |
| New UI Claims (43,753) |
+298 |
+3,574 |
MONTHLY LABOR FORCE DATA FOR COUNTIES
August 2023 (Preliminary); 2022 Benchmark
NOT SEASONALLY ADJUSTED
| COUNTY |
LABOR FORCE |
EMPLOYMENT |
UNEMPLOYMENT |
RATE |
| STATE TOTAL |
19,340,800 |
18,347,200 |
993,600 |
5.1% |
| ALAMEDA |
831,600 |
794,200 |
37,400 |
4.5% |
| ALPINE |
510 |
470 |
40 |
7.5% |
| AMADOR |
14,570 |
13,830 |
740 |
5.1% |
| BUTTE |
91,100 |
86,200 |
4,900 |
5.3% |
| CALAVERAS |
22,5100 |
21,560 |
950 |
4.2% |
| COLUSA |
10,5500 |
9,560 |
1,000 |
9.4% |
| CONTRA COSTA |
553,600 |
528,700 |
24,900 |
4.5% |
| DEL NORTE |
9,480 |
8,920 |
560 |
5.9% |
| EL DORADO |
93,900 |
90,100 |
3,900 |
4.1% |
| FRESNO |
458,400 |
426,100 |
32,300 |
7.0% |
| GLENN |
12,240 |
11,450 |
800 |
6.5% |
| HUMBOLDT |
58,800 |
55,800 |
2,900 |
5.0% |
| IMPERIAL |
71,900 |
57,700 |
14,200 |
19.7% |
| INYO |
8,360 |
8,040 |
320 |
3.8% |
| KERN |
397,400 |
365,300 |
32,000 |
8.1% |
| KINGS |
57,500 |
53,100 |
4,400 |
7.7% |
| LAKE |
28,1600 |
26,590 |
1,570 |
5.6% |
| LASSEN |
8,760 |
8,340 |
420 |
4.8% |
| LOS ANGELES |
5,004,300 |
4,712,300 |
292,000 |
5.8% |
| MADERA |
64,700 |
60,100 |
4,600 |
7.0% |
| MARIN |
132,300 |
127,400 |
4,900 |
3.7% |
| MARIPOSA |
7,700 |
7,330 |
370 |
4.8% |
| MENDOCINO |
36,630 |
34,930 |
1,700 |
4.6% |
| MERCED |
116,100 |
106,100 |
10,000 |
8.6% |
| MODOC |
3,230 |
3,070 |
160 |
5.1% |
| MONO |
9,160 |
8,810 |
350 |
3.9% |
| MONTEREY |
237,300 |
225,700 |
11,700 |
4.9% |
| NAPA |
72,000 |
69,400 |
2,600 |
3.6% |
| NEVADA |
47,630 |
45,640 |
1,990 |
4.2% |
| ORANGE |
1,592,500 |
1,529,900 |
62,600 |
3.9% |
| PLACER |
195,700 |
187,800 |
7,800 |
4.0% |
| PLUMAS |
7,520 |
7,090 |
430 |
5.7% |
| RIVERSIDE |
1,143,100 |
1,081,300 |
61,800 |
5.4% |
| SACRAMENTO |
734,900 |
700,400 |
34,500 |
4.7% |
| SAN BENITO |
32,500 |
30,700 |
1,800 |
5.6% |
| SAN BERNARDINO |
999,400 |
948,400 |
51,000 |
5.1% |
| SAN DIEGO |
1,594,100 |
1,525,700 |
68,400 |
4.3% |
| SAN FRANCISCO |
578,400 |
557,800 |
20,600 |
3.6% |
| SAN JOAQUIN |
345,900 |
324,400 |
21,500 |
6.2% |
| SAN LUIS OBISPO |
138,100 |
133,000 |
5,100 |
3.7% |
| SAN MATEO |
457,100 |
441,900 |
15,200 |
3.3% |
| SANTA BARBARA |
226,100 |
217,300 |
8,800 |
3.9% |
| SANTA CLARA |
1,051,800 |
1,011,100 |
40,700 |
3.9% |
| SANTA CRUZ |
135,800 |
128,900 |
6,900 |
5.1% |
| SHASTA |
73,000 |
69,300 |
3,700 |
5.1% |
| SIERRA |
1,350 |
1,290 |
60 |
4.1% |
| SISKIYOU |
17,230 |
16,240 |
1,000 |
5.8% |
| SOLANO |
202,000 |
192,100 |
9,900 |
4.9% |
| SONOMA |
250,100 |
240,500 |
9,600 |
3.8% |
| STANISLAUS |
241,200 |
225,500 |
15,700 |
6.5% |
| SUTTER |
47,700 |
44,700 |
3,100 |
6.5% |
| TEHAMA |
25,770 |
24,210 |
1,560 |
6.0% |
| TRINITY |
4,650 |
4,410 |
240 |
5.2% |
| TULARE |
209,400 |
188,800 |
20,600 |
9.8% |
| TUOLUMNE |
20,280 |
19,240 |
1,040 |
5.1% |
| VENTURA |
412,100 |
393,000 |
19,100 |
4.6% |
| YOLO |
110,400 |
105,300 |
5,100 |
4.7% |
| YUBA |
32,300 |
30,300 |
2,000 |
6.3% |