NR No. 22-03
Contact: Loree Levy/Aubrey Henry
916-654-9029
mediainquiries@edd.ca.gov
IMPORTANT NOTE: The employment data for the month of December 2021 is taken from the survey week including December 12. Data for the month of January is scheduled for release on March 11, 2022.
Employers added 50,700 nonfarm payroll jobs
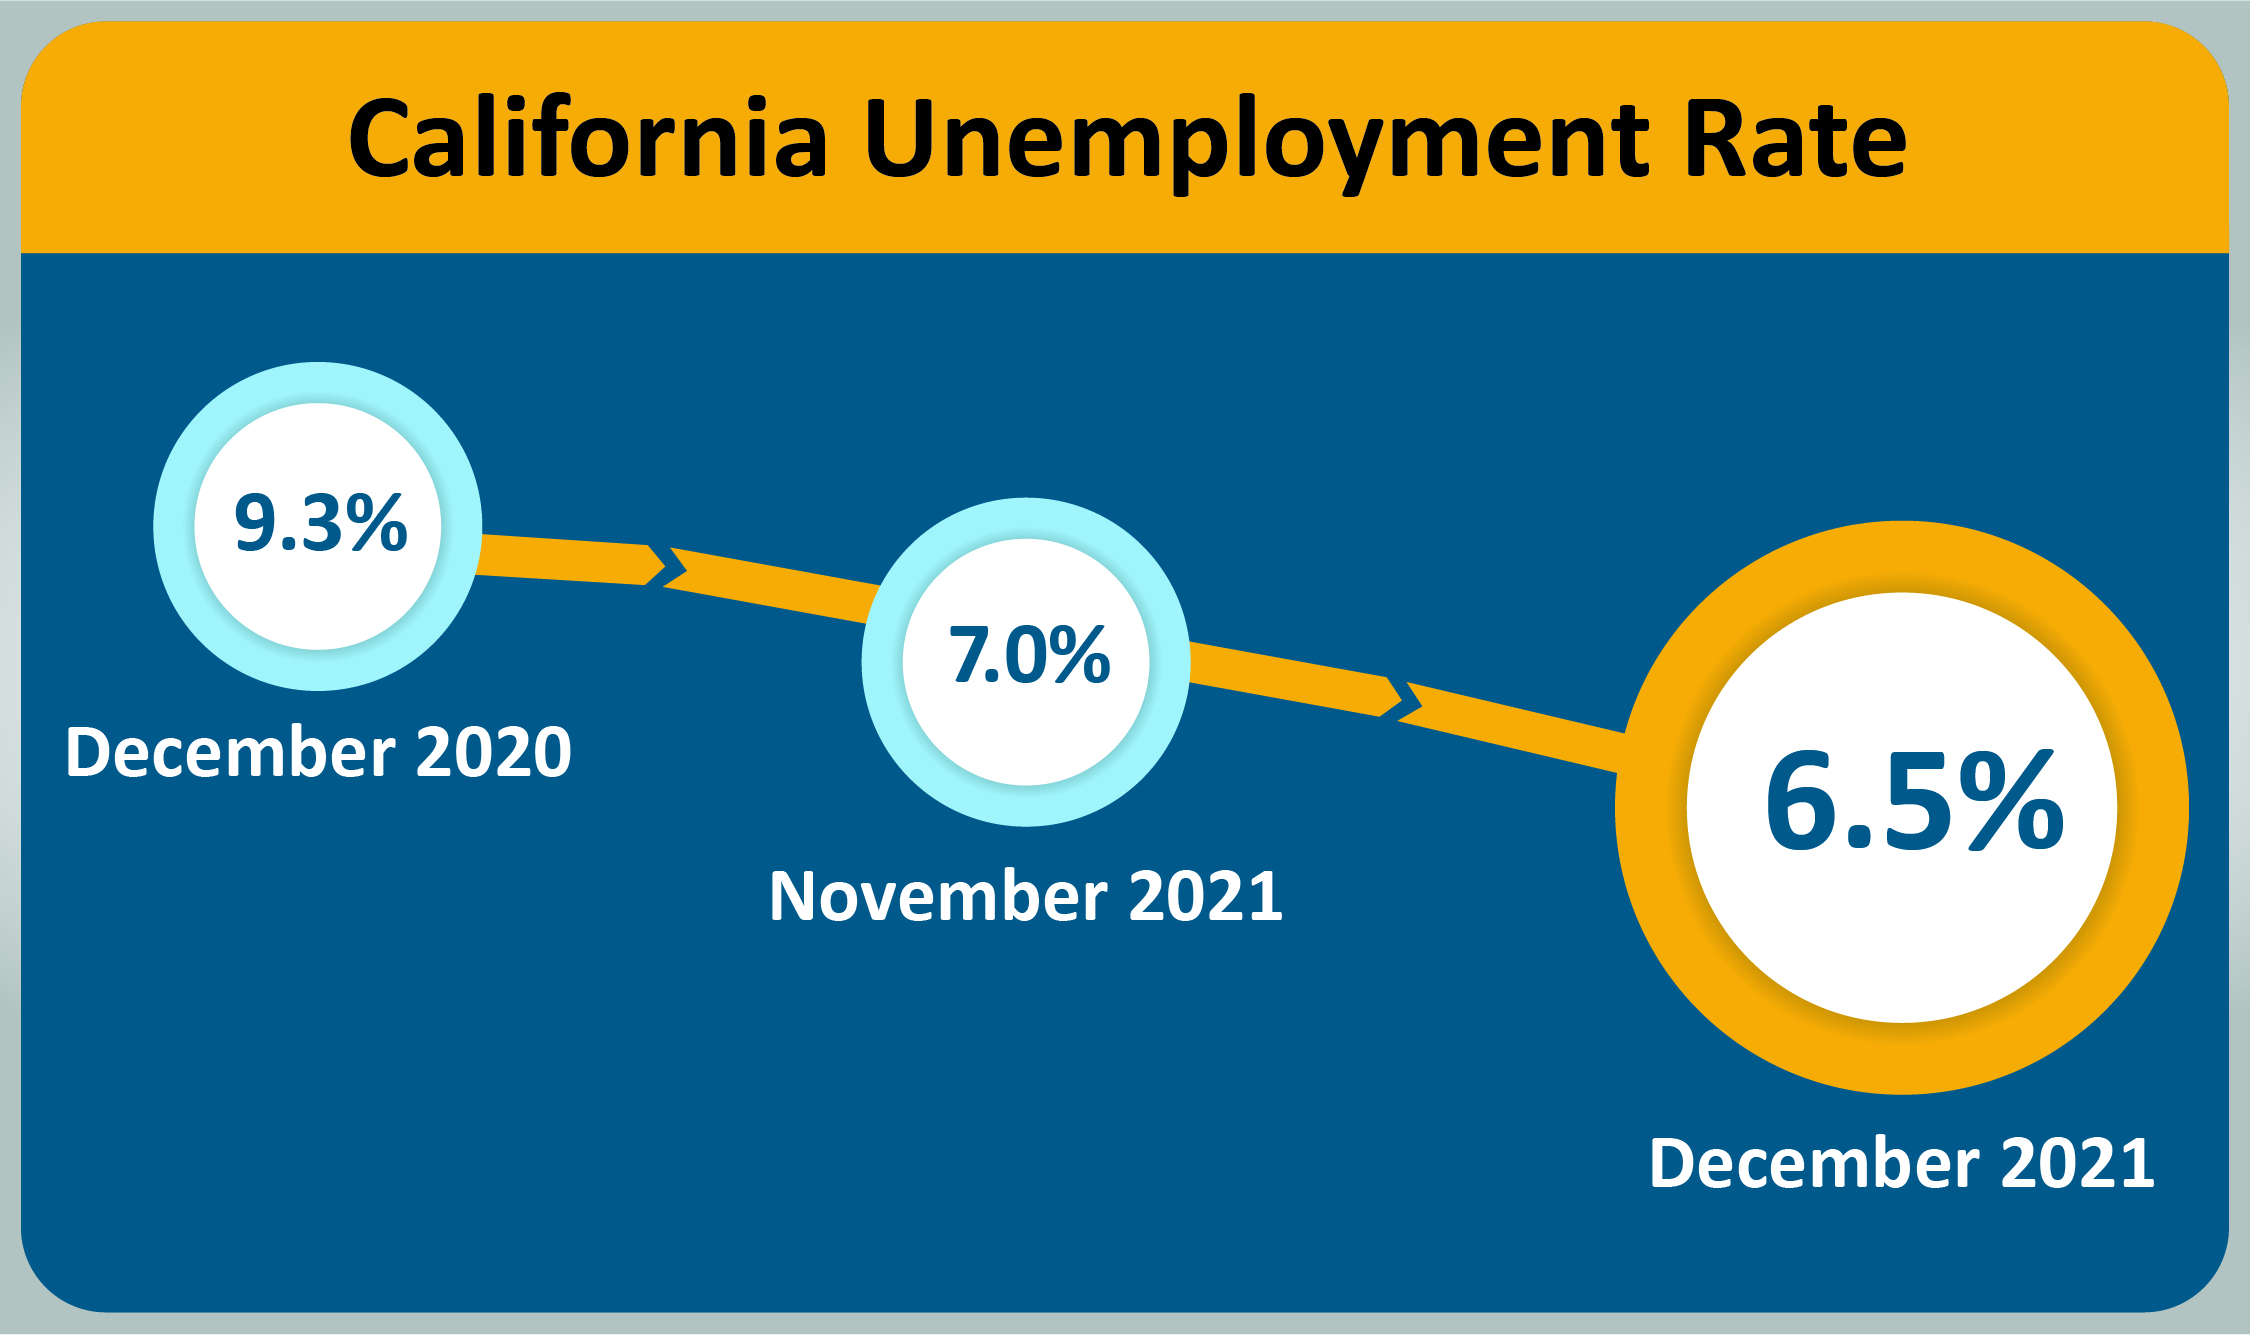
SACRAMENTO – California’s unemployment rate dropped a half percentage point from November 2021 to 6.5 percent1 in December as the state’s employers added 50,700 non-farm payroll jobs2 to the economy, according to data released today by the California Employment Development Department (EDD) from two surveys. November’s unemployment rate was revised up 0.1 percentage points to 7.0 percent due to an increase of 3,500 unemployed persons.
California’s Labor Market, by the Numbers...
- Since February 2021, California has added 1,034,400 total nonfarm jobs, which averages out to be a gain of 94,036 jobs per month for that time period.
- California has seen a year-over record six percent in nonfarm jobs for 2021, which is the largest calendar year increase in the official series data going back to 1990.
- California’s December 2021 gain of 50,700 nonfarm jobs accounted for nearly 25.5 percent of the nation’s 199,000 overall jobs gain for the month.
- The state has now regained 1,946,200, or nearly 72 percent, of the 2,714,800 jobs that were lost in March and April 2020 due to the COVID-19 pandemic.
- Ten of California’s 11 industry sectors gained jobs in December with Leisure & Hospitality (+15,000) leading the way due to significant gains in Food Services and Drinking Places.
- Professional & Business Services (+12,000) has regained all of the jobs it lost during the pandemic-induced recession and had good month-over gains in Professional, Scientific and Technical Services with Computer Systems Design and Related Services contributing strongly.
- Month-over, no industry sectors lost jobs for the first time since March 2021.
1. The unemployment rate comes from a separate federal survey of 5,100 California households.
2. The nonfarm payroll job numbers come from a federal survey of 80,000 California businesses.
Data Trends about Jobs in the Economy
Total Nonfarm Payroll Jobs
This comes from a monthly survey of approximately 80,000 California businesses that estimates jobs in the economy – seasonally adjusted.
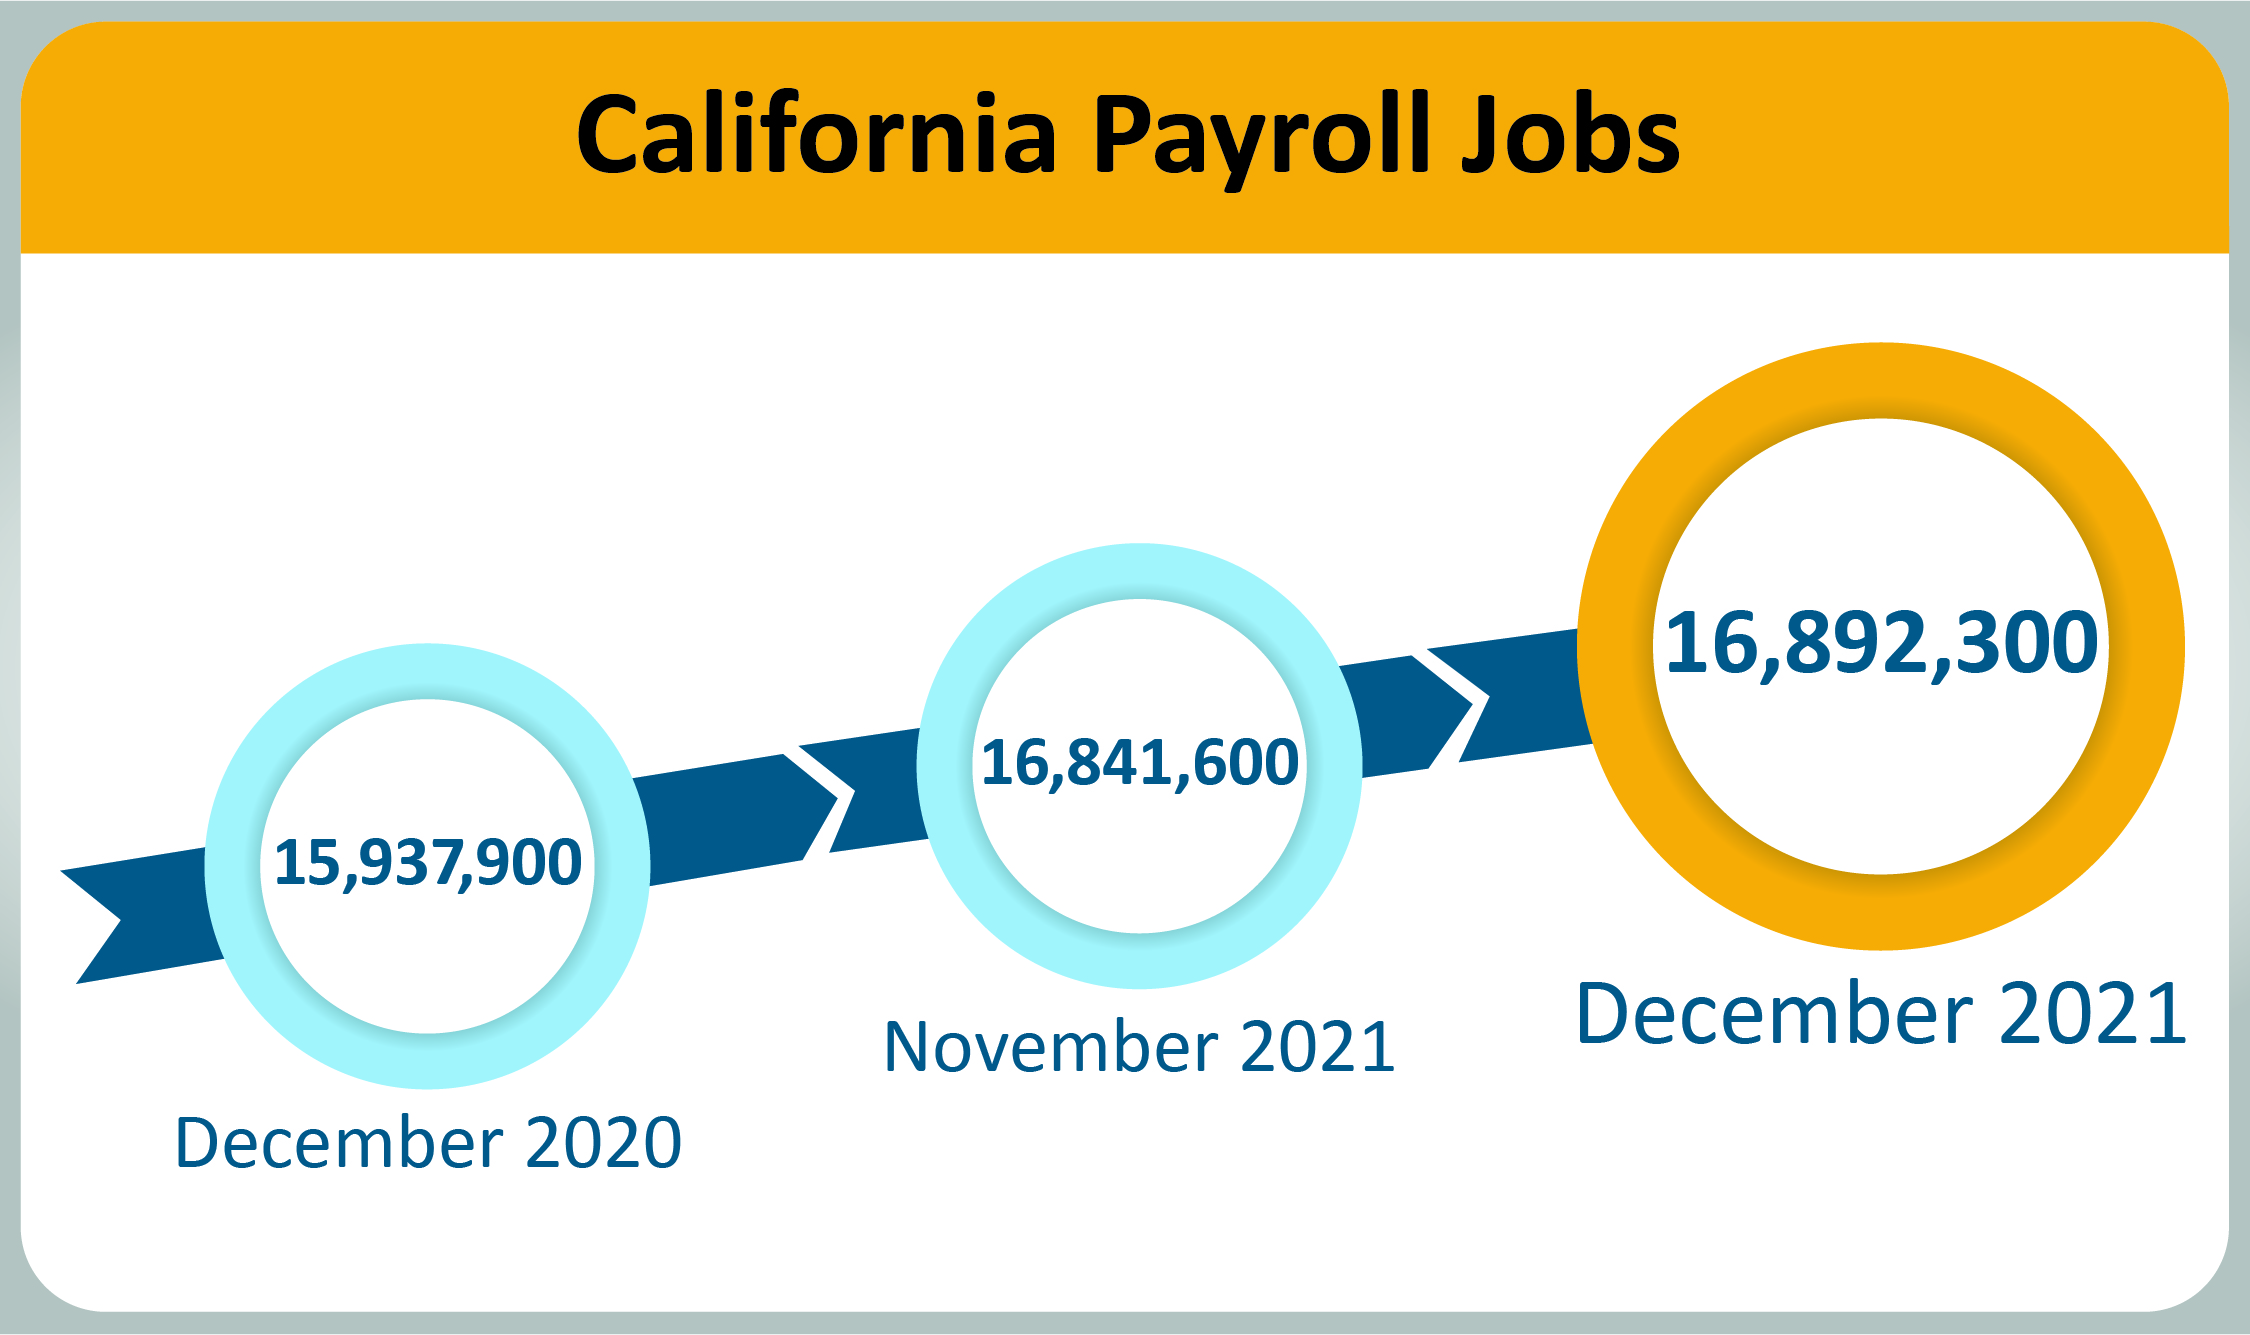
- Month-over – Total nonfarm jobs in California’s 11 major industries totaled 16,892,300 in December – a net gain of 50,700 jobs from November 2021. This followed an upward revised (+6,500) month-over gain of 52,200 jobs in November.
- Year-over – Total nonfarm jobs increased by 954,400 (a 6.0 percent increase) from December 2020 to December 2021 compared to the U.S. annual gain of 6,448,000 jobs (a 4.5 percent increase).
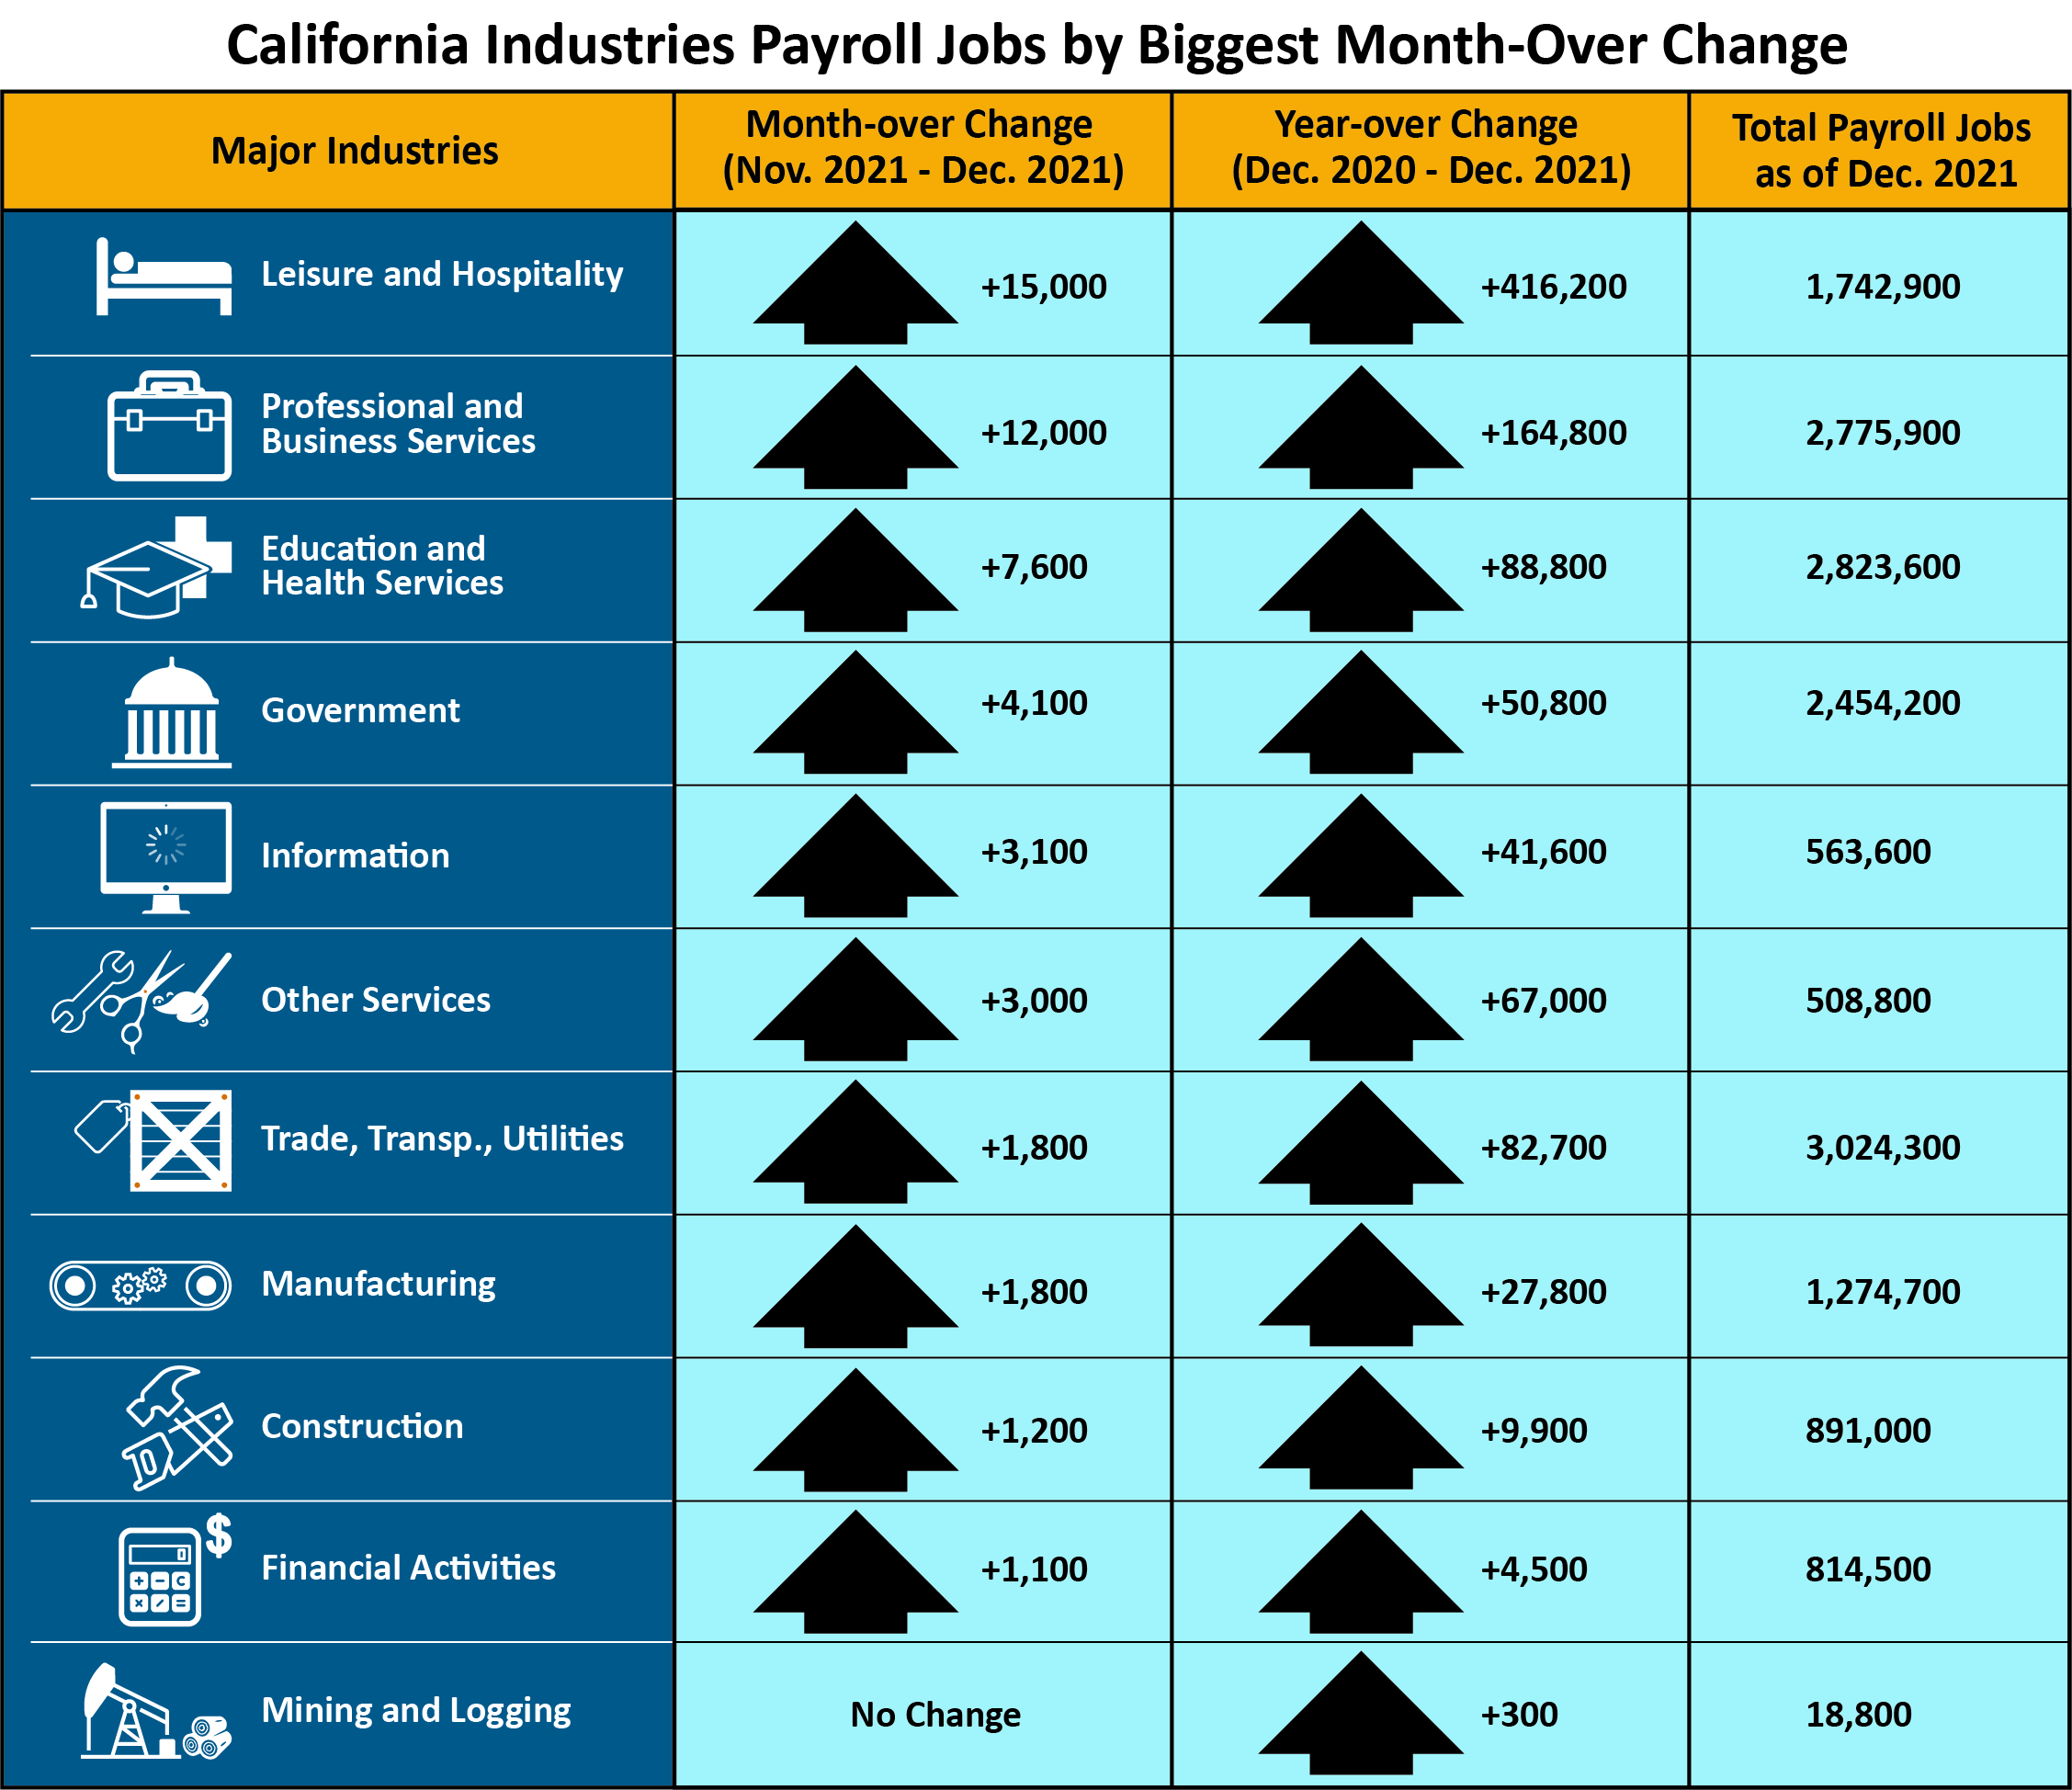
| Major Industries | Month-over Change (Nov. 2021–Dec. 2021) | Year-over Change (Dec. 2020–Dec. 2021) | Total Payroll Jobs as of Dec. 2021 |
|---|---|---|---|
| Leisure and Hospitality | +15,000 | +416,200 | 1,742,900 |
| Professional and Business Services | +12,000 | +164,800 | 2,775,900 |
| Education and Health Services | +7,600 | +88,800 | 2,823,600 |
| Government | +4,100 | +50,800 | 2,454,200 |
| Information | +3,100 | +41,600 | 563,600 |
| Other Services | +3,000 | +67,000 | 508,800 |
| Trade, Transportation, Utilities | +1,800 | +82,700 | 3,024,300 |
| Manufacturing | +1,800 | +27,800 | 1,274,700 |
| Construction | +1,200 | +9,900 | 891,000 |
| Financial Activities | +1,100 | +4,500 | 814,500 |
| Mining and Logging | No Change | +300 | 18,800 |
Total Farm jobs – The number of jobs in the agriculture industry decreased by 4,200 from November 2021 to 429,300 jobs in December. The agricultural industry has 11,100 more farm jobs in December 2021 than it did in December a year ago.
Data Trends about Workers in the Economy
Employment and Unemployment in California
This information is based on a monthly federal survey of 5,100 California households which focuses on workers in the economy.
- Employed – The number of Californians employed in December was 17,836,800, an increase of 116,900 persons from November’s total of 17,719,900, and up 879,800 from the employment total in December 2020.
- Unemployed – The number of unemployed Californians was 1,238,000 in December, a decrease of 86,800 over the month and down 510,500 in comparison to December 2020.
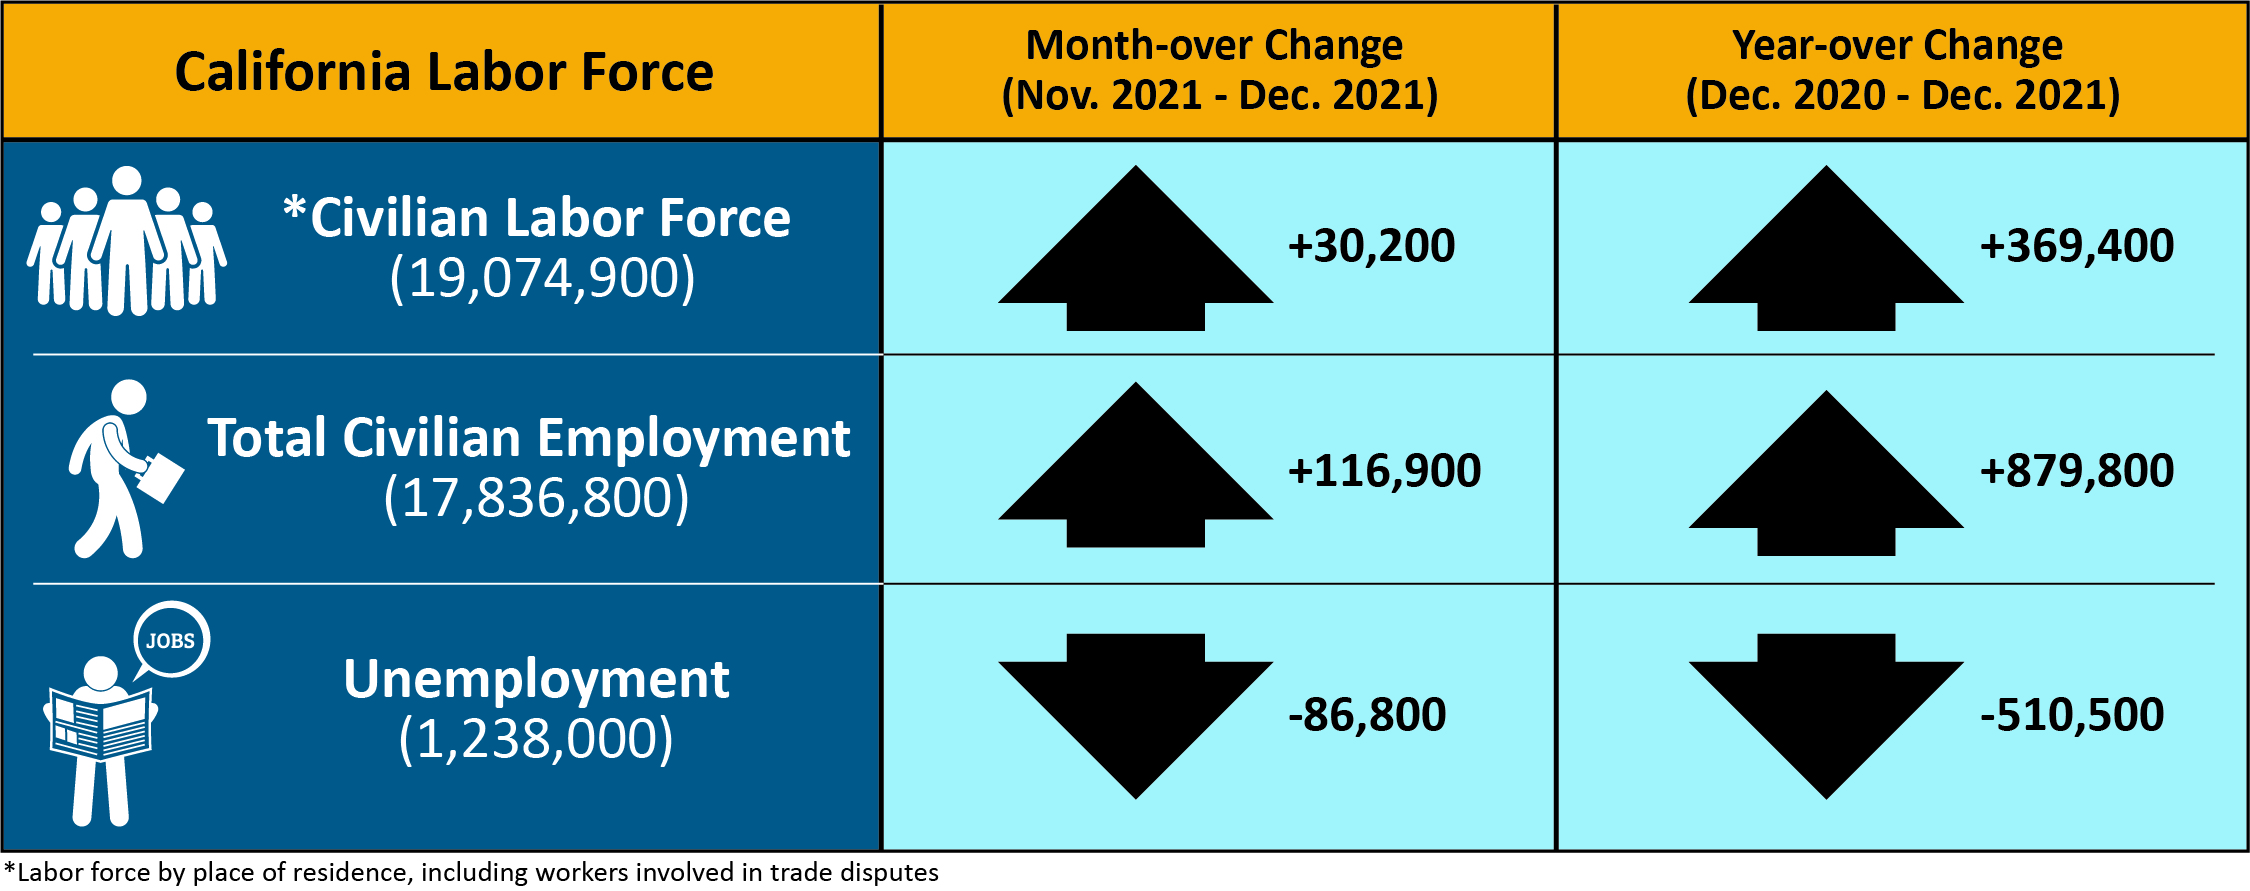
| California Labor Force | Month-over Change (Nov. 2021–Dec. 2021) | Year-over Change (Dec. 2020–Dec. 2021) |
|---|---|---|
| * Civilian Labor Force (19,074,900) | +30,200 | +369,400 |
| Total Civilian Employment (17,836,800) | +116,900 | +879,800 |
| Unemployment (1,238,000) | -86,800 | -510,500 |
* Labor force by place of residence, including workers involved in trade disputes.
Unemployment Insurance Claims (Not Seasonally Adjusted)
The following data is from a sample week that includes the 19th of each month:
In related data that figures into the state’s unemployment rate, there were 355,749 people certifying for Unemployment Insurance benefits during the December 2021 sample week. That compares to 434,676 people in November and 1,007,331 people in December 2020. Concurrently, 49,071 initial claims were processed in the December 2021 sample week, which was a month-over decrease of 3,645 claims from November and a year-over decrease of 110,021 claims from December 2020.
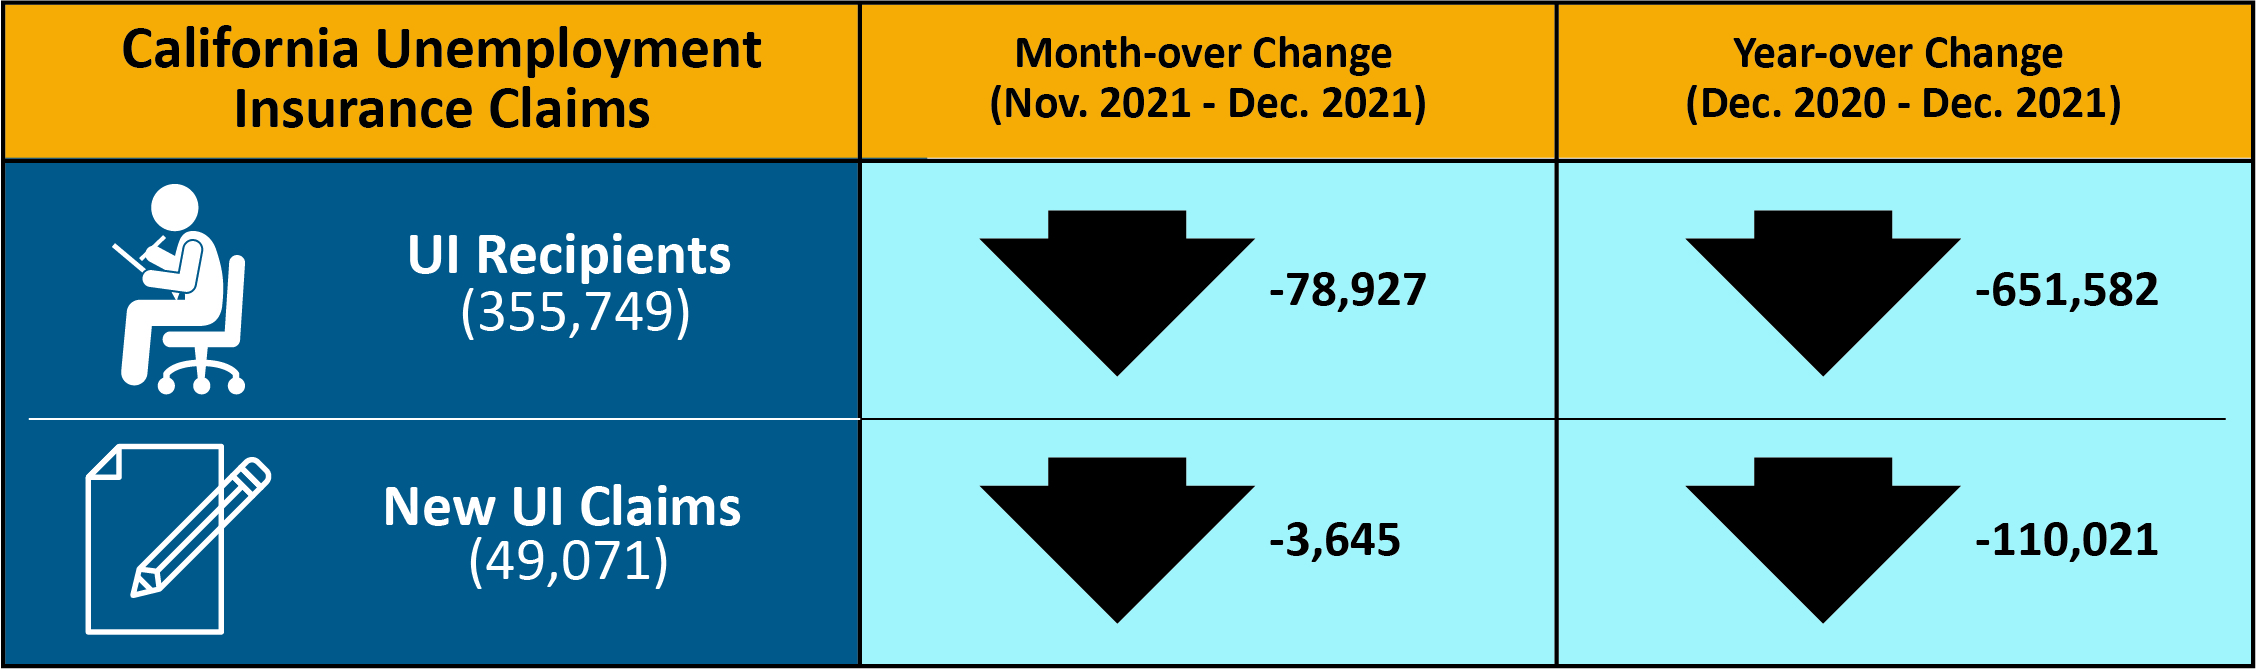
| California Unemployment Insurance Claims | Month-over Change (Nov. 2021–Dec. 2021) | Year-over Change (Dec. 2020–Dec. 2021) |
|---|---|---|
| UI Recipients (355,749) | -78,927 | -651,582 |
| New UI Claims (49,071) | -3,645 | -110,021 |
| COUNTY | LABOR FORCE | EMPLOYMENT | UNEMPLOYMENT | RATE |
|---|---|---|---|---|
| STATE TOTAL | 19,065,800 | 18,105,400 | 960,400 | 5.0% |
| ALAMEDA | 814,700 | 782,800 | 31,900 | 3.9% |
| ALPINE | 570 | 530 | 30 | 5.7% |
| AMADOR | 14,470 | 13,750 | 710 | 4.9% |
| BUTTE | 93,300 | 88,800 | 4,500 | 4.8% |
| CALAVERAS | 21,580 | 20,740 | 840 | 3.9% |
| COLUSA | 10,320 | 9,090 | 1,220 | 11.9% |
| CONTRA COSTA | 543,000 | 520,000 | 22,900 | 4.2% |
| DEL NORTE | 9,230 | 8,740 | 490 | 5.3% |
| EL DORADO | 91,700 | 88,100 | 3,600 | 3.9% |
| FRESNO | 447,800 | 416,500 | 31,300 | 7.0% |
| GLENN | 12,590 | 11,940 | 650 | 5.2% |
| HUMBOLDT | 60,200 | 57,700 | 2,500 | 4.1% |
| IMPERIAL | 67,600 | 57,700 | 9,900 | 14.7% |
| INYO | 8,200 | 7,860 | 340 | 4.1% |
| KERN | 378,200 | 349,200 | 29,000 | 7.7% |
| KINGS | 56,300 | 52,100 | 4,200 | 7.5% |
| LAKE | 28,270 | 26,650 | 1,620 | 5.7% |
| LASSEN | 9,480 | 9,090 | 390 | 4.1% |
| LOS ANGELES | 5,018,500 | 4,705,400 | 313,100 | 6.2% |
| MADERA | 62,200 | 58,100 | 4,200 | 6.7% |
| MARIN | 133,700 | 130,100 | 3,600 | 2.7% |
| MARIPOSA | 6,950 | 6,570 | 390 | 5.5% |
| MENDOCINO | 36,090 | 34,440 | 1,650 | 4.6% |
| MERCED | 114,600 | 105,200 | 9,400 | 8.2% |
| MODOC | 3,260 | 3,090 | 170 | 5.1% |
| MONO | 8,960 | 8,570 | 390 | 4.4% |
| MONTEREY | 208,400 | 193,500 | 14,900 | 7.2% |
| NAPA | 67,000 | 64,200 | 2,800 | 4.1% |
| NEVADA | 47,960 | 46,190 | 1,770 | 3.7% |
| ORANGE | 1,591,600 | 1,532,100 | 59,500 | 3.7% |
| PLACER | 187,500 | 181,400 | 6,100 | 3.3% |
| PLUMAS | 6,930 | 6,380 | 550 | 7.9% |
| RIVERSIDE | 1,129,100 | 1,071,600 | 57,500 | 5.1% |
| SACRAMENTO | 713,300 | 679,200 | 34,000 | 4.8% |
| SAN BENITO | 31,500 | 29,700 | 1,800 | 5.7% |
| SAN BERNARDINO | 992,100 | 940,800 | 51,300 | 5.2% |
| SAN DIEGO | 1,554,500 | 1,488,800 | 65,800 | 4.2% |
| SAN FRANCISCO | 566,600 | 549,400 | 17,200 | 3.0% |
| SAN JOAQUIN | 329,600 | 308,300 | 21,300 | 6.4% |
| SAN LUIS OBISPO | 129,800 | 125,300 | 4,500 | 3.5% |
| SAN MATEO | 445,500 | 433,100 | 12,500 | 2.8% |
| SANTA BARBARA | 216,600 | 208,000 | 8,600 | 4.0% |
| SANTA CLARA | 1,042,900 | 1,012,800 | 30,100 | 2.9% |
| SANTA CRUZ | 131,100 | 124,000 | 7,100 | 5.4% |
| SHASTA | 74,300 | 70,700 | 3,600 | 4.8% |
| SIERRA | 1,340 | 1,290 | 50 | 4.0% |
| SISKIYOU | 16,350 | 15,300 | 1,050 | 6.4% |
| SOLANO | 203,100 | 192,600 | 10,500 | 5.2% |
| SONOMA | 246,300 | 237,800 | 8,600 | 3.5% |
| STANISLAUS | 239,800 | 225,200 | 14,600 | 6.1% |
| SUTTER | 45,300 | 42,100 | 3,200 | 7.1% |
| TEHAMA | 25,390 | 24,100 | 1,290 | 5.1% |
| TRINITY | 4,430 | 4,230 | 200 | 4.6% |
| TULARE | 197,000 | 180,400 | 16,600 | 8.4% |
| TUOLUMNE | 19,600 | 18,580 | 1,020 | 5.2% |
| VENTURA | 411,900 | 394,600 | 17,300 | 4.2% |
| YOLO | 106,800 | 102,300 | 4,500 | 4.2% |
| YUBA | 30,300 | 28,400 | 1,900 | 6.2% |