Nonfarm Jobs Decreased by 4,500
Important Note: The employment data for the month of September 2025 comes from the survey week that included September 12. Due to impacts of the federal government shutdown, available data for October and November 2025 are tentatively scheduled to be released January 7, 2026.
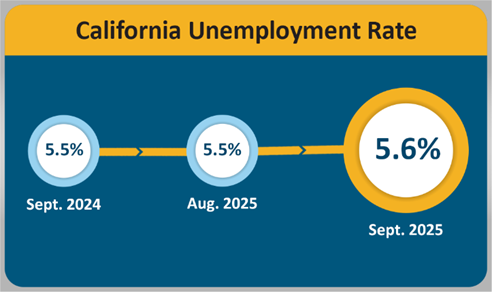
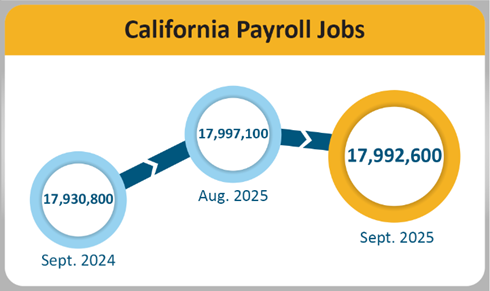
SACRAMENTO — California’s unemployment rate changed little to 5.6 percent1 and California’s nonfarm payroll jobs2 decreased by 4,500 in September 2025, according to the latest Employment Development Department (EDD) data that comes from two separate surveys. September’s job loss follows a downward revision (-14,100) for August 2025, resulting in a nonfarm job loss of 10,300 for the month.
California's Labor Market, by the Numbers...
- California’s unemployment rate remains more stable over the year than the national rate, which has risen each of the last three months and is up 0.3 percentage point over the year.
- The State’s unemployment rate edged up by 0.1 percentage point from August to September, matching the national change.
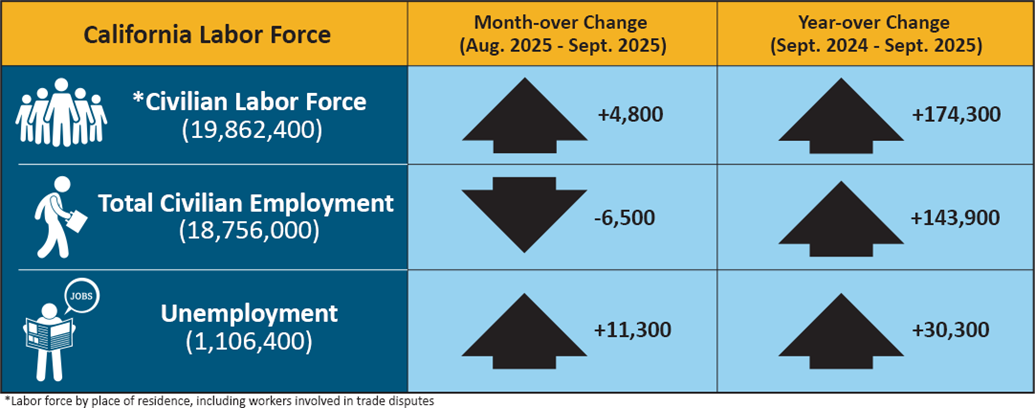
- The number of unemployed workers in California has increased for the sixth straight month. Year-over, the number of unemployed has increased by 30,300.
- Five of California's 11 industry sectors gained jobs in September, led by Private Education and Health Services (+13,100) which marked its 44th consecutive month of gains with increases in Offices of Dentists (+1,000) and Other Health Practitioners (+1,300) as well as with Individual and Family Services (+5,800) as California’s population continues to age.
- Leisure & Hospitality (+5,600) once again posted a month-over job gain with the most increases occurring in Performing Arts, Spectator Sports, and Related Activities (+1,300) as well as with Gambling Industries (+200) and Special Food Services (+1,600). The gains came despite above-average losses reported in Accommodation (-4,700) and Restaurants and Other Eating Places (-7,500).
- Professional & Business Services (-10,400) posted the State’s largest month-over loss due, in part, to above-average declines in Legal Services (-2,600), Accounting, Tax Prep, Bookkeeping, and Payroll Services (-3,100), Scientific Research and Development (-5,900), and Advertising, Public Relations, and Related Services (-2,000).
1. The unemployment rate comes from a separate federal survey of 4,400 California households.
2. The nonfarm payroll job numbers come from a federal survey of 80,000 California businesses.
Data Trends about Jobs in the Economy
Total Nonfarm Payroll Jobs (Comes from a monthly survey of approximately 80,000 California businesses that estimates jobs in the economy – seasonally adjusted)
- Month-over —Total nonfarm jobs in California’s 11 major industries amounted to 17,992,600 in September – a loss of 4,500 from August. This followed August’s downward revision of 14,100 jobs, resulting in a month-over August loss of 10,300 jobs.
- Year-over — Total nonfarm jobs increased by 61,800 (0.3 percent increase) from September 2024 to September 2025 compared to the U.S. annual gains of 1,312,000 jobs (a 0.8 percent increase).
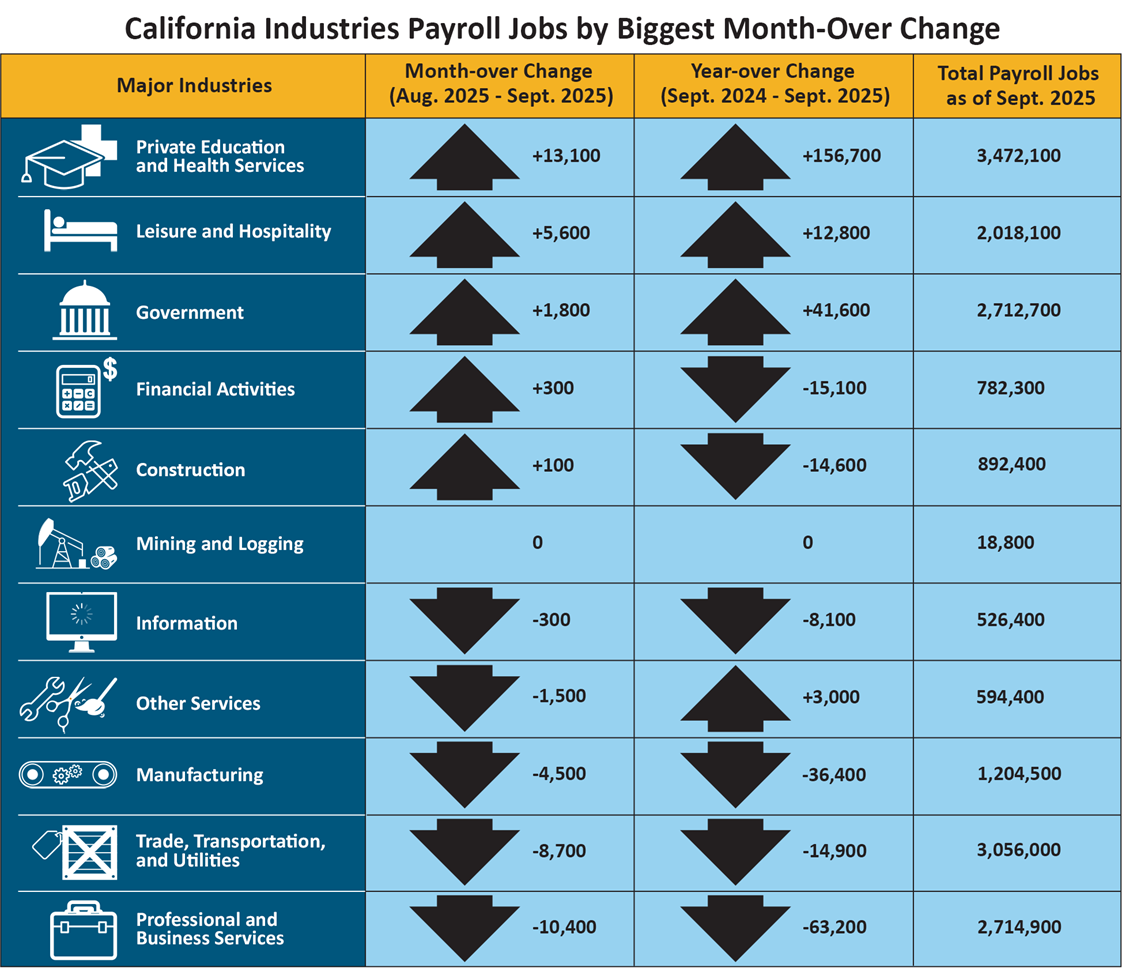
| Major Industries | Month-over Change August 2025 - September 2025) |
Year-over Change (September 2024 - September 2025) |
Total Payroll Jobs as of September 2025 |
|---|---|---|---|
| Private Education and Health Services | +13,100 | +156,700 | 3,472,100 |
|
Leisure and Hospitality |
+5,600 | +12,800 | 2,018,100 |
|
Government |
+1,800 | +41,600 | 2,712,700 |
|
Financial Activities |
+300 | -15,100 | 782,300 |
|
Construction |
+100 | -14,600 | 892,400 |
|
Mining and Logging |
0 | 0 | 18,800 |
|
Information |
-300 | -8,100 | 526,400 |
| Other Services | -1,500 | +3,000 | 594,400 |
|
Manufacturing |
-4,500 | -36,400 | 1,204,500 |
| Trade, Transportation, and Utilities | -8,700 | -14,900 | 3,056,000 |
| Professional and Business Services | -10,400 | -63,200 | 2,714,900 |
Total Farm Jobs — The number of jobs in the agriculture industry decreased from August by 9,100 to a total of 410,500 jobs in September as California’s typical harvest season winds down. The agriculture industry had 900 fewer farm jobs in September 2025 than it did in September of last year.
Data Trends about Workers in the Economy
Employment and Unemployment in California (Based on a monthly federal survey of 4,400 California households which focuses on workers in the economy)
- Employed — The number of Californians employed in September was 18,756,000, a loss of 6,500 persons from August’s total of 18,762,500 but up 143,900 from the employment total in September 2024.
- Unemployed — The number of unemployed Californians was 1,106,400 in September, an increase of 11,300 over the month and up 30,300 in comparison to September 2024.
| California Labor Force | Month-over Change (August 2025 – September 2025) | Year-over Change (September 2024 – September 2025) |
|---|---|---|
| * Civilian Labor Force (19,862,400) | +4,800 | +174,300 |
| Total Civilian Employment (18,756,000) | -6,500 | +143,900 |
| Unemployment (1,106,400) | +11,300 | +30,300 |
* Labor force by place of residence, including workers involved in trade disputes.
Unemployment Insurance Claims (Not Seasonally Adjusted)
The following data is from a sample week that includes the 19th of each month:
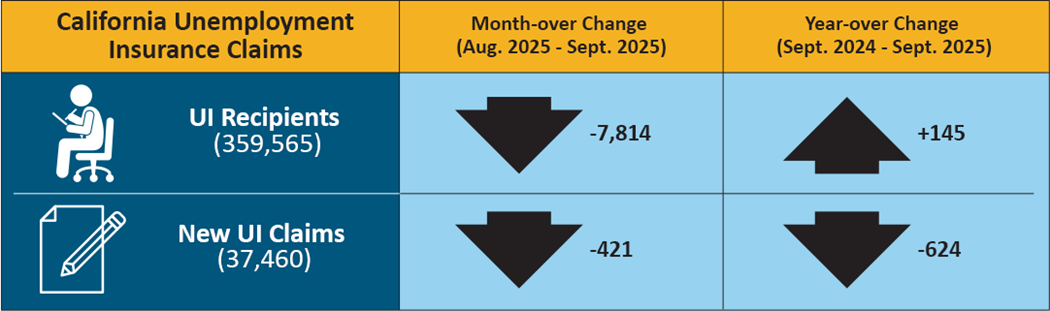
In related data that figures into the State’s unemployment rate, there were 359,565 people certifying for Unemployment Insurance (UI) benefits during the September 2025 sample week. That compares to 367,379 people in August and 359,420 people in September 2024. Concurrently, 37,460 initial claims were processed in the September 2025 sample week, which was a month-over decrease of 421 claims from August and a year-over decrease of 624 claims from September 2024.
| California Unemployment Insurance Claims | Month-over Change (August 2025 – September 2025) | Year-over Change (September 2024 – September 2025) |
|---|---|---|
| UI Recipients (359,565) | -7,814 | +145 |
| New UI Claims (37,460) | -421 | -624 |
| COUNTY | LABOR FORCE | EMPLOYMENT | UNEMPLOYMENT | RATE |
|---|---|---|---|---|
| STATE TOTAL |
19,983,500 |
18,870,400 |
1,113,000 |
5.6% |
| ALAMEDA |
874,800 |
831,800 |
43,000 |
4.9% |
| ALPINE |
380 |
350 |
40 |
9.2% |
| AMADOR |
15,370 |
14,460 |
910 |
5.9% |
| BUTTE |
94,500 |
88,800 |
5,600 |
5.9% |
| CALAVERAS |
17,840 |
16,700 |
1,140 |
6.4% |
| COLUSA |
11,800 |
10,790 |
1,010 |
8.5% |
| CONTRA COSTA |
587,800 |
558,300 |
29,500 |
5.0% |
| DEL NORTE |
9,020 |
8,450 |
570 |
6.3% |
| EL DORADO |
91,800 |
87,100 |
4,600 |
5.0% |
| FRESNO |
482,700 |
446,400 |
36,300 |
7.5% |
| GLENN |
12,160 |
11,350 |
810 |
6.7% |
| HUMBOLDT |
60,900 |
57,700 |
3,200 |
5.3% |
| IMPERIAL |
77,100 |
60,500 |
16,500 |
21.5% |
| INYO |
8,580 |
8,190 |
390 |
4.6% |
| KERN |
423,900 |
389,800 |
34,100 |
8.1% |
| KINGS |
59,500 |
54,500 |
5,000 |
8.4% |
| LAKE |
27,040 |
25,140 |
1,900 |
7.0% |
| LASSEN |
8,810 |
8,310 |
500 |
5.7% |
| LOS ANGELES |
5,143,000 |
4,840,500 |
302,500 |
5.9% |
| MADERA |
71,700 |
66,700 |
5,000 |
7.0% |
| MARIN |
126,800 |
121,200 |
5,700 |
4.5% |
| MARIPOSA |
7,730 |
7,330 |
400 |
5.2% |
| MENDOCINO |
38,080 |
36,000 |
2,080 |
5.5% |
| MERCED |
125,200 |
114,600 |
10,600 |
8.5% |
| MODOC |
3,300 |
3,110 |
190 |
5.7% |
| MONO |
8,440 |
8,070 |
370 |
4.4% |
| MONTEREY |
233,800 |
221,100 |
12,700 |
5.4% |
| NAPA |
78,600 |
75,400 |
3,200 |
4.1% |
| NEVADA |
47,650 |
45,260 |
2,390 |
5.0% |
| ORANGE |
1,654,200 |
1,581,400 |
72,800 |
4.4% |
| PLACER |
208,600 |
199,100 |
9,500 |
4.5% |
| PLUMAS |
8,050 |
7,590 |
460 |
5.7% |
| RIVERSIDE |
1,209,600 |
1,136,000 |
73,600 |
6.1% |
| SACRAMENTO |
791,100 |
749,100 |
42,000 |
5.3% |
| SAN BENITO |
34,600 |
32,600 |
2,100 |
5.9% |
| SAN BERNARDINO |
1,051,700 |
991,700 |
59,900 |
5.7% |
| SAN DIEGO |
1,683,500 |
1,601,200 |
82,300 |
4.9% |
| SAN FRANCISCO |
515,300 |
493,800 |
21,500 |
4.2% |
| SAN JOAQUIN |
378,600 |
353,900 |
24,700 |
6.5% |
| SAN LUIS OBISPO |
133,900 |
127,500 |
6,400 |
4.8% |
| SAN MATEO |
421,900 |
404,900 |
17,000 |
4.0% |
| SANTA BARBARA |
228,600 |
218,200 |
10,400 |
4.5% |
| SANTA CLARA |
1,036,800 |
990,200 |
46,500 |
4.5% |
| SANTA CRUZ |
139,800 |
132,300 |
7,500 |
5.4% |
| SHASTA |
80,600 |
76,300 |
4,400 |
5.4% |
| SIERRA |
1,510 |
1,440 |
70 |
4.6% |
| SISKIYOU |
17,340 |
16,230 |
1,100 |
6.4% |
| SOLANO |
218,700 |
206,600 |
12,200 |
5.6% |
| SONOMA |
251,900 |
240,400 |
11,500 |
4.6% |
| STANISLAUS |
264,000 |
246,500 |
17,500 |
6.6% |
| SUTTER |
47,400 |
43,900 |
3,400 |
7.2% |
| TEHAMA |
28,010 |
26,300 |
1,710 |
6.1% |
| TRINITY |
5,680 |
5,360 |
320 |
5.6% |
| TULARE |
225,600 |
203,600 |
22,000 |
9.8% |
| TUOLUMNE |
22,680 |
21,460 |
1,220 |
5.4% |
| VENTURA |
425,500 |
403,600 |
21,900 |
5.1% |
| YOLO |
113,100 |
106,900 |
6,300 |
5.6% |
| YUBA |
36,800 |
34,300 |
2,500 |
6.7% |