State’s Unemployment Rate Edged Down to 5.5%
Important Note: The employment data for the month of November 2025 comes from the survey week that included November 12. The release date for December 2025 data has not yet been finalized as the Department awaits access to data from the U.S. Department of Labor’s Bureau of Labor Statistics.
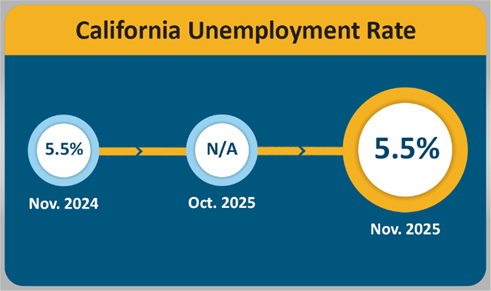
SACRAMENTO — California’s unemployment rate improved to 5.5 percent1 in November 2025 from the 5.6% rate in September. In addition, the State’s employers added 32,500 nonfarm payroll jobs2. These recent data points released by the Employment Development Department (EDD) come from two separate surveys. November’s gain follows an October month-over gain of 1,500 nonfarm jobs. Total nonfarm employment for September was revised down (-1,700) to a total loss of 6,200 jobs. Due to impacts of the recent federal government shutdown, there is limited employment data for the month of October, including the inability to determine an unemployment rate for the month.
California's Labor Market, by the Numbers...
- The State's unemployment rate declined by 0.1 percentage point since September, while the nation's rate increased by 0.2 percentage point.
- Year-over, California’s unemployment rate remains stable, whereas the national unemployment rate has risen 0.4 percentage point since November 2024.
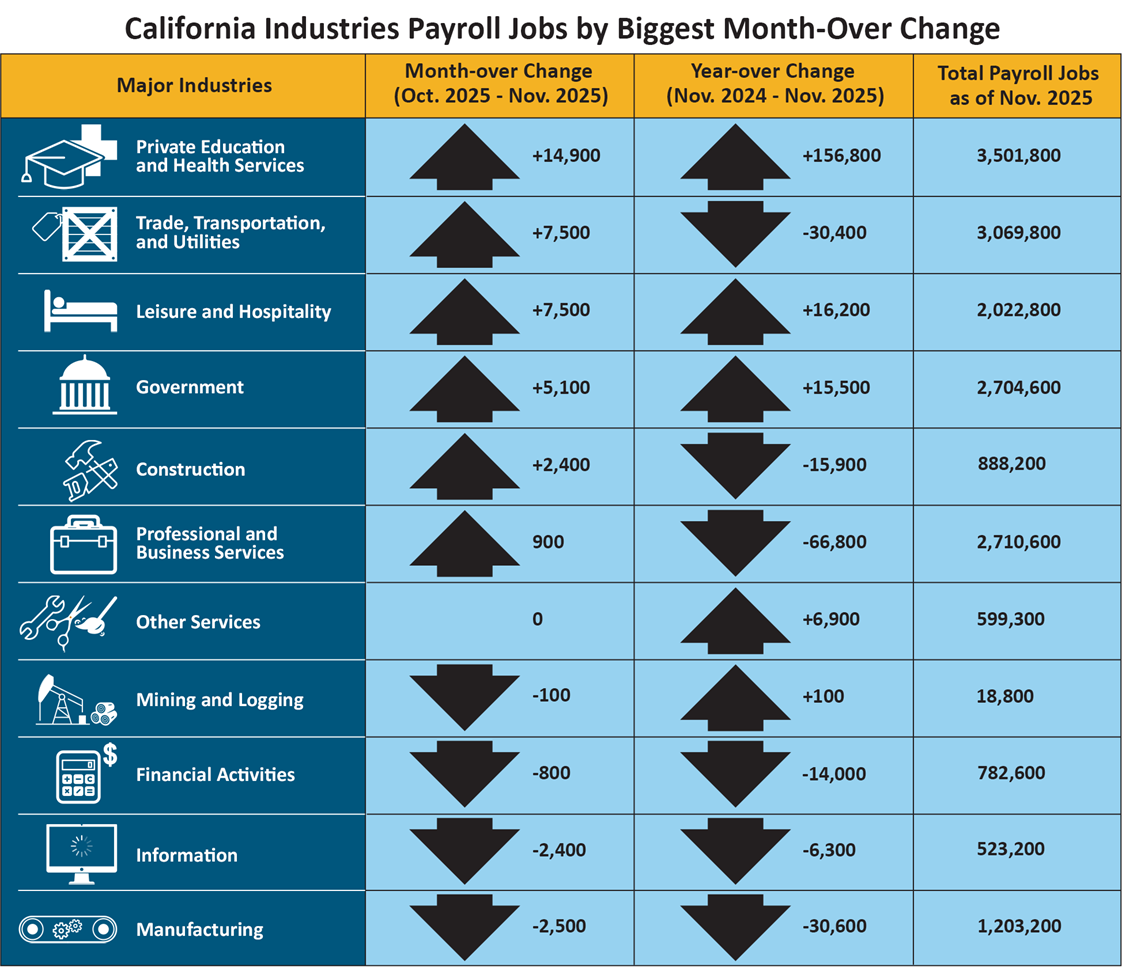
- Six of California's 11 industry sectors gained jobs in November, with Private Education and Health Services (+14,900) showing gains for the 46th consecutive month as California’s population continues to age. The overall industry saw above average gains in health-related fields such as Outpatient Care Centers (+2,800), Offices of Dentists (+2,300), Skilled Nursing Facilities (+1,200).
- Trade, Transportation, and Utilities (+7,500) experienced gains thanks to additions in Couriers and Messengers (+16,300), Warehousing and Storage (+13,900), and Professional and Commercial Equipment and Supplies Merchant Wholesalers (+500) as the holiday season approached.
- Manufacturing (-2,500) saw the largest month-over decline in jobs due, in part, to federal import tariffs affecting business operations. Leading the way were above average losses in Computer and Electronic Product Manufacturing (-1,000), Transportation Equipment Manufacturing (-400), and Plastics and Rubber Products Manufacturing (-400).
1. The unemployment rate comes from a separate federal survey of 4,400 California households.
2. The nonfarm payroll job numbers come from a federal survey of 80,000 California businesses.
Data Trends about Jobs in the Economy
Total Nonfarm Payroll Jobs (Comes from a monthly survey of approximately 80,000 California businesses that estimates jobs in the economy – seasonally adjusted)
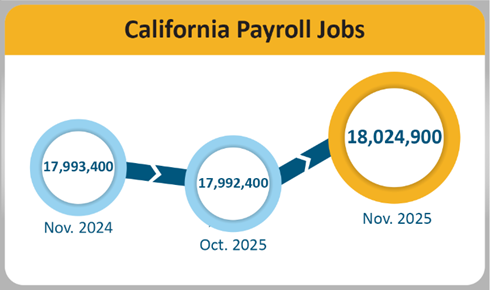
- Month-over —Total nonfarm jobs in California’s 11 major industries amounted to 18,024,900 in November – a gain of 32,500 from October. This followed September’s downward revision of 1,700 jobs, resulting in a month-over September loss of 6,200 jobs.
- Year-over — Total nonfarm jobs increased by 31,500 (0.2 percent increase) from November 2024 to November 2025 compared to the U.S. year-over gain of 933,000 jobs (a 0.6 percent increase).
| Major Industries | Month-over Change (Oct. 2025 - Nov. 2025) |
Year-over Change (Nov. 2024 - Nov. 2025) |
Total Payroll Jobs as of Nov. 2025 |
|---|---|---|---|
|
Private Education and Health Services |
+14,900 | +156,800 | 3,501,800 |
|
Trade, Transportation, and Utilities |
+7,500 | -30,400 | 3,069,800 |
| Leisure and Hospitality | +7,500 | +16,200 | 2,022,800 |
|
Government |
+5,100 | +15,500 | 2,704,600 |
|
Construction |
+2,400 | -15,900 | 888,200 |
|
Professional and Business Services |
900 | -66,800 | 2,710,600 |
|
Other Services |
0 | +6,900 | 599,300 |
| Mining and Logging | -100 | +100 | 18,800 |
|
Financial Activities |
-800 | -14,000 | 782,600 |
| Information | -2,400 | -6,300 | 523,200 |
| Manufacturing | -2,500 | -30,600 | 1,203,200 |
| Major Industries | Month-over Change (Sept. 2025 - Oct. 2025) |
Year-over Change (Oct. 2024 - Oct. 2025) |
Total Payroll Jobs as of Oct. 2025 |
|---|---|---|---|
|
Private Education and Health Services |
+13,100 | +156,700 | 3,472,100 |
|
Leisure and Hospitality |
+5,600 | +12,800 | 2,018,100 |
| Government | +1,800 | +41,600 | 2,712,700 |
|
Financial Activities |
+300 | -15,100 | 782,300 |
|
Construction |
+100 | -14,600 | 892,400 |
|
Mining and Logging |
0 | 0 | 18,800 |
|
Information |
-300 | -8,100 | 562,400 |
| Other Services | -1,500 | +3,000 | 594,400 |
|
Manufacturing |
-4,500 | -36,400 | 1,204,500 |
| Trade, Transportation, and Utilities | -8,700 | -14,900 | 3,056,000 |
| Professional and Business Services | -10,400 | -63,200 | 2,714,900 |
Total Farm Jobs — The number of jobs in the agriculture industry increased from October by 7,800 to a total of 417,700 jobs in November. The agriculture industry had 1,000 more farm jobs in November 2025 than it did in November of last year.
Data Trends about Workers in the Economy
Employment and Unemployment in California (Based on a monthly federal survey of 4,400 California households which focuses on workers in the economy)
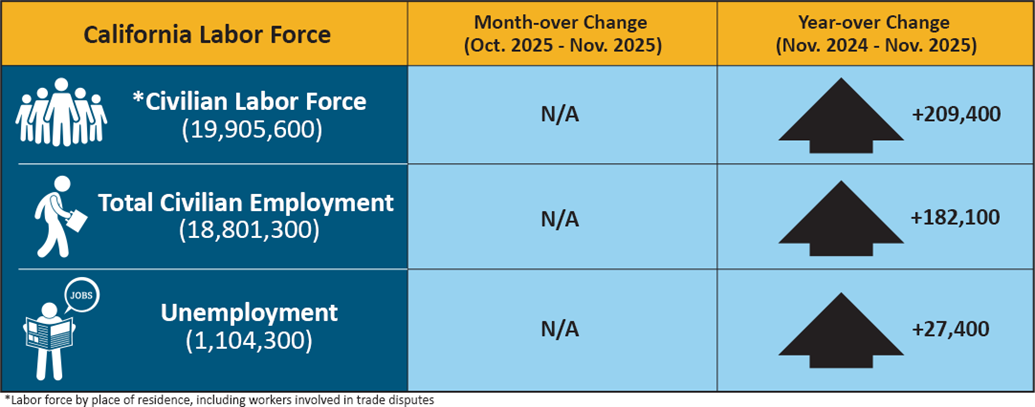
- Employed — The number of Californians employed in November was 18,801,300, up 182,100 compared to November of last year. Due to the recent federal shutdown, there is no available data for October 2025.
- Unemployed — The number of unemployed Californians was 1,104,300 in November, an increase of 27,400 from November of last year. Due to the recent federal shutdown, there is no available data for October 2025.
| California Labor Force | Month-over Change (October 2025 – November 2025) | Year-over Change (November 2024 – November 2025) |
|---|---|---|
| * Civilian Labor Force (19,905,600) | N/A | +209,400 |
| Total Civilian Employment (18,801,300) | N/A | +182,100 |
| Unemployment (1,104,300) | N/A | +27,400 |
* Labor force by place of residence, including workers involved in trade disputes.
Unemployment Insurance Claims (Not Seasonally Adjusted)
The following data is from a sample week that includes the 19th of each month:
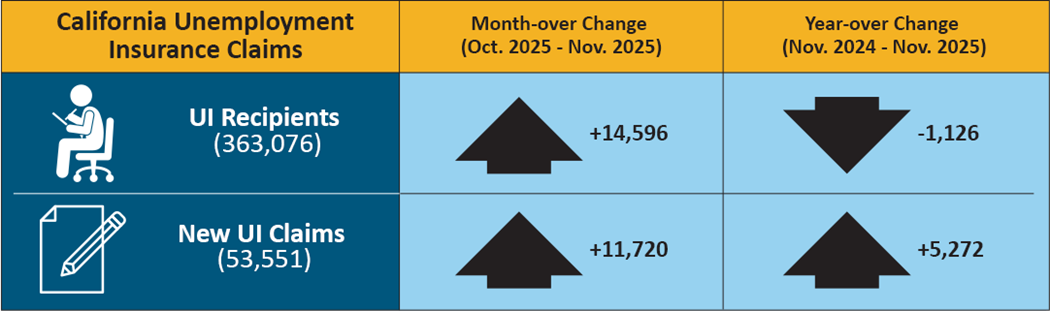
In related data that figures into the State’s unemployment rate, there were 363,076 people certifying for Unemployment Insurance (UI) benefits during the November 2025 sample week. That compares to 348,480 people in October and 364,202 people in November 2024. Concurrently, 53,551 initial claims were processed in the November 2025 sample week, which was a month-over increase of 11,720 claims from October and a year-over increase of 5,272 claims from November 2024.
| California Unemployment Insurance Claims | Month-over Change (October 2025 – November 2025) | Year-over Change (November 2024 – November 2025) |
|---|---|---|
| UI Recipients (363,076) | +14,596 | -1,126 |
| New UI Claims (53,551) | +11,720 | +5,272 |
| California Unemployment Insurance Claims | Month-over Change (September. 2025 – October 2025) | Year-over Change (October 2024 – October 2025) |
|---|---|---|
| UI Recipients (348,480) | -11,085 | +4,892 |
| New UI Claims (41,831) | +4,372 | +1,000 |
| COUNTY | LABOR FORCE | EMPLOYMENT | UNEMPLOYMENT | RATE |
|---|---|---|---|---|
| STATE TOTAL |
20,037,500 |
18,957,600 |
1,080,000 |
5.4% |
| ALAMEDA |
874,100 |
833,600 |
40,500 |
4.6% |
| ALPINE |
400 |
360 |
40 |
9.2% |
| AMADOR |
15,280 |
14,370 |
910 |
5.9% |
| BUTTE |
94,500 |
89,000 |
5,500 |
5.8% |
| CALAVERAS |
17,730 |
16,610 |
1,120 |
6.3% |
| COLUSA |
11,590 |
10,240 |
1,350 |
11.6% |
| CONTRA COSTA |
588,000 |
559,900 |
28,100 |
4.8% |
| DEL NORTE |
8,920 |
8,340 |
590 |
6.6% |
| EL DORADO |
91,900 |
87,400 |
4,600 |
5.0% |
| FRESNO |
478,500 |
439,400 |
39,100 |
8.2% |
| GLENN |
11,980 |
11,160 |
810 |
6.8% |
| HUMBOLDT |
61,000 |
57,900 |
3,100 |
5.1% |
| IMPERIAL |
76,500 |
61,200 |
15,300 |
20.0% |
| INYO |
8,400 |
8,010 |
390 |
4.6% |
| KERN |
423,400 |
390,200 |
33,200 |
7.8% |
| KINGS |
59,600 |
54,300 |
5,200 |
8.8% |
| LAKE |
26,320 |
24,340 |
1,970 |
7.5% |
| LASSEN |
8,550 |
8,050 |
510 |
5.9% |
| LOS ANGELES |
5,208,600 |
4,912,700 |
295,800 |
5.7% |
| MADERA |
70,000 |
64,700 |
5,300 |
7.6% |
| MARIN |
127,400 |
122,000 |
5,300 |
4.2% |
| MARIPOSA |
7,540 |
7,130 |
410 |
5.5% |
| MENDOCINO |
37,290 |
35,150 |
2,140 |
5.7% |
| MERCED |
124,200 |
113,100 |
11,100 |
8.9% |
| MODOC |
3,230 |
3,020 |
210 |
6.5% |
| MONO |
7,820 |
7,430 |
390 |
5.0% |
| MONTEREY |
224,200 |
209,500 |
14,800 |
6.6% |
| NAPA |
76,400 |
73,200 |
3,200 |
4.2% |
| NEVADA |
47,660 |
45,360 |
2,310 |
4.8% |
| ORANGE |
1,655,000 |
1,586,500 |
68,400 |
4.1% |
| PLACER |
208,600 |
199,500 |
9,100 |
4.4% |
| PLUMAS |
7,580 |
7,060 |
520 |
6.8% |
| RIVERSIDE |
1,218,300 |
1,151,000 |
67,300 |
5.5% |
| SACRAMENTO |
790,300 |
749,800 |
40,500 |
5.1% |
| SAN BENITO |
34,700 |
32,600 |
2,100 |
6.1% |
| SAN BERNARDINO |
1,060,300 |
1,003,800 |
56,500 |
5.3% |
| SAN DIEGO |
1,690,200 |
1,611,700 |
78,400 |
4.6% |
| SAN FRANCISCO |
515,100 |
494,800 |
20,300 |
3.9% |
| SAN JOAQUIN |
381,500 |
357,000 |
24,400 |
6.4% |
| SAN LUIS OBISPO |
133,100 |
127,100 |
6,000 |
4.5% |
| SAN MATEO |
421,700 |
405,700 |
16,000 |
3.8% |
| SANTA BARBARA |
227,200 |
216,900 |
10,300 |
4.5% |
| SANTA CLARA |
1,033,000 |
989,400 |
43,600 |
4.2% |
| SANTA CRUZ |
139,600 |
131,400 |
8,300 |
5.9% |
| SHASTA |
81,900 |
77,500 |
4,300 |
5.3% |
| SIERRA |
1,440 |
1,370 |
70 |
5.1% |
| SISKIYOU |
16,850 |
15,700 |
1,150 |
6.8% |
| SOLANO |
217,000 |
205,300 |
11,700 |
5.4% |
| SONOMA |
249,000 |
238,000 |
11,000 |
4.4% |
| STANISLAUS |
262,200 |
244,700 |
17,500 |
6.7% |
| SUTTER |
46,600 |
42,800 |
3,700 |
8.0% |
| TEHAMA |
27,510 |
25,900 |
1,620 |
5.9% |
| TRINITY |
5,520 |
5,190 |
330 |
6.0% |
| TULARE |
224,800 |
202,400 |
22,400 |
10.0% |
| TUOLUMNE |
22,630 |
21,430 |
1,210 |
5.3% |
| VENTURA |
425,700 |
404,700 |
21,100 |
4.9% |
| YOLO |
112,700 |
106,200 |
6,500 |
5.8% |
| YUBA |
36,700 |
34,200 |
2,400 |
6.6% |