NR No. 25-25
Contact: Loree Levy/Greg Lawson
916-654-9029
mediainquiries@edd.ca.gov
Important Note: The employment data for the month of May 2025 comes from the survey week that included May 12. Data for June is scheduled for release on July 18, 2025.
Employers added 17,700 jobs in May
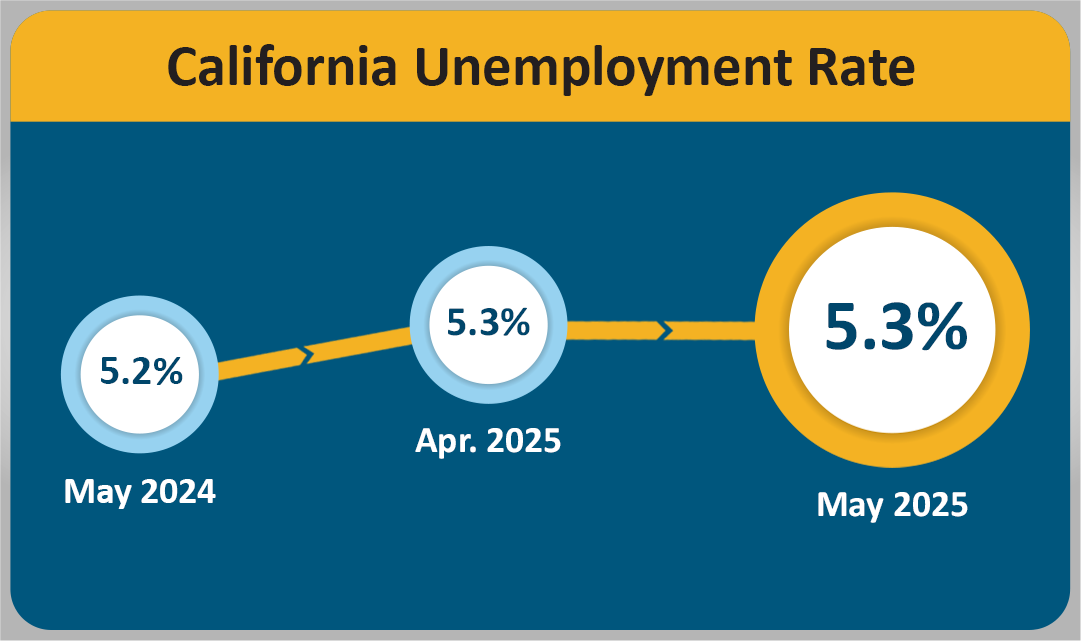
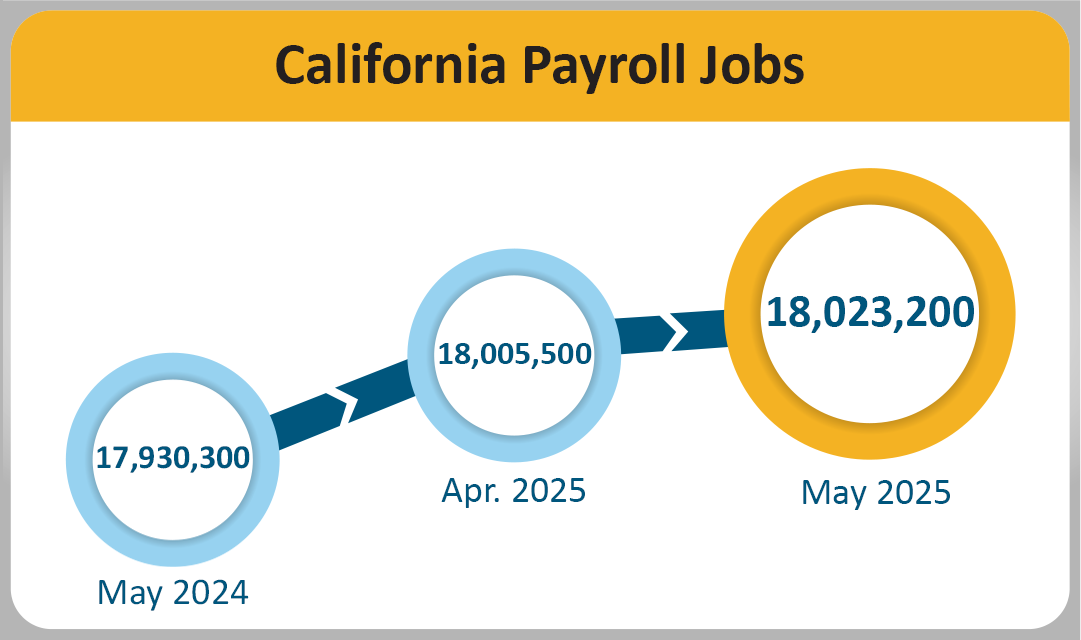
SACRAMENTO — California’s unemployment rate remained at 5.3 percent1 and California’s nonfarm payroll jobs2 increased by 17,700 jobs in May 2025, according to the latest Employment Development Department (EDD) data that comes from two separate surveys. May’s job increase follows an upward-revised job gain of 23,100 for April 2025.
California's Labor Market, by the Numbers...
- California’s gain of 17,700 jobs for May 2025 accounted for 12.7 percent of the nation’s overall gain of 139,000 jobs, which is stronger than California’s 11.3 percent share of jobs nationally.
- California has gained 3,103,400 jobs since April 2020, an average of 50,875 per month. Year-over, California’s total nonfarm jobs increased by 92,900 between May 2024 and May 2025.
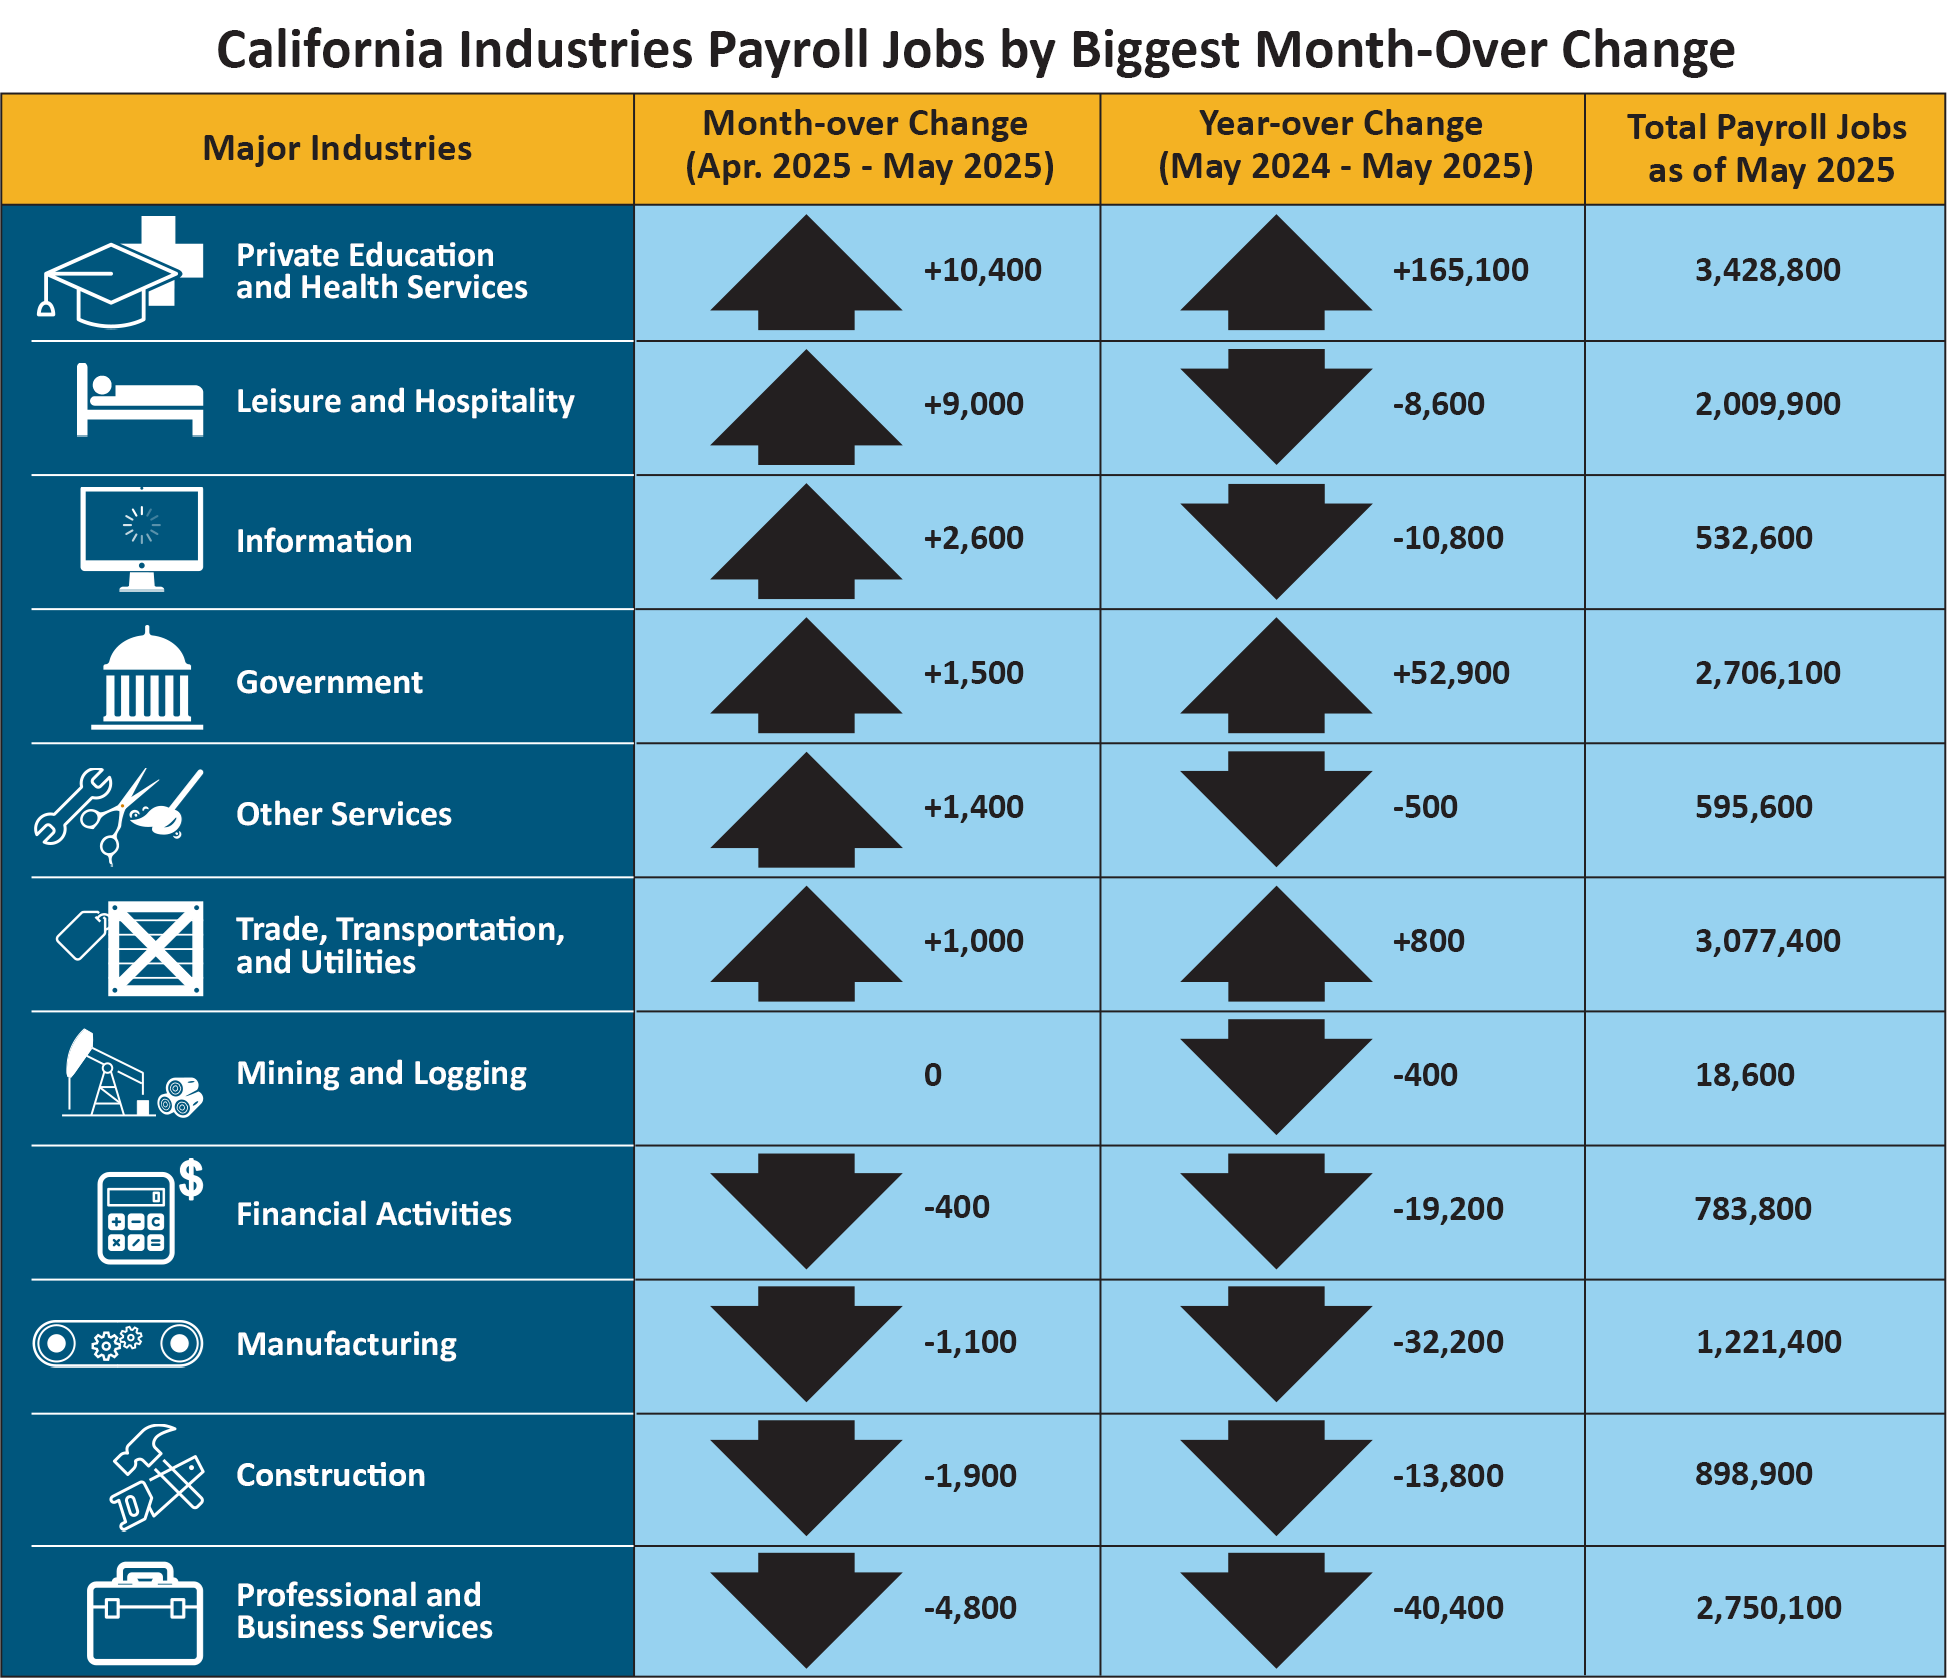
- Six of California's 11 industry sectors gained jobs in May, with Private Education and Health Services (+10,400) posting a gain for the 40th consecutive month. The largest gains were in Health Care and Social Assistance (+14,100) subsectors, which include fields such as outpatient care centers and individual and family services, partly due to California’s aging population.
- Government (+1,500) also posted a month-over job gain with the largest increase again coming from Local Government (+3,400). The gain comes despite the significant loss in Federal Government (-2,700) due in part to job reductions at the U.S. Postal Service; federal prisons; and the Departments of the Interior, Veterans Affairs, and Defense. The State’s loss in federal jobs was the largest since September 2010, excluding losses during the COVID-19 pandemic.
- Professional and Business Services (-4,800) again posted the State’s largest month-over loss as specialized design, computer design, and scientific research and development have experienced consistent year-over losses each month this calendar year.
1. The unemployment rate comes from a separate federal survey of 4,400 California households.
2. The nonfarm payroll job numbers come from a federal survey of 80,000 California businesses.
Data Trends about Jobs in the Economy
Total Nonfarm Payroll Jobs (Comes from a monthly survey of approximately 80,000 California businesses that estimates jobs in the economy — seasonally adjusted)
- Month-over — Total nonfarm jobs in California’s 11 major industries amounted to 18,023,200 in May — a gain of 17,700 from April. This followed April’s upward revision of 5,400 jobs, resulting in a month-over April gain of 23,100 jobs.
- Year-over — Total nonfarm jobs increased by 92,900 (a 0.5 percent increase) from May 2024 to May 2025 compared to the U.S. annual gain of 1,733,000 jobs (a 1.1 percent increase).
| Major Industries | Month-over Change (Apr. 2025 - May 2025) |
Year-over Change (May 2024 - May 2025) |
Total Payroll Jobs as of May 2025 |
|---|---|---|---|
| Private Education and Health Services | +10,400 | +165,100 | 3,428,800 |
| Leisure and Hospitality | +9,000 | -8,600 | 2,009,900 |
| Information | +2,600 | -10,800 | 532,600 |
| Government | +1,500 | +52,900 | 2,706,100 |
| Other Services | +1,400 | -500 | 595,600 |
| Trade, Transportation, and Utilities | +1,000 | +800 | 3,077,400 |
| Mining and Logging | 0 | -400 | 18,600 |
| Financial Activities | -400 | -19,200 | 783,800 |
| Manufacturing | -1,100 | -32,200 | 1,221,400 |
| Construction | -1,900 | -13,800 | 898,900 |
| Professional and Business Services | -4,800 | -40,400 | 2,750,100 |
Total Farm Jobs — The number of jobs in the agriculture industry increased from April by 5,100 to a total of 416,800 jobs in May. The agriculture industry had 1,600 more farm jobs in May 2025 than it did in May of last year.
Data Trends about Workers in the Economy
Employment and Unemployment in California (Based on a monthly federal survey of 4,400 California households which focuses on workers in the economy)
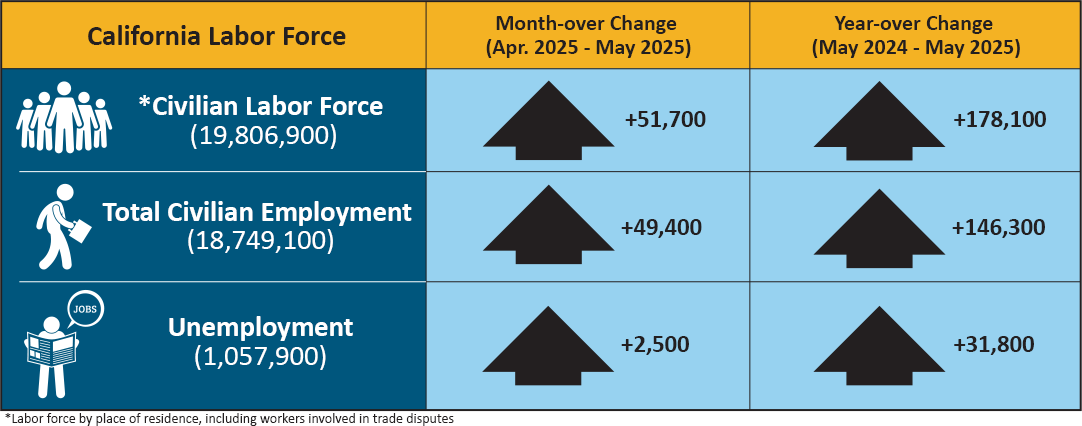
- Employed — The number of Californians employed in May was 18,749,100, an increase of 49,400 persons from April’s total of 18,699,700 and up 146,300 from the employment total in May 2024.
- Unemployed — The number of unemployed Californians was 1,057,900 in May, an increase of 2,500 over the month and up 31,800 in comparison to May 2024.
| California Labor Force | Month-over Change (April 2025–May 2025) | Year-over Change (May 2025–May 2025) |
|---|---|---|
| * Civilian Labor Force (19,806,900) | +51,700 | +178,100 |
| Total Civilian Employment (18,749,100) | +49,400 | +146,300 |
| Unemployment (1,057,900) | +2,500 | +31,800 |
* Labor force by place of residence, including workers involved in trade disputes.
Unemployment Insurance Claims (Not Seasonally Adjusted)
The following data is from a sample week that includes the 19th of each month:
In related data that figures into the State’s unemployment rate, there were 384,749 people certifying for Unemployment Insurance (UI) benefits during the May 2025 sample week. That compares to 402,004 people in April and 379,955 people in May 2024. Concurrently, 41,236 initial claims were processed in the May 2025 sample week, which was a month-over decrease of 986 claims from April, but a year-over increase of 2,343 claims from May 2024.
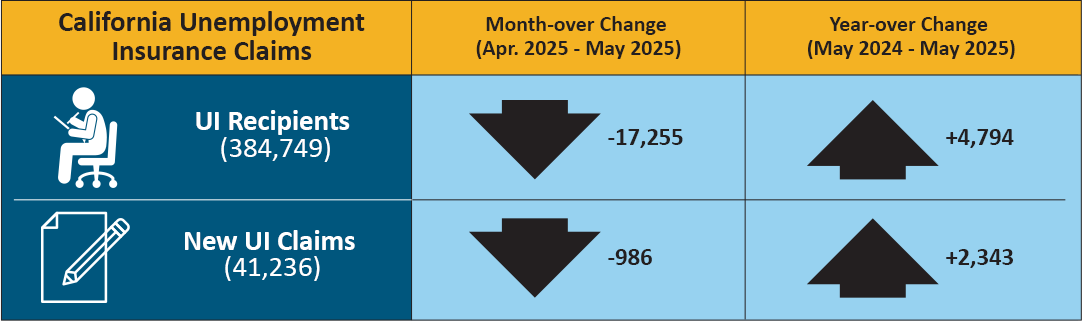
| California Unemployment Insurance Claims | Month-over Change (April 2025–May 2025) | Year-over Change (May 2024–May 2025) |
|---|---|---|
| UI Recipients (384,749) | -17,255 | +4,794 |
| New UI Claims (41,236) | -986 | +2,343 |
| COUNTY | LABOR FORCE | EMPLOYMENT | UNEMPLOYMENT | RATE |
|---|---|---|---|---|
| STATE TOTAL | 19,806,200 | 18,826,100 | 980,000 | 4.9% |
| ALAMEDA | 868,800 | 832,900 | 35,800 | 4.1% |
| ALPINE | 400 | 360 | 40 | 10.0% |
| AMADOR | 15,370 | 14,590 | 790 | 5.1% |
| BUTTE | 94,100 | 89,100 | 5,000 | 5.3% |
| CALAVERAS | 17,690 | 16,690 | 1,000 | 5.7% |
| COLUSA | 11,690 | 10,260 | 1,430 | 12.2% |
| CONTRA COSTA | 584,600 | 560,100 | 24,500 | 4.2% |
| DEL NORTE | 9,110 | 8,600 | 510 | 5.6% |
| EL DORADO | 92,000 | 88,000 | 4,000 | 4.4% |
| FRESNO | 485,500 | 447,100 | 38,300 | 7.9% |
| GLENN | 12,180 | 11,370 | 810 | 6.7% |
| HUMBOLDT | 61,500 | 58,700 | 2,800 | 4.5% |
| IMPERIAL | 73,900 | 61,000 | 12,900 | 17.4% |
| INYO | 8,480 | 8,160 | 320 | 3.7% |
| KERN | 413,200 | 377,200 | 36,000 | 8.7% |
| KINGS | 59,700 | 54,600 | 5,100 | 8.6% |
| LAKE | 26,770 | 25,080 | 1,690 | 6.3% |
| LASSEN | 8,250 | 7,820 | 440 | 5.3% |
| LOS ANGELES | 5,050,500 | 4,776,100 | 274,400 | 5.4% |
| MADERA | 72,600 | 67,400 | 5,200 | 7.2% |
| MARIN | 127,000 | 122,400 | 4,500 | 3.6% |
| MARIPOSA | 7,480 | 7,120 | 360 | 4.8% |
| MENDOCINO | 37,300 | 35,470 | 1,830 | 4.9% |
| MERCED | 125,100 | 113,100 | 12,000 | 9.6% |
| MODOC | 3,240 | 3,070 | 180 | 5.4% |
| MONO | 8,720 | 8,430 | 290 | 3.3% |
| MONTEREY | 236,100 | 221,400 | 14,700 | 6.2% |
| NAPA | 78,800 | 76,100 | 2,700 | 3.5% |
| NEVADA | 47,750 | 45,690 | 2,060 | 4.3% |
| ORANGE | 1,642,800 | 1,584,200 | 58,600 | 3.6% |
| PLACER | 208,300 | 200,600 | 7,800 | 3.7% |
| PLUMAS | 7,850 | 7,380 | 470 | 6.0% |
| RIVERSIDE | 1,193,400 | 1,135,300 | 58,000 | 4.9% |
| SACRAMENTO | 788,500 | 753,900 | 34,600 | 4.4% |
| SAN BENITO | 34,600 | 32,400 | 2,200 | 6.4% |
| SAN BERNARDINO | 1,038,500 | 988,900 | 49,600 | 4.8% |
| SAN DIEGO | 1,679,500 | 1,612,500 | 67,100 | 4.0% |
| SAN FRANCISCO | 511,000 | 492,700 | 18,300 | 3.6% |
| SAN JOAQUIN | 376,900 | 354,300 | 22,600 | 6.0% |
| SAN LUIS OBISPO | 135,100 | 130,200 | 4,900 | 3.6% |
| SAN MATEO | 418,000 | 403,900 | 14,100 | 3.4% |
| SANTA BARBARA | 227,800 | 219,400 | 8,500 | 3.7% |
| SANTA CLARA | 1,027,100 | 988,300 | 38,700 | 3.8% |
| SANTA CRUZ | 139,500 | 131,700 | 7,800 | 5.6% |
| SHASTA | 81,100 | 77,300 | 3,800 | 4.7% |
| SIERRA | 1,420 | 1,350 | 60 | 4.5% |
| SISKIYOU | 16,840 | 15,780 | 1,050 | 6.2% |
| SOLANO | 217,600 | 207,300 | 10,300 | 4.7% |
| SONOMA | 250,200 | 240,700 | 9,500 | 3.8% |
| STANISLAUS | 261,200 | 243,900 | 17,300 | 6.6% |
| SUTTER | 47,300 | 43,300 | 3,900 | 8.3% |
| TEHAMA | 27,500 | 25,890 | 1,600 | 5.8% |
| TRINITY | 5,690 | 5,400 | 280 | 5.0% |
| TULARE | 230,200 | 207,500 | 22,700 | 9.9% |
| TUOLUMNE | 22,580 | 21,480 | 1,100 | 4.9% |
| VENTURA | 429,000 | 411,300 | 17,700 | 4.1% |
| YOLO | 112,600 | 107,200 | 5,500 | 4.9% |
| YUBA | 36,400 | 34,100 | 2,300 | 6.3% |