NR No. 24-24
Contact: Loree Levy/Greg Lawson
916-654-9029
mediainquiries@edd.ca.gov
Important Note: The employment data for the month of May 2024 is taken from the survey week including May 12. Data for June is scheduled for release on July 19, 2024.
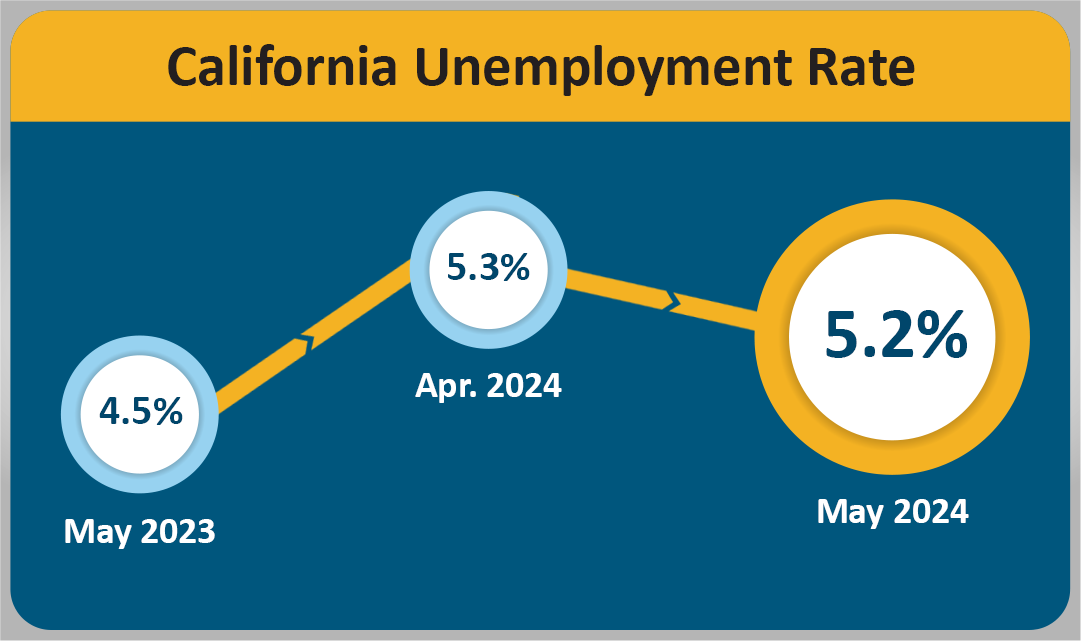
The State’s Unemployment Rate Fell to 5.2 percent
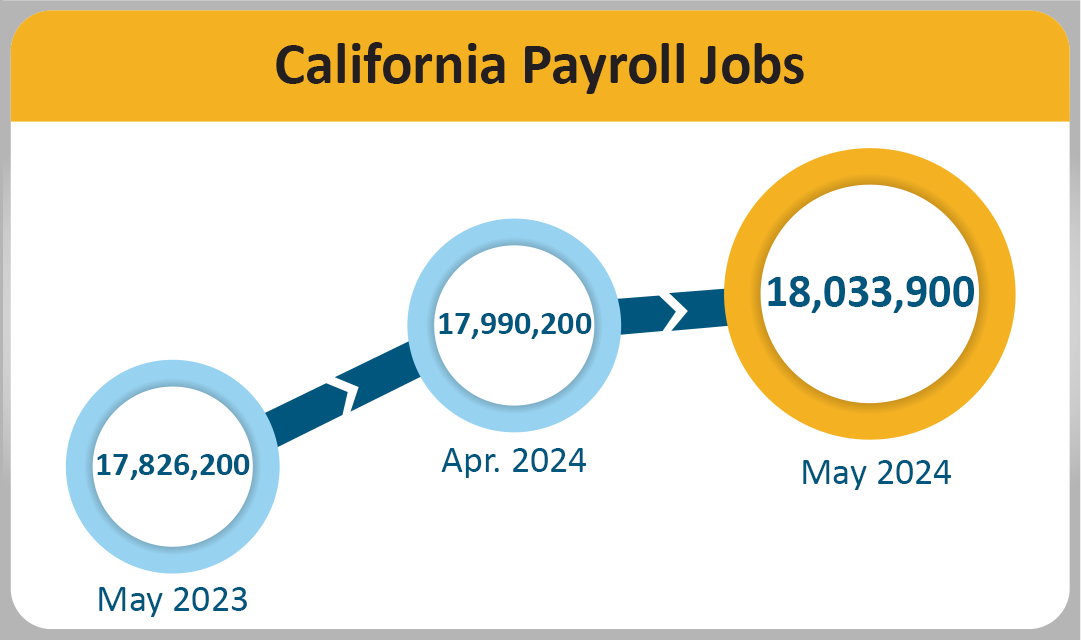
SACRAMENTO – California’s employers added 43,700 nonfarm payroll jobs1 in May 2024 – the largest such increase for the state since October of 2023 and a continuation of California’s 2024 job growth trend. In addition, the unemployment rate decreased to 5.2 percent2, according to data released by the Employment Development Department (EDD). May’s job gain follows a revised increase of 4,100 jobs for April 2024.
California's Labor Market, by the Numbers...
- The State’s jobs market expansion entered its 49th month in May 2024. Since May 2020, California has gained 3,100,400 jobs, which averages out to 63,273 per month.
- California’s gain of 43,700 jobs for May 2024 accounted for 16.1 percent of the nation’s overall gain of 272,000 jobs, which is notably stronger than California’s 11 percent share of jobs nationally.
- Eight of California's 11 industry sectors gained jobs in May with Leisure and Hospitality (+10,200) showing the best month-over increase thanks in part to California drying out from wet weather across the state earlier in the year. The industry also got a boost from jobs in Accommodations and Food Services (which includes fast-food restaurants) with a gain of 8,100 jobs in May after posting a gain of 5,900 the month prior.
- Trade, Transportation, and Utilities (+5,100) also showed noticeable growth as above-average gains were seen in the Truck Transportation and the Couriers and Messengers industry groups.
- Information (-1,900) had the largest month-over reduction in jobs as it continues its four-month-long slide.
1. The unemployment rate comes from a separate federal survey of 5,100 California households.
2. The nonfarm payroll job numbers come from a federal survey of 80,000 California businesses.
Data Trends about Jobs in the Economy
Total Nonfarm Payroll Jobs (Comes from a monthly survey of approximately 80,000 California businesses that estimates jobs in the economy – seasonally adjusted)
- Month-over – Total nonfarm jobs in California’s 11 major industries amounted to 18,033,900 in May – a net gain of 43,700 from April. This followed a downward revised (-1,100) month-over gain of 4,100 jobs in April.
- Year-over – Total nonfarm jobs increased by 207,700 (a 1.2 percent increase) from May 2023 to May 2024 compared to the U.S. annual gain of 2,756,000 jobs (a 1.8 percent increase).
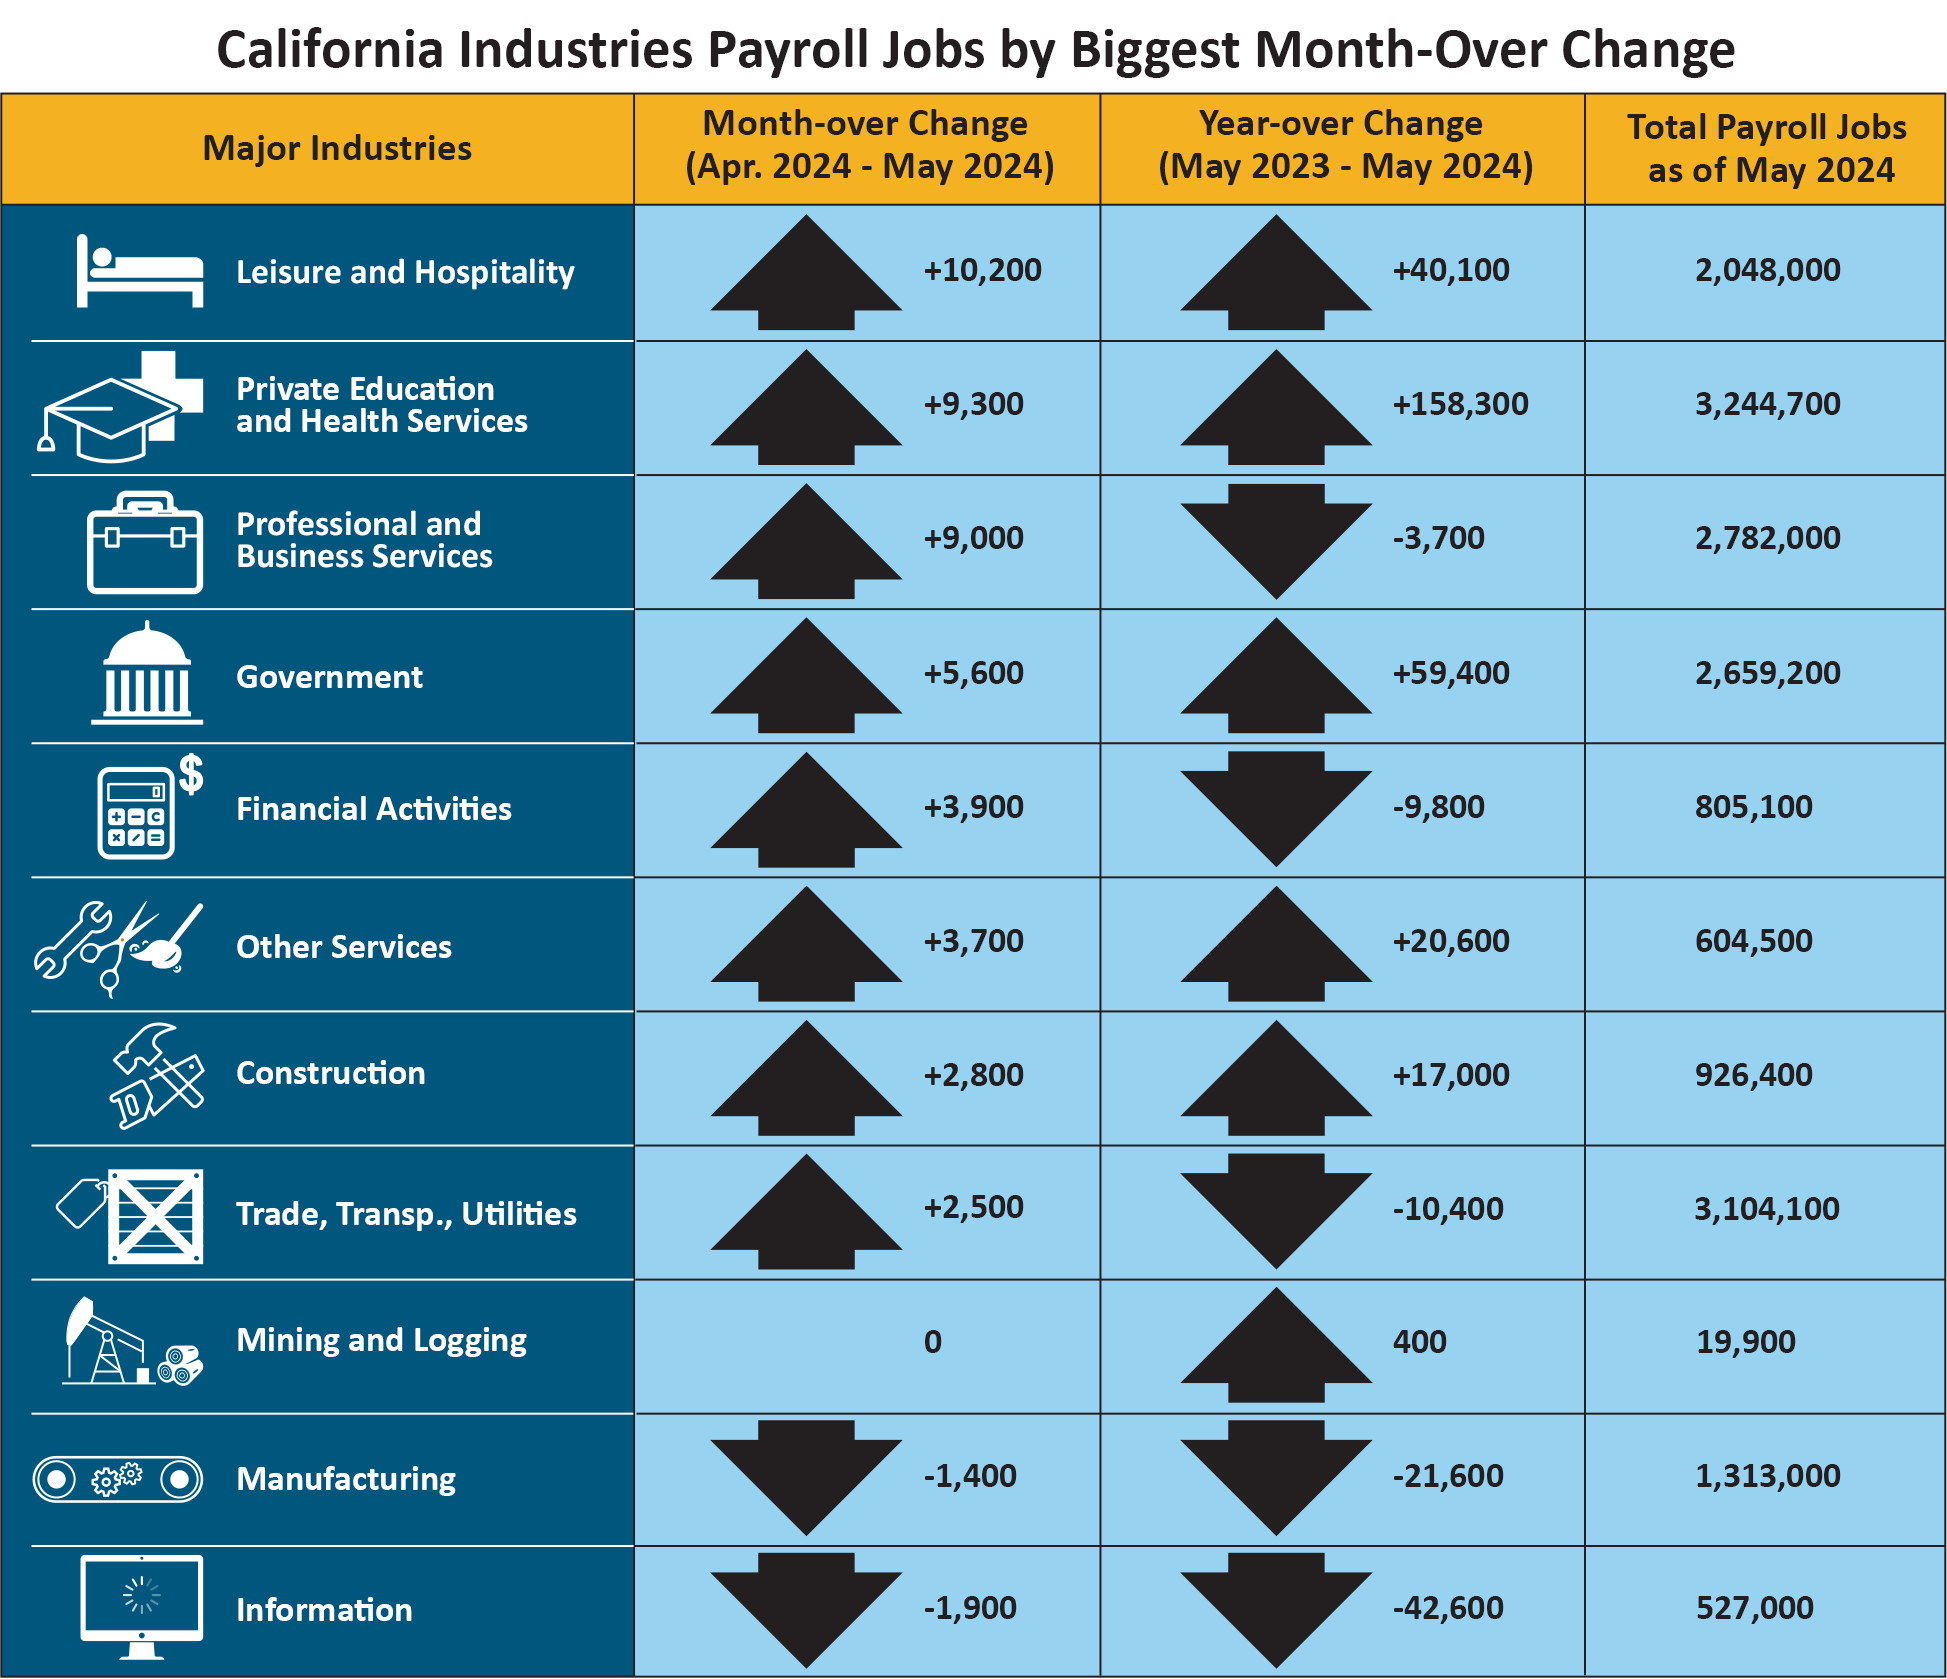
| Major Industries | Month-over Change (April 2024–May 2024) | Year-over Change (May 2023–May 2024) | Total Payroll Jobs as of May 2024 |
|---|---|---|---|
|
Leisure and Hospitality |
+10,200 | +40,100 | 2,048,000 |
|
Private Education and Health Services |
+9,300 | +158,300 | 3,244,700 |
|
Professional and Business Services |
+9,000 | -3,700 | 2,782,000 |
|
Government |
+5,600 | +59,400 | 2,659,200 |
|
Financial Activities |
+3,900 | -9,800 | 805,100 |
|
Other Services |
+3,700 | +20,600 | 604,500 |
|
Construction |
+2,800 | +17,000 | 926,000 |
|
Trade, Transp., Utilities |
+2,500 | -10,400 | 3,104,100 |
|
Mining and Logging |
0 | +400 | 19,900 |
|
Manufacturing |
-1,400 | -21,600 | 1,313,000 |
|
Information |
-1,900 | -42,600 | 527,000 |
Total Farm Jobs – The number of jobs in the agriculture industry increased from April by 3,900 to a total of 410,600 jobs in May. The agriculture industry had 5,400 more farm jobs in May 2024 than it did in May of last year.
Data Trends about Workers in the Economy
Employment and Unemployment in California (Based on a monthly federal survey of 5,100 California households which focuses on workers in the economy)
- Employed – The number of Californians employed in May was 18,328,600, an increase of 9,500 persons from April’s total of 18,319,100, but down 113,500 from the employment total in May 2023.
- Unemployed – The number of unemployed Californians was 1,009,800 in May, a decrease of 17,700 over the month, but up 141,800 in comparison to May 2023.
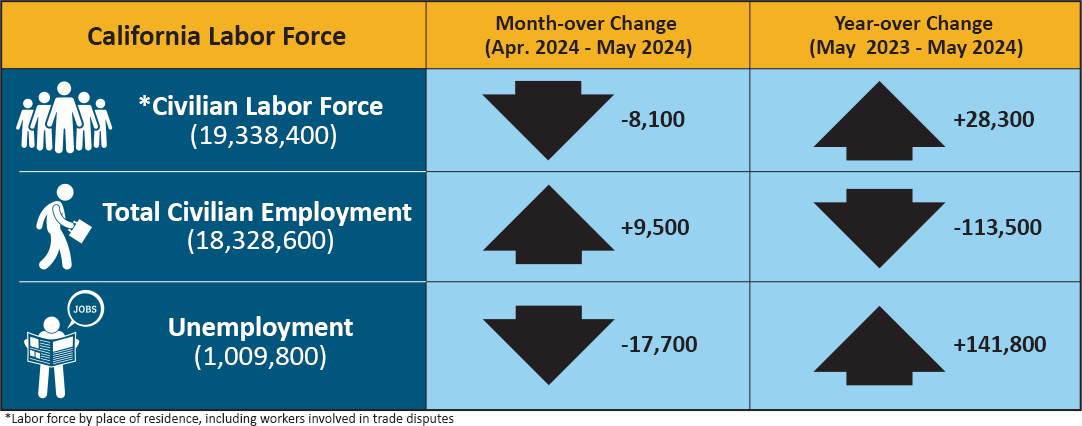
| California Labor Force | Month-over Change (April 2024–May 2024) | Year-over Change (May 2023–May 2024) |
|---|---|---|
| * Civilian Labor Force (19,338,400) | -8,100 | +28,300 |
| Total Civilian Employment (18,328,600) | +9,500 | -113,500 |
| Unemployment (1,009,800) | -17,700 | +141,800 |
* Labor force by place of residence, including workers involved in trade disputes.
Unemployment Insurance Claims (Not Seasonally Adjusted)
The following data is from a sample week that includes the 19th of each month:
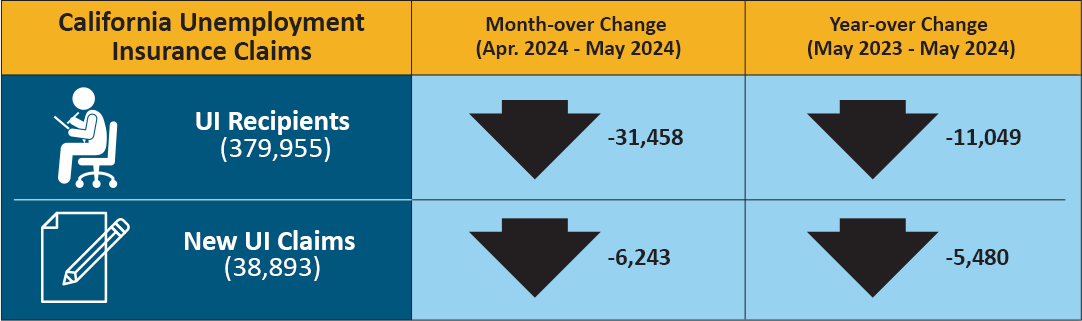
In related data that figures into the state’s unemployment rate, there were 379,955 people certifying for Unemployment Insurance (UI) benefits during the May 2024 sample week. That compares to 411,413 people in April and 391,004 people in May 2023. Concurrently, 38,893 initial claims were processed in the May 2024 sample week, which was a month-over decrease of 6,243 claims from April and a year-over decrease of 5,480 claims from May 2023.
| California Unemployment Insurance Claims | Month-over Change (April 2024–May 2024) | Year-over Change (May 2023–May 2024) |
|---|---|---|
| UI Recipients (379,955) | -31,458 | -11,049 |
| New UI Claims (38,893) | -6,243 | -5,480 |
| COUNTY | LABOR FORCE | EMPLOYMENT | UNEMPLOYMENT | RATE |
|---|---|---|---|---|
| STATE TOTAL | 19,226,300 | 18,353,500 | 872,800 | 4.5% |
| ALAMEDA | 817,700 | 786,000 | 31,700 | 3.9% |
| ALPINE | 500 | 470 | 30 | 6.8% |
| AMADOR | 14,530 | 13,900 | 630 | 4.3% |
| BUTTE | 92,200 | 87,600 | 4,500 | 4.9% |
| CALAVERAS | 22,270 | 21,410 | 860 | 3.9% |
| COLUSA | 10,820 | 9,530 | 1,280 | 11.9% |
| CONTRA COSTA | 545,600 | 524,400 | 21,200 | 3.9% |
| DEL NORTE | 8,980 | 8,540 | 440 | 4.9% |
| EL DORADO | 94,000 | 90,500 | 3,400 | 3.7% |
| FRESNO | 458,400 | 425,500 | 32,900 | 7.2% |
| GLENN | 12,690 | 11,970 | 720 | 5.7% |
| HUMBOLDT | 60,200 | 57,700 | 2,500 | 4.1% |
| IMPERIAL | 72,400 | 61,300 | 11,100 | 15.4% |
| INYO | 8,500 | 8,230 | 260 | 3.1% |
| KERN | 390,900 | 358,400 | 32,400 | 8.3% |
| KINGS | 59,000 | 54,600 | 4,400 | 7.4% |
| LAKE | 28,250 | 26,860 | 1,390 | 4.9% |
| LASSEN | 8,520 | 8,120 | 400 | 4.7% |
| LOS ANGELES | 5,017,400 | 4,758,800 | 258,600 | 5.2% |
| MADERA | 66,100 | 61,500 | 4,500 | 6.8% |
| MARIN | 131,400 | 127,500 | 3,900 | 3.0% |
| MARIPOSA | 7,690 | 7,370 | 320 | 4.1% |
| MENDOCINO | 37,480 | 35,940 | 1,540 | 4.1% |
| MERCED | 120,800 | 110,400 | 10,500 | 8.7% |
| MODOC | 3,260 | 3,090 | 170 | 5.2% |
| MONO | 8,920 | 8,630 | 290 | 3.3% |
| MONTEREY | 224,800 | 211,900 | 12,900 | 5.7% |
| NAPA | 72,800 | 70,500 | 2,300 | 3.1% |
| NEVADA | 48,460 | 46,740 | 1,720 | 3.5% |
| ORANGE | 1,575,500 | 1,524,600 | 51,000 | 3.2% |
| PLACER | 195,000 | 188,400 | 6,600 | 3.4% |
| PLUMAS | 7,420 | 7,000 | 430 | 5.7% |
| RIVERSIDE | 1,146,600 | 1,096,400 | 50,200 | 4.4% |
| SACRAMENTO | 731,000 | 701,800 | 29,200 | 4.0% |
| SAN BENITO | 31,900 | 30,000 | 1,800 | 5.8% |
| SAN BERNARDINO | 1,003,100 | 960,200 | 42,900 | 4.3% |
| SAN DIEGO | 1,580,100 | 1,522,600 | 57,500 | 3.6% |
| SAN FRANCISCO | 550,800 | 534,100 | 16,700 | 3.0% |
| SAN JOAQUIN | 351,400 | 331,900 | 19,500 | 5.5% |
| SAN LUIS OBISPO | 135,800 | 131,800 | 4,000 | 3.0% |
| SAN MATEO | 436,200 | 423,700 | 12,500 | 2.9% |
| SANTA BARBARA | 220,700 | 213,300 | 7,400 | 3.3% |
| SANTA CLARA | 1,023,100 | 988,500 | 34,600 | 3.4% |
| SANTA CRUZ | 132,900 | 126,100 | 6,800 | 5.1% |
| SHASTA | 74,000 | 70,600 | 3,400 | 4.6% |
| SIERRA | 1,360 | 1,300 | 60 | 4.0% |
| SISKIYOU | 16,390 | 15,480 | 910 | 5.5% |
| SOLANO | 203,300 | 194,400 | 8,900 | 4.4% |
| SONOMA | 248,800 | 240,700 | 8,100 | 3.3% |
| STANISLAUS | 247,700 | 232,400 | 15,300 | 6.2% |
| SUTTER | 47,700 | 44,000 | 3,600 | 7.6% |
| TEHAMA | 25,850 | 24,480 | 1,370 | 5.3% |
| TRINITY | 4,610 | 4,390 | 230 | 4.9% |
| TULARE | 215,700 | 195,600 | 20,100 | 9.3% |
| TUOLUMNE | 19,950 | 19,050 | 900 | 4.5% |
| VENTURA | 413,000 | 397,700 | 15,200 | 3.7% |
| YOLO | 109,600 | 105,000 | 4,700 | 4.2% |
| YUBA | 32,300 | 30,300 | 2,000 | 6.1% |