NR No. 24-26
Contact: Loree Levy/Greg Lawson
916-654-9029
mediainquiries@edd.ca.gov
Important Note: The employment data for the month of June 2024 is taken from the survey week including June 12. Data for July is scheduled for release on August 16, 2024.
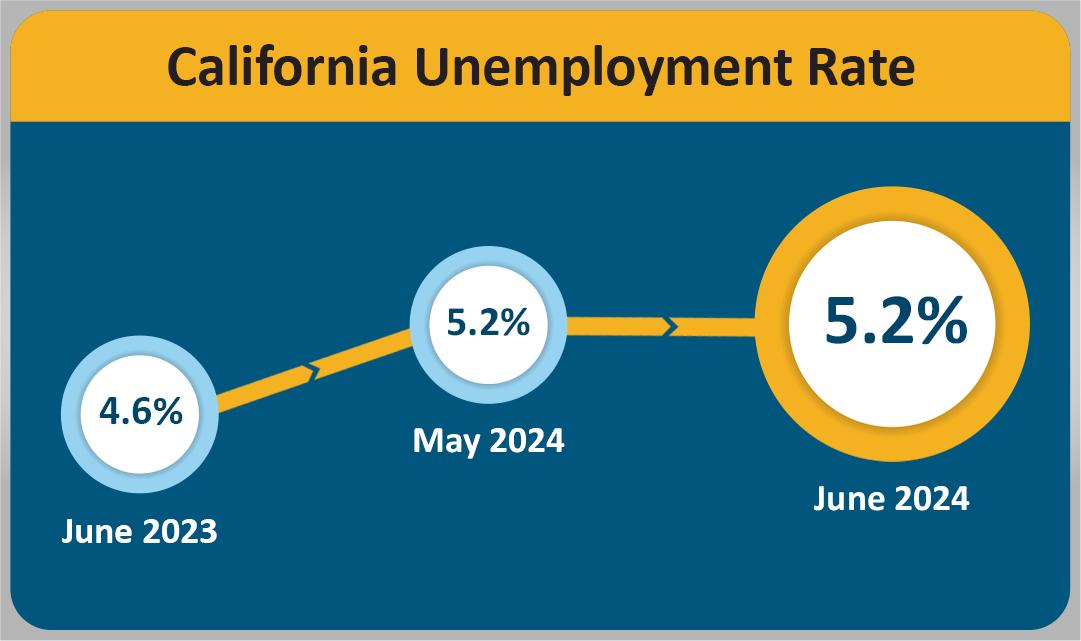
Unemployment Rate Remained 5.2 Percent
SACRAMENTO – California’s employers added 22,500 nonfarm payroll jobs1 in June 2024 as the unemployment rate held steady at 5.2 percent2, according to data released by the Employment Development Department (EDD). California’s job market expansion officially entered its 50th month.
California's Labor Market, by the Numbers...
- Since April 2020, California has gained 3,122,500 jobs, which averages out to 62,450 per month. June’s job gain follows a revised job gain of 43,300 for May 2024.
- California gained 107,100 nonfarm payroll jobs in the first six months of 2024, which is more than double the number of nonfarm payroll jobs the State gained during the same time period last year (38,400).
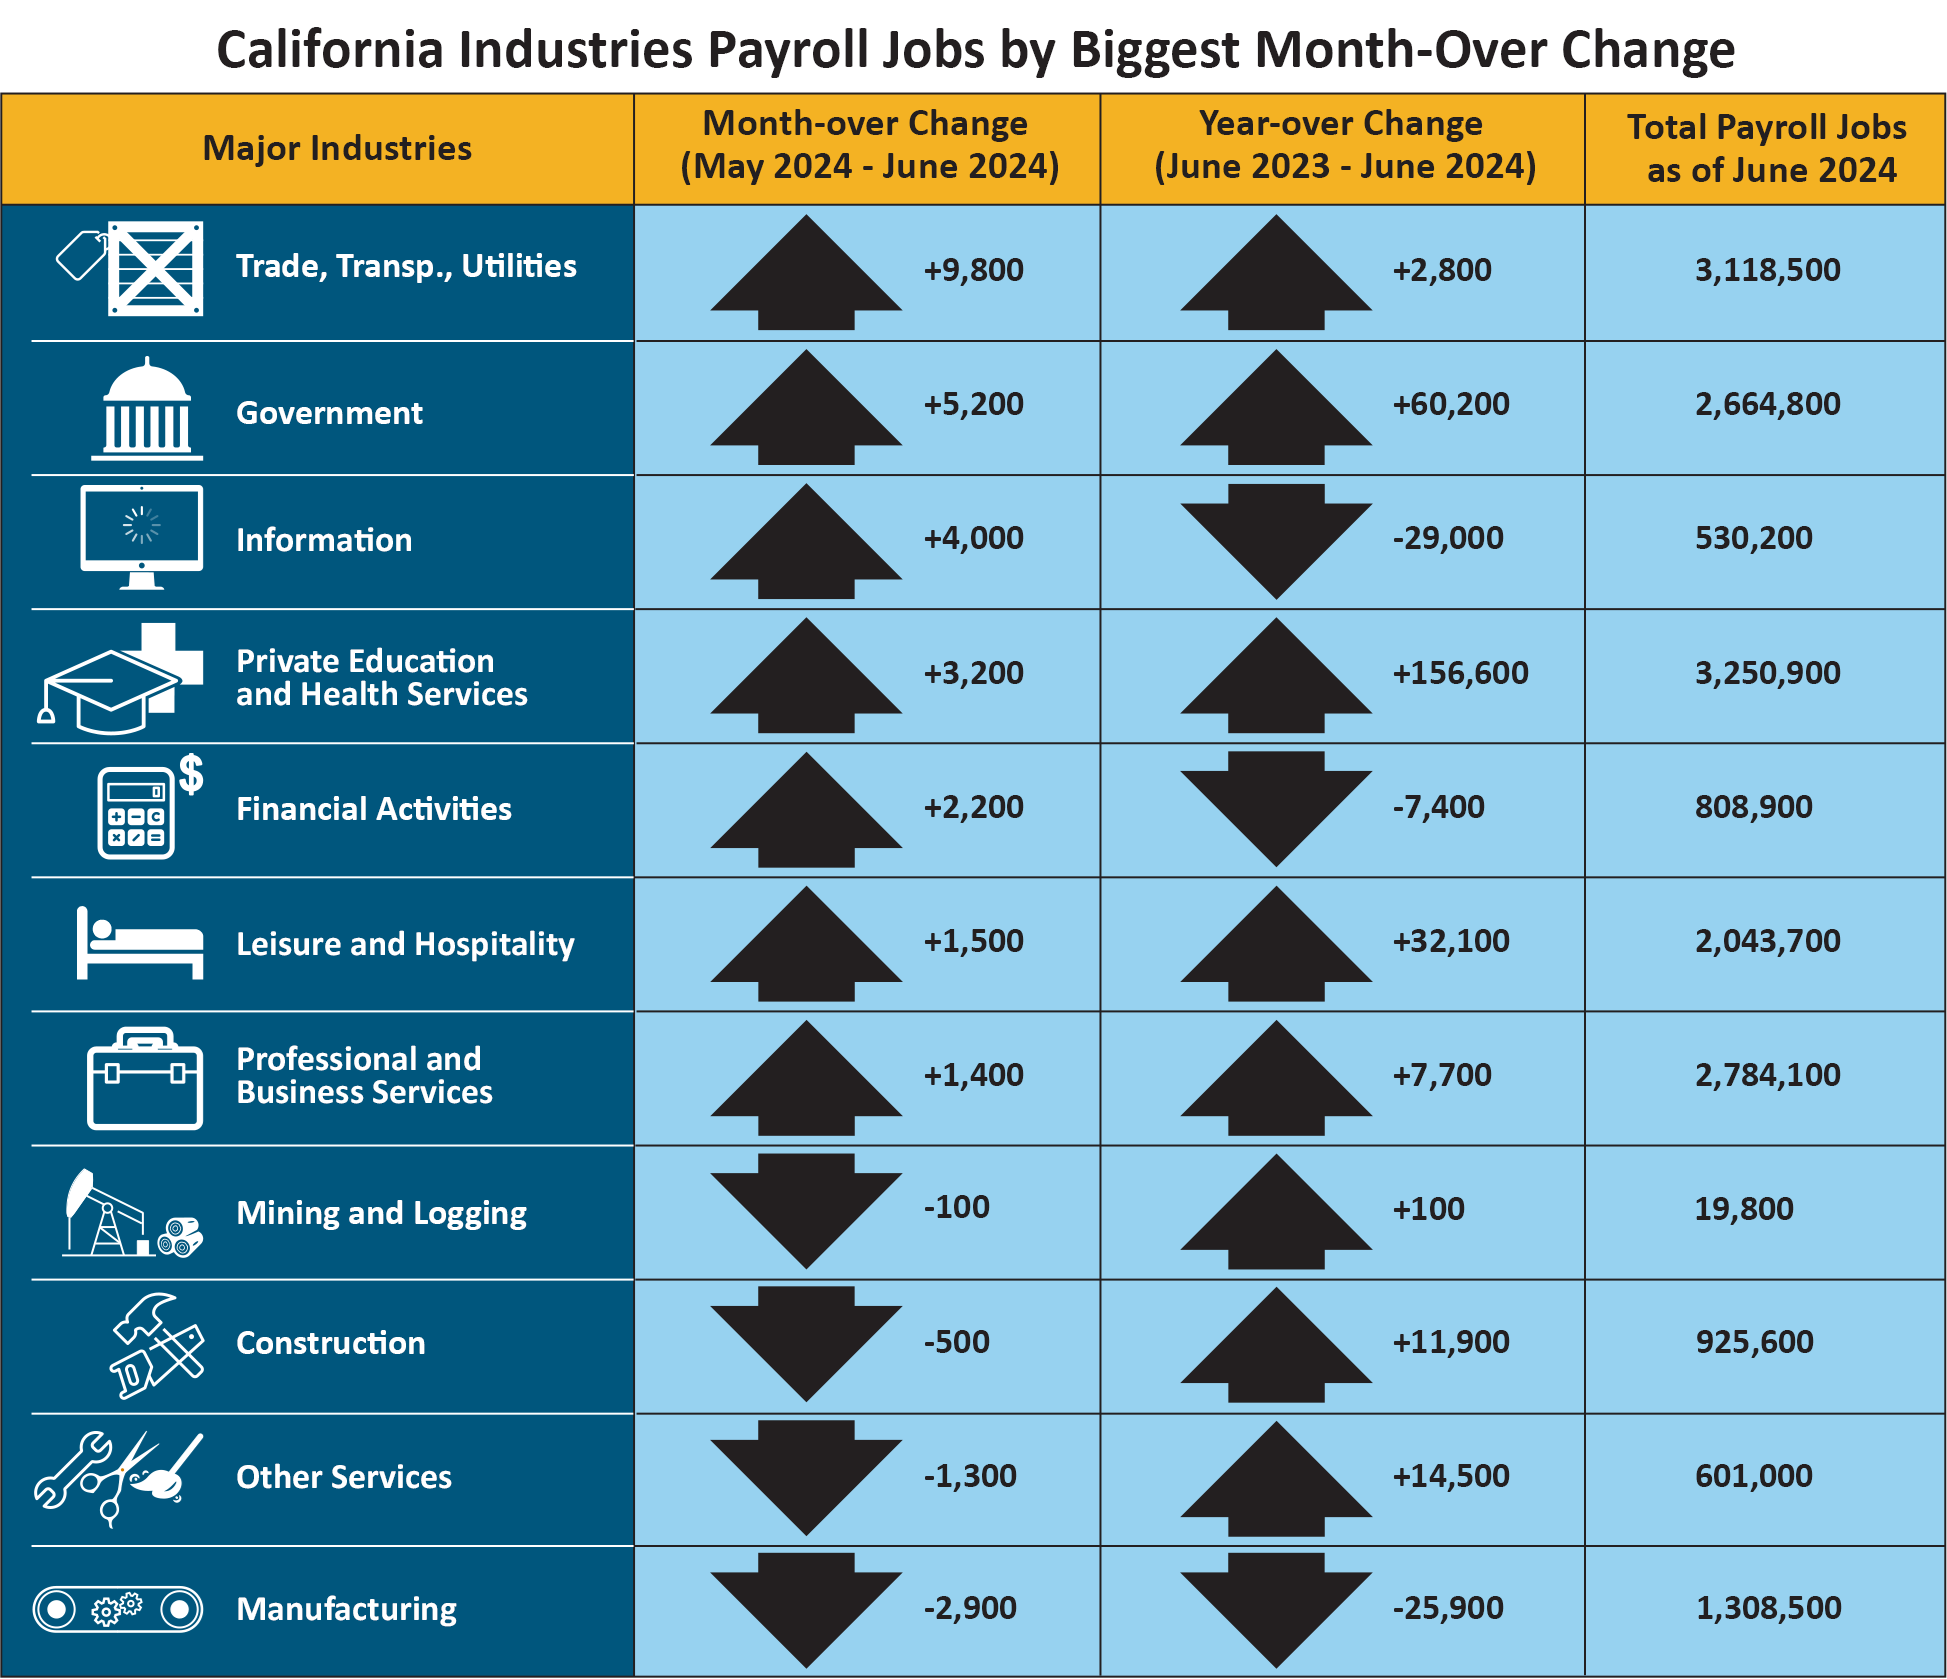
- Seven of California's 11 industry sectors gained jobs in June with the largest increase in Trade, Transportation, and Utilities (+9,800), adding jobs for the fourth consecutive month. This sector overall has gained 21,700 jobs from March through June, due in part to increased traffic at California’s ports and other seasonal activities.
- The Information (+4,000) sector showed good growth, especially in the motion picture industry.
- The Manufacturing sector recorded a month-over job loss (-2,900), which mirrored a similar loss in Manufacturing nationally.
1. The nonfarm payroll job numbers come from a federal survey of 80,000 California businesses.
2. The unemployment rate comes from a separate federal survey of 5,100 California households.
Data Trends about Jobs in the Economy
Total Nonfarm Payroll Jobs (Comes from a monthly survey of approximately 80,000 California businesses that estimates jobs in the economy – seasonally adjusted)
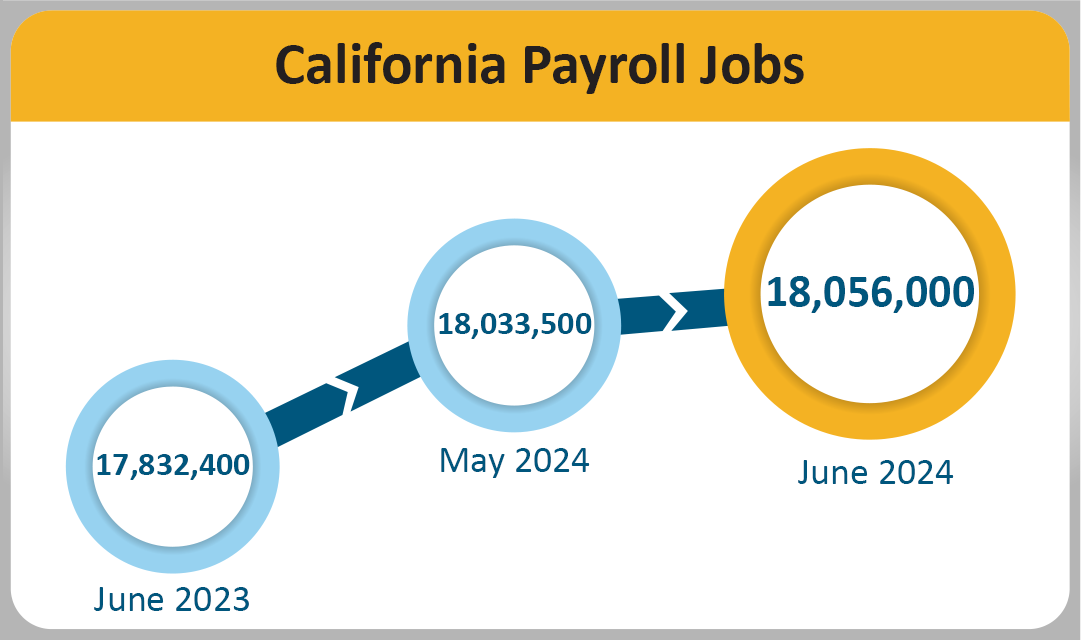
- Month-over – Total nonfarm jobs in California’s 11 major industries amounted to 18,056,000 in June – a net gain of 22,500 from May. This followed a downward revised (-400) month-over gain of 43,300 jobs in May.
- Year-over – Total nonfarm jobs increased by 223,600 (a 1.3 percent increase) from June 2023 to June 2024 compared to the U.S. annual gain of 2,611,000 jobs (a 1.7 percent increase).
| Major Industries |
Month-over Change (May 2024–June 2024) |
Year-over Change (June 2023–June 2024) |
Total Payroll Jobs as of June 2024 |
|
Trade, Transp., Utilities
|
+9,800 |
+2,800 |
3,118,500 |
|
Government
|
+5,200 |
+60,200 |
2,664,800 |
|
Information
|
+4,000 |
-29,000 |
530,200 |
|
Private Education and Health Services
|
+3,200 |
+156,600 |
3,250,900 |
|
Financial Activities
|
+2,200 |
-7,400 |
808,900 |
|
Leisure and Hospitality
|
+1,500 |
+32,100 |
2,043,700 |
|
Professional and Business Services
|
+1,400 |
+7,700 |
2,784,100 |
|
Mining and Logging
|
-100 |
+100 |
19,800 |
|
Construction
|
-500 |
+11,900 |
925,600 |
|
Other Services
|
-1,300 |
+14,500 |
601,000 |
|
Manufacturing
|
-2,900 |
-25,900 |
1,308,500 |
Total Farm Jobs – The number of jobs in the agriculture industry increased from May by 4,200 to a total of 414,800 jobs in June. The agriculture industry had 4,300 fewer farm jobs in June 2024 than it did in June of last year.
Data Trends about Workers in the Economy
Employment and Unemployment in California (Based on a monthly federal survey of 5,100 California households which focuses on workers in the economy)
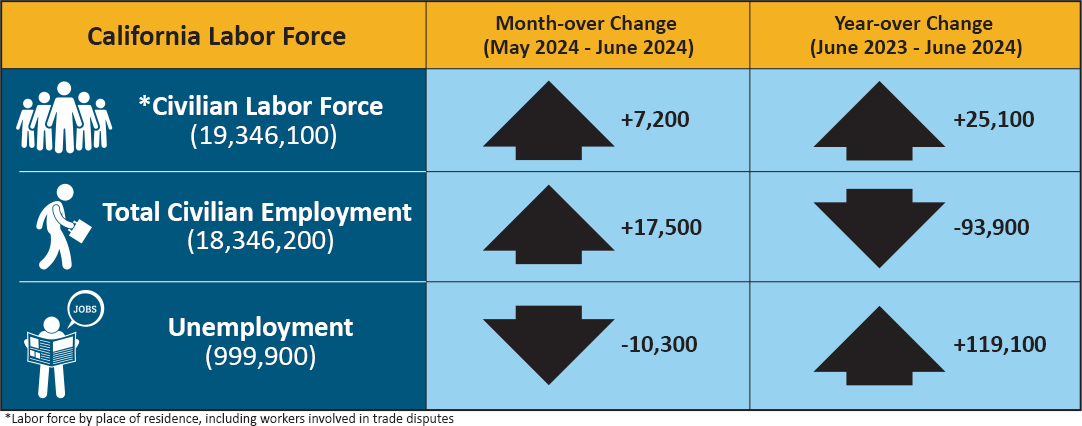
- Employed – The number of Californians employed in June was 18,346,200, an increase of 17,500 persons from May’s total of 18,328,700, but down 93,900 from the employment total in June 2023.
- Unemployed – The number of unemployed Californians was 999,990 in June, a decrease of 10,300 over the month, but up 119,100 in comparison to June 2023.
| California Labor Force |
Month-over Change (May 2024–June 2024) |
Year-over Change (June 2023–June 2024) |
| * Civilian Labor Force (19,346,100) |
+7,200 |
+25,100 |
| Total Civilian Employment (18,346,200) |
+17,500 |
-93,900 |
| Unemployment (999,900) |
-10,300 |
+119,100 |
* Labor force by place of residence, including workers involved in trade disputes.
Unemployment Insurance Claims (Not Seasonally Adjusted)
The following data is from a sample week that includes the 19th of each month:
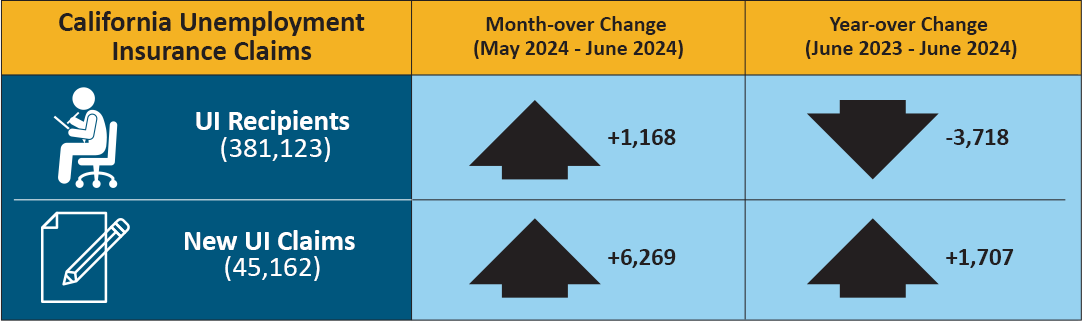
In related data that figures into the State’s unemployment rate, there were 381,123 people certifying for Unemployment Insurance (UI) benefits during the June 2024 sample week. That compares to 379,955 people in May and 384,841 people in June 2023. Concurrently, 45,162 initial claims were processed in the June 2024 sample week, which was a month-over increase of 6,269 claims from May and a year-over increase of 1,707 claims from June 2023.
| California Unemployment Insurance Claims |
Month-over Change (May 2024–June 2024) |
Year-over Change (June 2023–June 2024) |
| UI Recipients (381,123) |
+1,168 |
-3,718 |
| New UI Claims (45,162) |
+6,269 |
+1,707 |
MONTHLY LABOR FORCE DATA FOR COUNTIES
June 2024 (Preliminary); 2023 Benchmark
NOT SEASONALLY ADJUSTED
| COUNTY |
LABOR FORCE |
EMPLOYMENT |
UNEMPLOYMENT |
RATE |
| STATE TOTAL |
19,290,600 |
18,265,300 |
1,025,300 |
5.3% |
| ALAMEDA |
818,100 |
780,100 |
38,000 |
4.6% |
| ALPINE |
500 |
460 |
40 |
7.4% |
| AMADOR |
14,560 |
13,840 |
720 |
5.0% |
| BUTTE |
91,400 |
86,000 |
5,400 |
5.9% |
| CALAVERAS |
22,480 |
21,480 |
1,000 |
4.4% |
| COLUSA |
10,900 |
9,640 |
1,260 |
11.6% |
| CONTRA COSTA |
545,700 |
519,900 |
25,800 |
4.7% |
| DEL NORTE |
9,110 |
8,600 |
520 |
5.7% |
| EL DORADO |
93,900 |
89,800 |
4,100 |
4.4% |
| FRESNO |
459,000 |
423,800 |
35,200 |
7.7% |
| GLENN |
12,620 |
11,800 |
820 |
6.5% |
| HUMBOLDT |
60,100 |
57,000 |
3,000 |
5.0% |
| IMPERIAL |
73,100 |
61,000 |
12,000 |
16.4% |
| INYO |
8,610 |
8,290 |
320 |
3.7% |
| KERN |
393,900 |
358,800 |
35,200 |
8.9% |
| KINGS |
58,300 |
53,400 |
4,900 |
8.4% |
| LAKE |
28,130 |
26,530 |
1,590 |
5.7% |
| LASSEN |
8,560 |
8,120 |
450 |
5.2% |
| LOS ANGELES |
5,067,700 |
4,767,000 |
300,700 |
5.9% |
| MADERA |
65,800 |
60,900 |
4,900 |
7.4% |
| MARIN |
131,100 |
126,200 |
4,900 |
3.7% |
| MARIPOSA |
8,060 |
7,700 |
360 |
4.5% |
| MENDOCINO |
37,650 |
35,810 |
1,840 |
4.9% |
| MERCED |
121,600 |
110,200 |
11,400 |
9.4% |
| MODOC |
3,310 |
3,140 |
180 |
5.3% |
| MONO |
8,770 |
8,430 |
340 |
3.9% |
| MONTEREY |
227,400 |
214,400 |
13,000 |
5.7% |
| NAPA |
73,200 |
70,400 |
2,800 |
3.8% |
| NEVADA |
48,810 |
46,750 |
2,050 |
4.2% |
| ORANGE |
1,576,300 |
1,512,700 |
63,600 |
4.0% |
| PLACER |
195,300 |
187,100 |
8,200 |
4.2% |
| PLUMAS |
7,730 |
7,290 |
440 |
5.7% |
| RIVERSIDE |
1,151,800 |
1,089,900 |
61,800 |
5.4% |
| SACRAMENTO |
732,800 |
697,700 |
35,100 |
4.8% |
| SAN BENITO |
31,900 |
29,900 |
2,000 |
6.3% |
| SAN BERNARDINO |
1,007,500 |
955,100 |
52,500 |
5.2% |
| SAN DIEGO |
1,579,900 |
1,509,400 |
70,500 |
4.5% |
| SAN FRANCISCO |
549,700 |
530,000 |
19,600 |
3.6% |
| SAN JOAQUIN |
348,300 |
326,000 |
22,300 |
6.4% |
| SAN LUIS OBISPO |
135,800 |
130,400 |
5,400 |
4.0% |
| SAN MATEO |
435,300 |
420,100 |
15,200 |
3.5% |
| SANTA BARBARA |
221,800 |
212,400 |
9,300 |
4.2% |
| SANTA CLARA |
1,023,700 |
982,100 |
41,700 |
4.1% |
| SANTA CRUZ |
133,400 |
125,900 |
7,500 |
5.6% |
| SHASTA |
73,900 |
70,000 |
3,900 |
5.3% |
| SIERRA |
1,420 |
1,360 |
60 |
4.4% |
| SISKIYOU |
16,580 |
15,590 |
990 |
6.0% |
| SOLANO |
203,400 |
193,000 |
10,400 |
5.1% |
| SONOMA |
248,700 |
238,700 |
10,000 |
4.0% |
| STANISLAUS |
246,400 |
229,000 |
17,400 |
7.1% |
| SUTTER |
48,100 |
44,300 |
3,800 |
7.9% |
| TEHAMA |
25,980 |
24,400 |
1,580 |
6.1% |
| TRINITY |
4,790 |
4,540 |
250 |
5.2% |
| TULARE |
214,200 |
192,900 |
21,300 |
10.0% |
| TUOLUMNE |
20,120 |
19,060 |
1,060 |
5.3% |
| VENTURA |
410,800 |
392,200 |
18,600 |
4.5% |
| YOLO |
110,300 |
104,500 |
5,800 |
5.2% |
| YUBA |
32,600 |
30,300 |
2,300 |
6.9% |