NR No. 25-11
Contact: Loree Levy/Greg Lawson
916-654-9029
mediainquiries@edd.ca.gov
Important Note: Employment data for January 2025 comes from the survey week that included January 12 while February 2025 data will release March 28, 2025. Statistics released today reflect updates to initial 2024 monthly estimates as part of the annual benchmark revision.
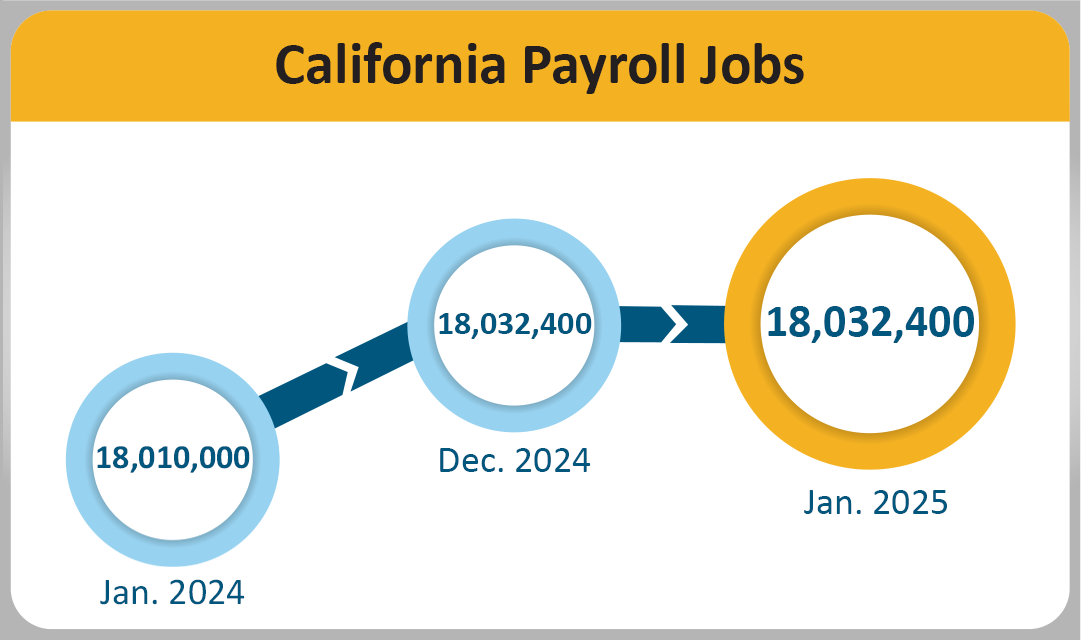
Nonfarm employment is unchanged at 18,032,400
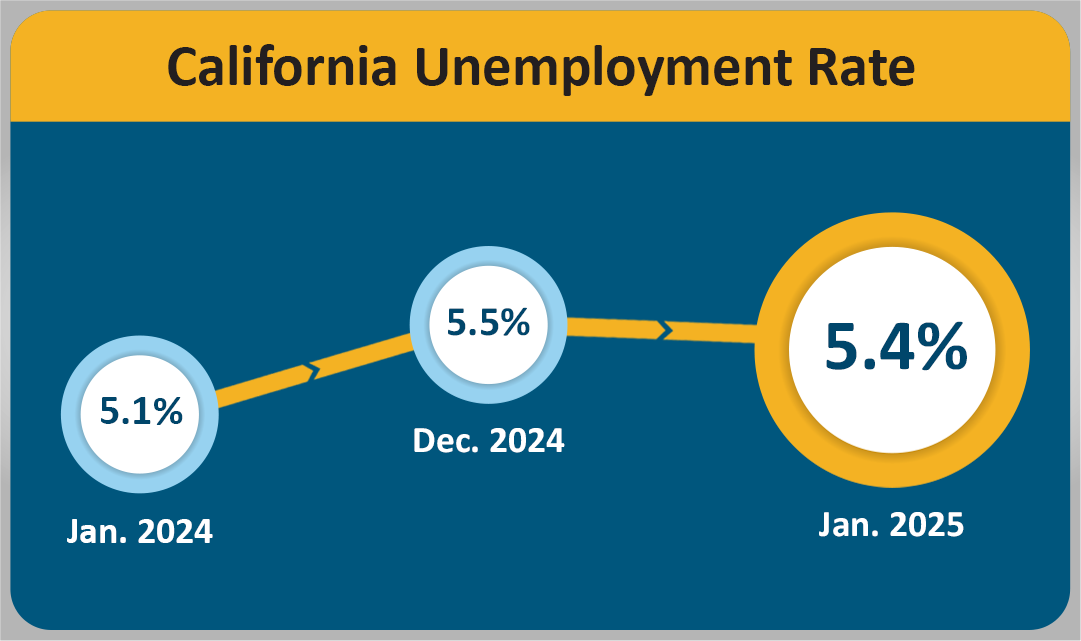
SACRAMENTO — California’s unemployment rate dropped to 5.4 percent1 in January 2025 while nonfarm payroll jobs2 remained unchanged from December 2024, according to data released today by the Employment Development Department (EDD) from two separate surveys. January’s job gain follows a post-benchmark, revised job gain of 39,000 for December 2024.
California's Labor Market, by the Numbers...
-
The job market expansion reached 57 months in January 2025. California gained 3,112,600 jobs since April 2020, averaging 54,607 jobs per month.
-
January 2025 marked the third consecutive month-over decline (-6,400) in unemployed people.
-
Five of California's 11 industry sectors gained jobs in January with Private Education and Health Services (+18,500) showing strength in health-related fields such as General Medicine and Surgical Hospitals, Continuing Care Retirement Communities and Assisted Living Facilities for the Elderly, and Individual and Family Services.
-
Trade, Transportation, & Utilities posted the largest month-over loss (-14,200) with declines in Wholesale Trade, Couriers and Messengers, and Warehousing and Storage.
1. The unemployment rate comes from a separate federal survey of 4,400 California households.
2. The nonfarm payroll job numbers come from a federal survey of 80,000 California businesses.
Data Trends about Jobs in the Economy
Total Nonfarm Payroll Jobs (Comes from a monthly survey, seasonally adjusted, of approximately 80,000 California businesses)
- Month-over — Nonfarm jobs in 11 major industries totaled 18,032,400 in January—a zero net gain from December. This followed December’s post-benchmark revision of 97,000 jobs, resulting in a month-over gain of 39,000 jobs in December.
- Year-over — Total nonfarm jobs increased by 22,400 (0.12 percent increase) from January 2024 to January 2025 and the U.S. had an annual gain of 2,018,000 (1.2 percent increase).
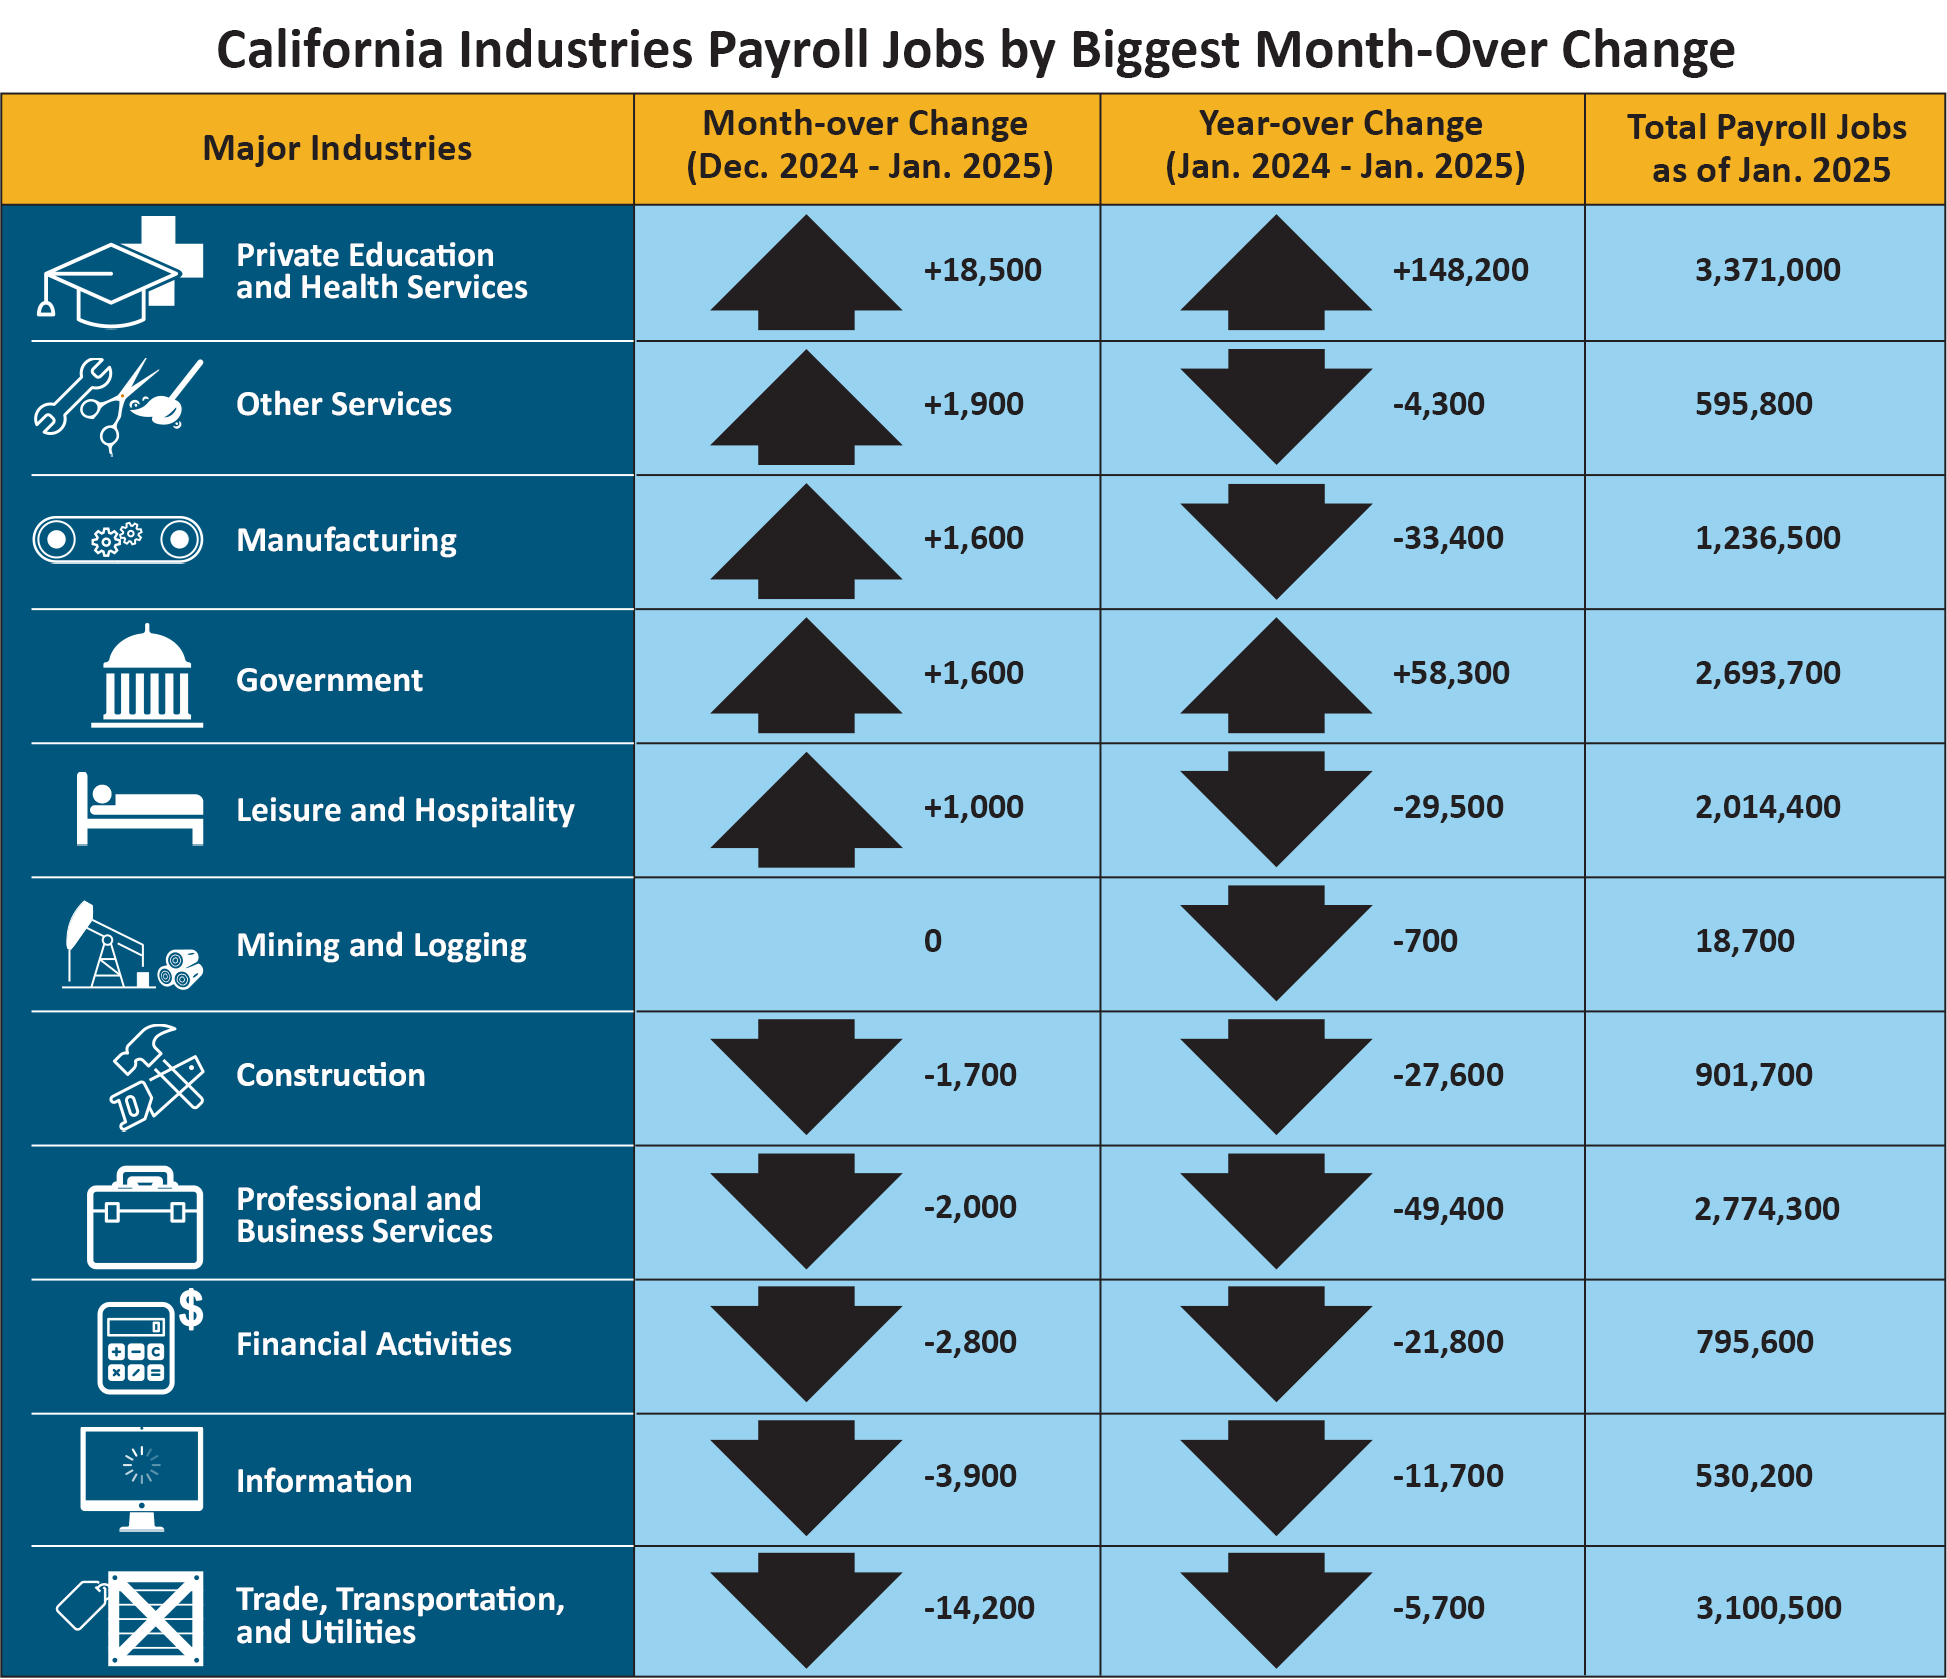
| Major Industries | Month-over Change (Dec. 2024–Jan. 2025) | Year-over Change (Jan. 2024–Jan. 2025) | Total Payroll Jobs as of Jan. 2025 |
|---|---|---|---|
|
Private Education and Health Services |
+18,500 | +148,200 | 3,371,000 |
|
Other Services |
+1,900 | -4,300 | 595,800 |
| Manufacturing | +1,600 | -33,400 | 1,236,500 |
| Government | +1,600 | +58,300 | 2,693,700 |
|
Leisure and Hospitality |
+1,000 | -29,500 | 2,014,400 |
|
Mining and Logging |
0 | -700 | 18,700 |
| Construction | -1,700 | -27,600 | 901,700 |
| Professional and Business Services | -2,000 | -49,400 | 2,774,300 |
| Financial Activities | -2,800 | -21,800 | 795,600 |
| Information | -3,900 | -11,700 | 530,200 |
| Trade, Transportation, and Utilities | -14,200 | -5,700 | 3,100,500 |
Total Farm Jobs — Agriculture industry jobs increased from December by 2,700 to 24,200 in January. Agriculture had 10,300 more farm jobs in January 2025 than January of last year.
Data Trends about Workers in the Economy
Employment and Unemployment in California (Based on a monthly federal survey of 5,100 California households which focuses on workers in the economy)
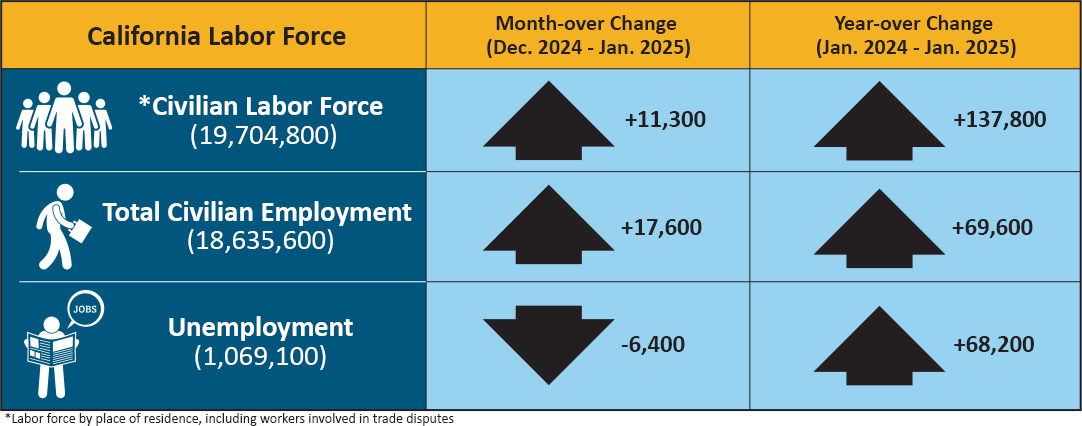
- Employed — The number of Californians employed in January was 18,635,600, an increase of 17,600 from December’s total of 18,618,000 and up 69,600 from January 2024.
- Unemployed — The number of unemployed Californians was 1,069,100 in January, a decrease of 6,400 over the month but up 68,200 compared to January 2024.
| California Labor Force | Month-over Change (December 2024 – January 2025) | Year-over Change (January 2024 – January 2025) |
|---|---|---|
| * Civilian Labor Force (19,704,800) | +11,300 | +137,800 |
| Total Civilian Employment (18,635,600) | +17,600 | +69,600 |
| Unemployment (1,069,100) | -6,400 | +68,200 |
* Labor force by place of residence, including workers involved in trade disputes.
Unemployment Insurance Claims (Not Seasonally Adjusted)
The following data is from a sample week that includes the 19th of each month:
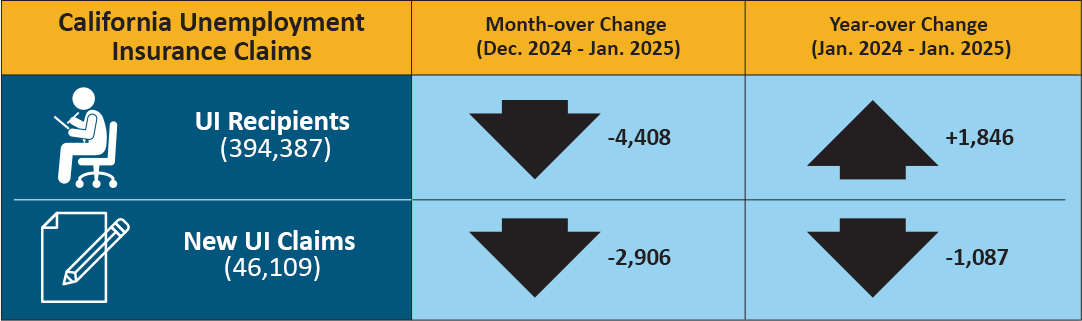
In related data that figures into the State’s unemployment rate, there were 394,387 people certifying for Unemployment Insurance (UI) benefits during the January 2025 sample week. That’s down from 398,795 people in December and up from 392,541 in January 2024. 46,109 initial claims were processed in the January 2024 sample week—a month-over decrease of 2,906 claims and a year-over decrease of 1,087 claims from January 2024.
| California Unemployment Insurance Claims | Month-over Change (December 2024–January 2025) | Year-over Change (January 2024 –January 2025) |
|---|---|---|
| UI Recipients (394,387) | -4,408 | +1,846 |
| New UI Claims (46,109) | -2,906 | -1,087 |
| COUNTY | LABOR FORCE | EMPLOYMENT | UNEMPLOYMENT | RATE |
|---|---|---|---|---|
| STATE TOTAL | 19,703,400 | 18,610,700 | 1,092,700 | 5.5% |
| ALAMEDA | 866,500 | 826,400 | 40,000 | 4.6% |
| ALPINE | 550 | 510 | 40 | 7.1% |
| AMADOR | 14,980 | 14,050 | 930 | 6.2% |
| BUTTE | 92,600 | 86,800 | 5,900 | 6.3% |
| CALAVERAS | 17,590 | 16,430 | 1,170 | 6.6% |
| COLUSA | 11,420 | 9,380 | 2,050 | 17.9% |
| CONTRA COSTA | 582,600 | 554,900 | 27,700 | 4.8% |
| DEL NORTE | 8,930 | 8,340 | 600 | 6.7% |
| EL DORADO | 91,100 | 86,400 | 4,600 | 5.1% |
| FRESNO | 475,800 | 434,900 | 40,900 | 8.6% |
| GLENN | 12,210 | 11,260 | 960 | 7.8% |
| HUMBOLDT | 60,300 | 56,900 | 3,400 | 5.6% |
| IMPERIAL | 73,500 | 60,300 | 13,200 | 17.9% |
| INYO | 8,300 | 7,890 | 400 | 4.8% |
| KERN | 412,700 | 375,700 | 3,700 | 9.0% |
| KINGS | 59,600 | 53,700 | 5,900 | 9.8% |
| LAKE | 26,660 | 24,520 | 2,130 | 8.0% |
| LASSEN | 8,150 | 7,560 | 590 | 7.2% |
| LOS ANGELES | 5,098,100 | 4,802,700 | 295,400 | 5.8% |
| MADERA | 70,420 | 64,450 | 5,970 | 8.5% |
| MARIN | 125,100 | 120,000 | 5,100 | 4.1% |
| MARIPOSA | 6,860 | 6,370 | 490 | 7.1% |
| MENDOCINO | 36,530 | 34,170 | 2,360 | 6.5% |
| MERCED | 122,200 | 108,800 | 13,400 | 11.0% |
| MODOC | 3,070 | 2,790 | 280 | 9.1% |
| MONO | 7,850 | 7,480 | 370 | 4.8% |
| MONTEREY | 215,800 | 194,100 | 21,800 | 10.1% |
| NAPA | 75,400 | 72,000 | 3,400 | 4.5% |
| NEVADA | 48,200 | 45,800 | 2,400 | 4.9% |
| ORANGE | 1,625,800 | 1,559,500 | 66,400 | 4.1% |
| PLACER | 206,370 | 197,470 | 8,900 | 4.3% |
| PLUMAS | 7,350 | 6,620 | 730 | 9.9% |
| RIVERSIDE | 1,193,100 | 1,129,300 | 63,800 | 5.3% |
| SACRAMENTO | 781,200 | 742,300 | 38,900 | 5.0% |
| SAN BENITO | 34,560 | 32,090 | 2,470 | 7.1% |
| SAN BERNARDINO | 1,038,400 | 984,100 | 54,300 | 5.2% |
| SAN DIEGO | 1,660,300 | 1,584,800 | 75,500 | 4.5% |
| SAN FRANCISCO | 510,500 | 489,900 | 20,700 | 4.0% |
| SAN JOAQUIN | 372,300 | 346,500 | 25,800 | 6.9% |
| SAN LUIS OBISPO | 132,400 | 126,600 | 5,800 | 4.4% |
| SAN MATEO | 417,600 | 401,700 | 15,900 | 3.8% |
| SANTA BARBARA | 217,500 | 205,800 | 11,700 | 5.4% |
| SANTA CLARA | 1,061,100 | 1,015,200 | 45,900 | 4.3% |
| SANTA CRUZ | 135,500 | 126,000 | 9,500 | 7.0% |
| SHASTA | 80,800 | 76,000 | 4,800 | 5.9% |
| SIERRA | 1,310 | 1,220 | 90 | 6.9% |
| SISKIYOU | 16,140 | 14,720 | 1,420 | 8.8% |
| SOLANO | 216,800 | 205,100 | 11,700 | 5.4% |
| SONOMA | 246,700 | 235,600 | 11,100 | 4.5% |
| STANISLAUS | 257,600 | 238,600 | 19,000 | 7.4% |
| SUTTER | 45,900 | 41,440 | 4,460 | 9.7% |
| TEHAMA | 26,940 | 25,050 | 1,890 | 7.0% |
| TRINITY | 5,390 | 5,030 | 370 | 6.8% |
| TULARE | 224,200 | 200,000 | 24,300 | 10.8% |
| TUOLUMNE | 21,800 | 20,530 | 1,270 | 5.8% |
| VENTURA | 419,700 | 398,800 | 20,900 | 5.0% |
| YOLO | 111,820 | 105,050 | 6,780 | 6.1% |
| YUBA | 36,020 | 33,390 | 2,630 | 7.3% |