Employers Shed 1,700 Jobs
Important Note: The employment data for the month of December 2025 comes from the survey week that included December 12. The release date for January 2026 data has not yet been finalized as the Department awaits access to data from the U.S. Department of Labor’s Bureau of Labor Statistics.
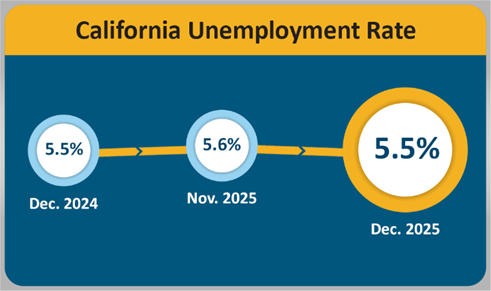
SACRAMENTO — California’s unemployment rate came in at 5.5%1 in December 2025, which is a decrease from the revised rate of 5.6% posted for November. In addition, the State’s employers lost 1,700 nonfarm payroll jobs2. These recent data points released by the Employment Development Department (EDD) come from two separate surveys. Total nonfarm employment for November was revised down (-2,000) to a total gain of 30,500 jobs. November’s initial estimate of a 5.5% unemployment rate was revised up by 0.1 percentage point due to an increase in unemployment.
California's Labor Market, by the Numbers...
- California’s unemployment rate declined by 0.1 percentage point over the month, matching the national change. However, the State’s unemployment rate has held steady year-over while the nation’s rate increased by 0.3 percentage point.
- The total number of people unemployed declined for the second consecutive month after previously experiencing six consecutive months of gains (April 2025 - September 2025).
- December’s year-over nonfarm job loss (-11,200) marks the first year-over decrease since March 2021.
- Five of California's 11 industry sectors gained jobs in December, with Private Education and Health Services (+5,000) showing gains for the 47th consecutive month as California’s population continues to age. The industry saw gains posted in Hospitals and Social Assistance.
- Government (+4,500) saw the second largest month-over Increase due, in part, to gains in Local Government (+3,900) as well as from above average gains in State Government Educational Services.
- Construction (-5,000) experienced the largest month-over decline driven largely by very wet weather throughout the month with above average losses in Utility System Construction and Building Finishing Contractors.
1. The unemployment rate comes from a separate federal survey of 4,400 California households.
2. The nonfarm payroll job numbers come from a federal survey of 80,000 California businesses.
Data Trends about Jobs in the Economy
Total Nonfarm Payroll Jobs (Comes from a monthly survey of approximately 80,000 California businesses that estimates jobs in the economy – seasonally adjusted)
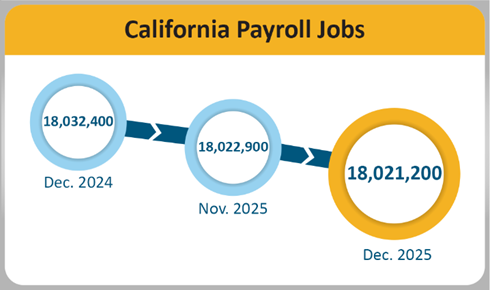
- Month-over — Total nonfarm jobs in California’s 11 major industries amounted to 18,021,200 in December – a loss of 1,700 from November. This followed November’s downward revision of 2,000 jobs, resulting in a month-over November gain of 30,500 jobs.
- Year-over — Total nonfarm jobs decreased by 11,200 (0.1% decrease) from December 2024 to December 2025 compared to the U.S. year-over gain of 584,000 jobs (a 0.4% increase).
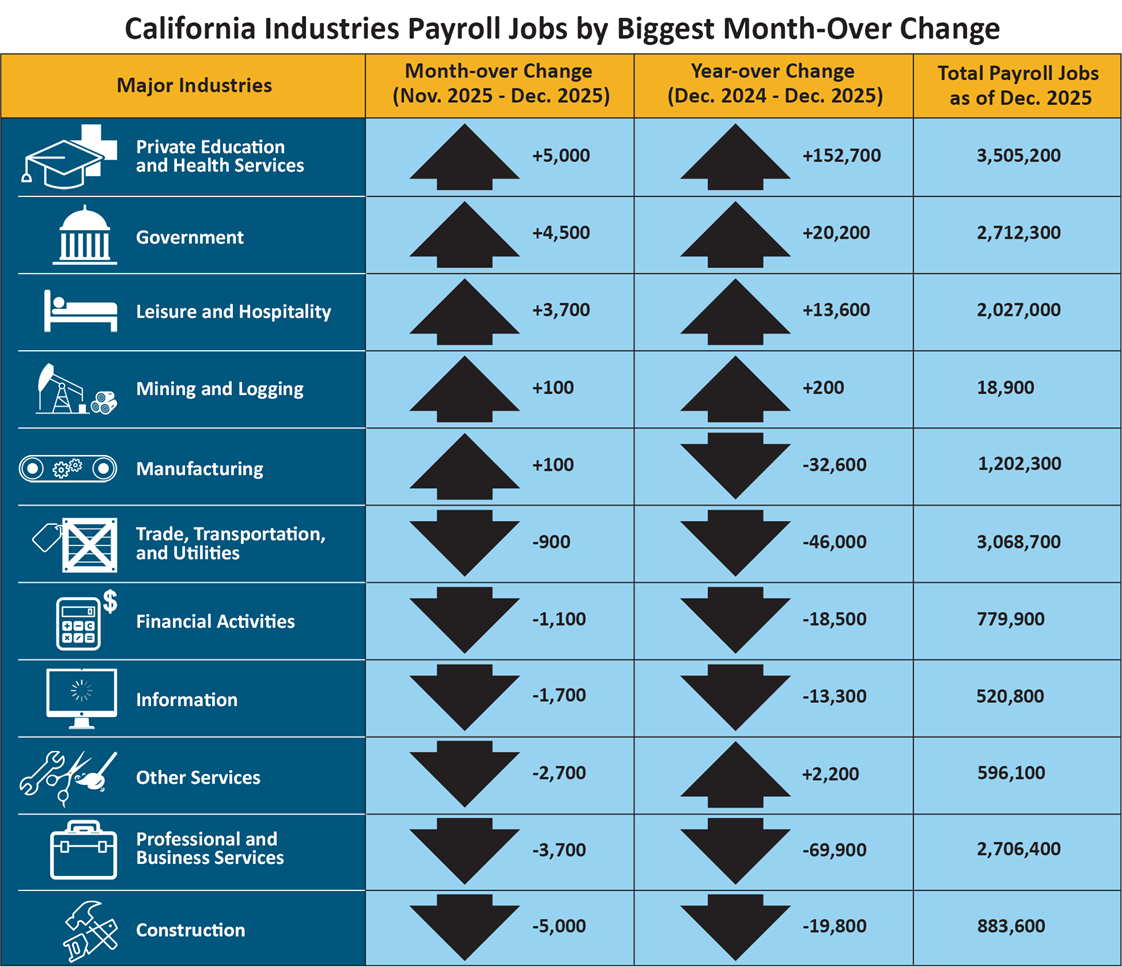
| Major Industries | Month-over Change (Nov. 2025 - Dec. 2025) |
Year-over Change (Dec. 2024 - Dec. 2025) |
Total Payroll Jobs as of Dec. 2025 |
|---|---|---|---|
|
Private Education and Health Services |
+5,000 | +152,700 | 3,505,200 |
|
Government |
+4,500 | +20,200 | 2,712,300 |
| Leisure and Hospitality | +3,700 | +13,600 | 2,027,000 |
|
Mining and Logging |
+100 | +200 | 18,900 |
|
Manufacturing |
+100 | -32,600 | 1,202,300 |
|
Trade, Transportation, and Utilities |
-900 | -46,000 | 3,068,700 |
|
Financial Activities |
-1,100 | -18,500 | 779,900 |
| Information | -1,700 | -13,300 | 520,800 |
|
Other Services |
-2,700 | +2,200 | 596,100 |
|
Professional and Business Services |
-3,700 | -69,900 | 2,706,400 |
|
Construction |
-5,000 | -19,800 | 883,600 |
Total Farm Jobs — The number of jobs in the agriculture industry decreased from November by 3,400 to a total of 425,100 jobs in December. The agriculture industry had 3,600 more farm jobs in December 2025 than it did in December 2024.
Data Trends about Workers in the Economy
Employment and Unemployment in California (Based on a monthly federal survey of 4,400 California households which focuses on workers in the economy)
- Employed — The number of Californians employed in December was 18,839,100, up 37,800 from November and up 221,100 compared to December of last year.
- Unemployed — The number of unemployed Californians was 1,096,100 in December, a decrease of 8,800 from November, but an increase of 20,600 from December 2024.
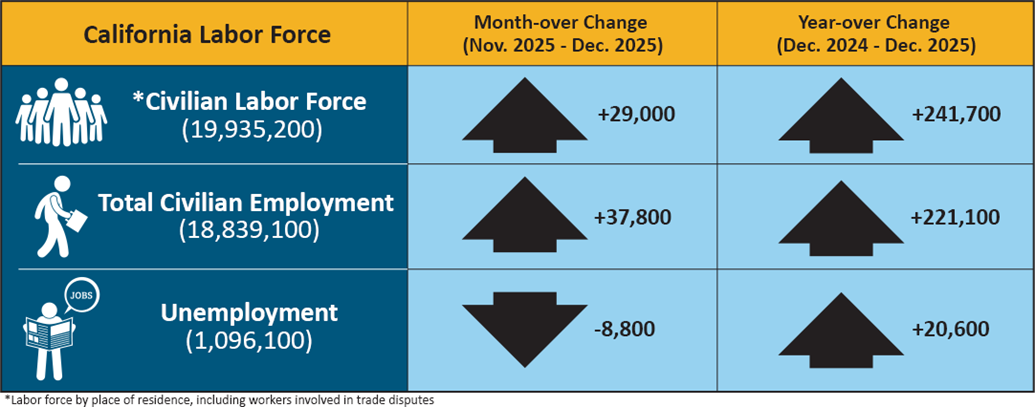
| California Labor Force | Month-over Change (November 2025 – December 2025) | Year-over Change (December 2024 – December 2025) |
|---|---|---|
| * Civilian Labor Force (19,935,200) | +29,000 | +241,700 |
| Total Civilian Employment (18,839,100) | +37,800 | +221,100 |
| Unemployment (1,096,100) | -8,800 | +20,600 |
* Labor force by place of residence, including workers involved in trade disputes.
Unemployment Insurance Claims (Not Seasonally Adjusted)
The following data is from a sample week that includes the 19th of each month:
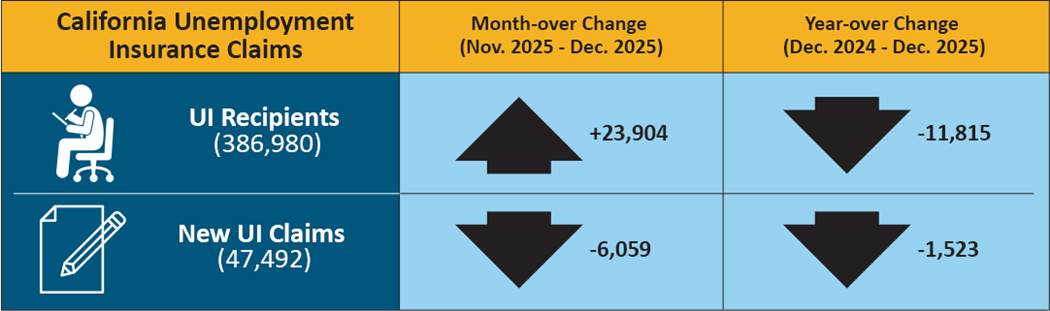
In related data that figures into the State’s unemployment rate, there were 386,980 people certifying for Unemployment Insurance (UI) benefits during the December 2025 sample week. That compares to 363,076 people in November and 398,795 people in December 2024. Concurrently, 47,492 initial claims were processed in the December 2025 sample week, which was a month-over decrease of 6,059 claims from November and a year-over decrease of 1,523 claims from December 2024.
| California Unemployment Insurance Claims | Month-over Change (November 2025 – December 2025) | Year-over Change (December 2024 – December 2025) |
|---|---|---|
| UI Recipients (386,980) | +23,904 | -11,815 |
| New UI Claims (47,492) | -6,059 | -1,523 |
| COUNTY | LABOR FORCE | EMPLOYMENT | UNEMPLOYMENT | RATE |
|---|---|---|---|---|
| STATE TOTAL |
19,867,300 |
18,846,500 |
1,020,800 |
5.1% |
| ALAMEDA |
867,700 |
829,500 |
38,200 |
4.4% |
| ALPINE |
490 |
460 |
40 |
7.1% |
| AMADOR |
15,110 |
14,230 |
890 |
5.9% |
| BUTTE |
93,500 |
88,100 |
5,400 |
5.8% |
| CALAVERAS |
17,550 |
16,470 |
1,080 |
6.2% |
| COLUSA |
11,710 |
10,060 |
1,640 |
14.0% |
| CONTRA COSTA |
583,000 |
556,700 |
26,300 |
4.5% |
| DEL NORTE |
8,810 |
8,190 |
620 |
7.0% |
| EL DORADO |
91,300 |
86,900 |
4,400 |
4.8% |
| FRESNO |
477,800 |
438,600 |
39,200 |
8.2% |
| GLENN |
12,000 |
11,160 |
830 |
7.0% |
| HUMBOLDT |
60,200 |
57,100 |
3,100 |
5.1% |
| IMPERIAL |
75,200 |
61,200 |
14,000 |
18.6% |
| INYO |
8,340 |
7,960 |
380 |
4.6% |
| KERN |
416,300 |
381,600 |
34,600 |
8.3% |
| KINGS |
59,500 |
54,100 |
5,400 |
9.1% |
| LAKE |
26,310 |
24,290 |
2,020 |
7.7% |
| LASSEN |
8,140 |
7,620 |
530 |
6.5% |
| LOS ANGELES |
5,148,900 |
4,889,600 |
259,300 |
5.0% |
| MADERA |
70,200 |
64,700 |
5,500 |
7.8% |
| MARIN |
125,100 |
120,100 |
5,000 |
4.0% |
| MARIPOSA |
7,280 |
6,840 |
440 |
6.1% |
| MENDOCINO |
36,780 |
34,680 |
2,110 |
5.7% |
| MERCED |
122,600 |
110,900 |
11,800 |
9.6% |
| MODOC |
3,200 |
2,960 |
250 |
7.6% |
| MONO |
8,330 |
7,960 |
370 |
4.4% |
| MONTEREY |
214,700 |
195,200 |
19,500 |
9.1% |
| NAPA |
75,200 |
72,000 |
3,200 |
4.3% |
| NEVADA |
47,730 |
45,490 |
2,240 |
4.7% |
| ORANGE |
1,642,400 |
1,578,400 |
64,000 |
3.9% |
| PLACER |
207,300 |
198,600 |
8,600 |
4.2% |
| PLUMAS |
7,380 |
6,740 |
630 |
8.6% |
| RIVERSIDE |
1,211,200 |
1,148,100 |
63,100 |
5.2% |
| SACRAMENTO |
785,300 |
746,900 |
38,400 |
4.9% |
| SAN BENITO |
34,700 |
32,400 |
2,200 |
6.5% |
| SAN BERNARDINO |
1,054,700 |
1,001,600 |
53,000 |
5.0% |
| SAN DIEGO |
1,678,900 |
1,604,800 |
74,100 |
4.4% |
| SAN FRANCISCO |
512,700 |
493,500 |
19,200 |
3.8% |
| SAN JOAQUIN |
379,600 |
355,500 |
24,100 |
6.4% |
| SAN LUIS OBISPO |
131,700 |
126,000 |
5,700 |
4.3% |
| SAN MATEO |
419,600 |
404,700 |
14,900 |
3.5% |
| SANTA BARBARA |
221,500 |
210,700 |
10,700 |
4.9% |
| SANTA CLARA |
1,031,500 |
990,600 |
40,800 |
4.0% |
| SANTA CRUZ |
137,400 |
128,600 |
8,800 |
6.4% |
| SHASTA |
81,200 |
77,000 |
4,200 |
5.2% |
| SIERRA |
1,420 |
1,340 |
80 |
5.7% |
| SISKIYOU |
16,600 |
15,310 |
1,290 |
7.7% |
| SOLANO |
215,900 |
204,700 |
11,200 |
5.2% |
| SONOMA |
247,800 |
237,300 |
10,500 |
4.2% |
| STANISLAUS |
259,200 |
241,700 |
17,500 |
6.8% |
| SUTTER |
46,600 |
42,500 |
4,100 |
8.9% |
| TEHAMA |
27,160 |
25,520 |
1,650 |
6.1% |
| TRINITY |
5,500 |
5,180 |
320 |
5.8% |
| TULARE |
223,800 |
200,900 |
22,900 |
10.2% |
| TUOLUMNE |
22,440 |
21,280 |
1,170 |
5.2% |
| VENTURA |
422,000 |
402,000 |
20,000 |
4.7% |
| YOLO |
112,300 |
105,800 |
6,500 |
5.8% |
| YUBA |
36,700 |
34,200 |
2,400 |
6.6% |