Unemployment Rate Remains Steady at 5.5 Percent
Important Note: The employment data for the month of August 2025 comes from the survey week that included August 12. Data for September is scheduled for release on October 17, 2025.
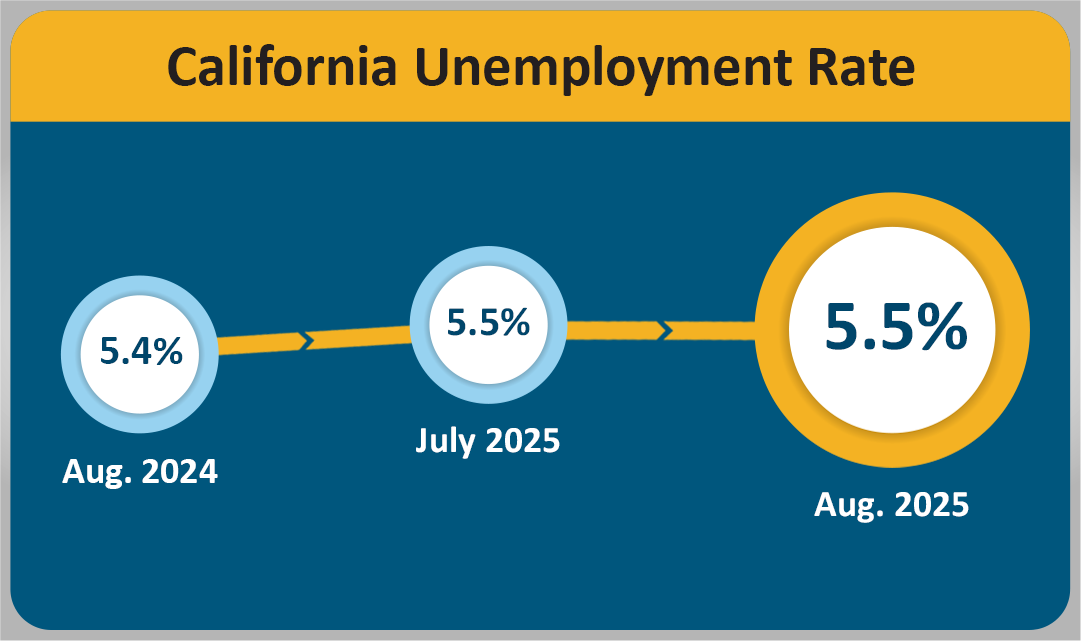
SACRAMENTO — California gained 3,800 nonfarm payroll jobs1 in August 2025 as the State’s unemployment rate held steady at 5.5 percent2, according to the latest Employment Development Department (EDD) data that comes from two separate surveys. August’s job gain follows a downward-revised job loss of 300 for July 2025. The majority of the revision was centered in Government, which was revised downward by 8,100 jobs when more information came in after the survey week. A big part of that decline came from Local Government reporting a loss of 7,600 jobs.
California's Labor Market, by the Numbers...
- California’s gain of 3,800 jobs accounted for 17.3 percent of the nation’s overall August gain of 22,000 jobs, which is notably stronger than California’s 11.3 percent share of jobs nationally.
- California’s unemployment rate had no change from July to August, while the nation’s rate increased by 0.1 percentage point.
- California has gained 3,091,400 jobs since April 2020, an average of 48,303 per month. The State has gained 69,500 jobs year-over, though the State has experienced month-over job losses in five of the past eight months.
- Six of California's 11 industry sectors gained jobs in August, with Private Education and Health Services (+9,800) showing gains for the 43rd consecutive month with notable gains in Offices of Physicians, Home Health Care Services, and similar fields. These gains are partly due to California’s aging population.
- Leisure & Hospitality (+9,300) also posted a month-over job gain with higher-than-expected gains in Performing Arts, Spectator Sports, and Related Activities (+4,900) thanks to an increase in tourism across the State.
- Government (-7,600) posted the State’s largest month-over loss with the biggest decline in State Government (-12,300). Local Government (+5,800) gained jobs in August, while Federal Government (-1,100) lost jobs in California, including at the US Postal Service; and the Departments of Agriculture, Veterans Affairs, and the Interior.
1. The nonfarm payroll job numbers come from a federal survey of 80,000 California businesses.
2. The unemployment rate comes from a separate federal survey of 4,400 California households.
Data Trends about Jobs in the Economy
Total Nonfarm Payroll Jobs (Comes from a monthly survey of approximately 80,000 California businesses that estimates jobs in the economy – seasonally adjusted)
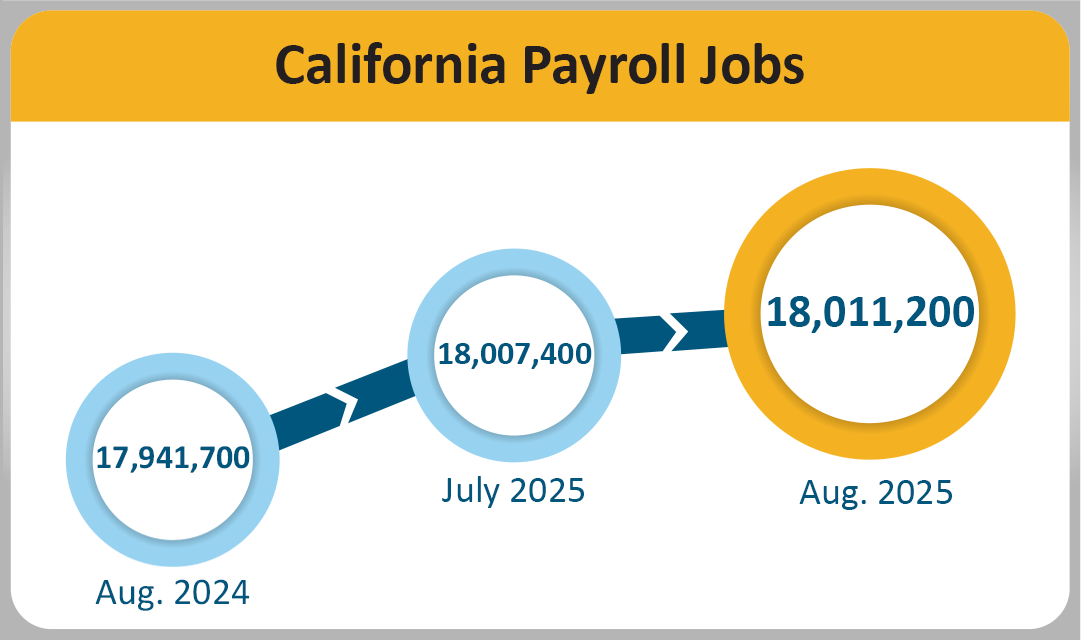
- Month-over — Total nonfarm jobs in California’s 11 major industries amounted to 18,011,200 in August – a gain of 3,800 from July. This followed July’s downward revision of 15,300 jobs, resulting in a month-over July loss of 300 jobs.
- Year-over — Total nonfarm jobs increased by 69,500 (0.4 percent increase) from August 2024 to August 2025 compared to the U.S. annual gains of 1,466,000 jobs (a 0.9 percent increase).
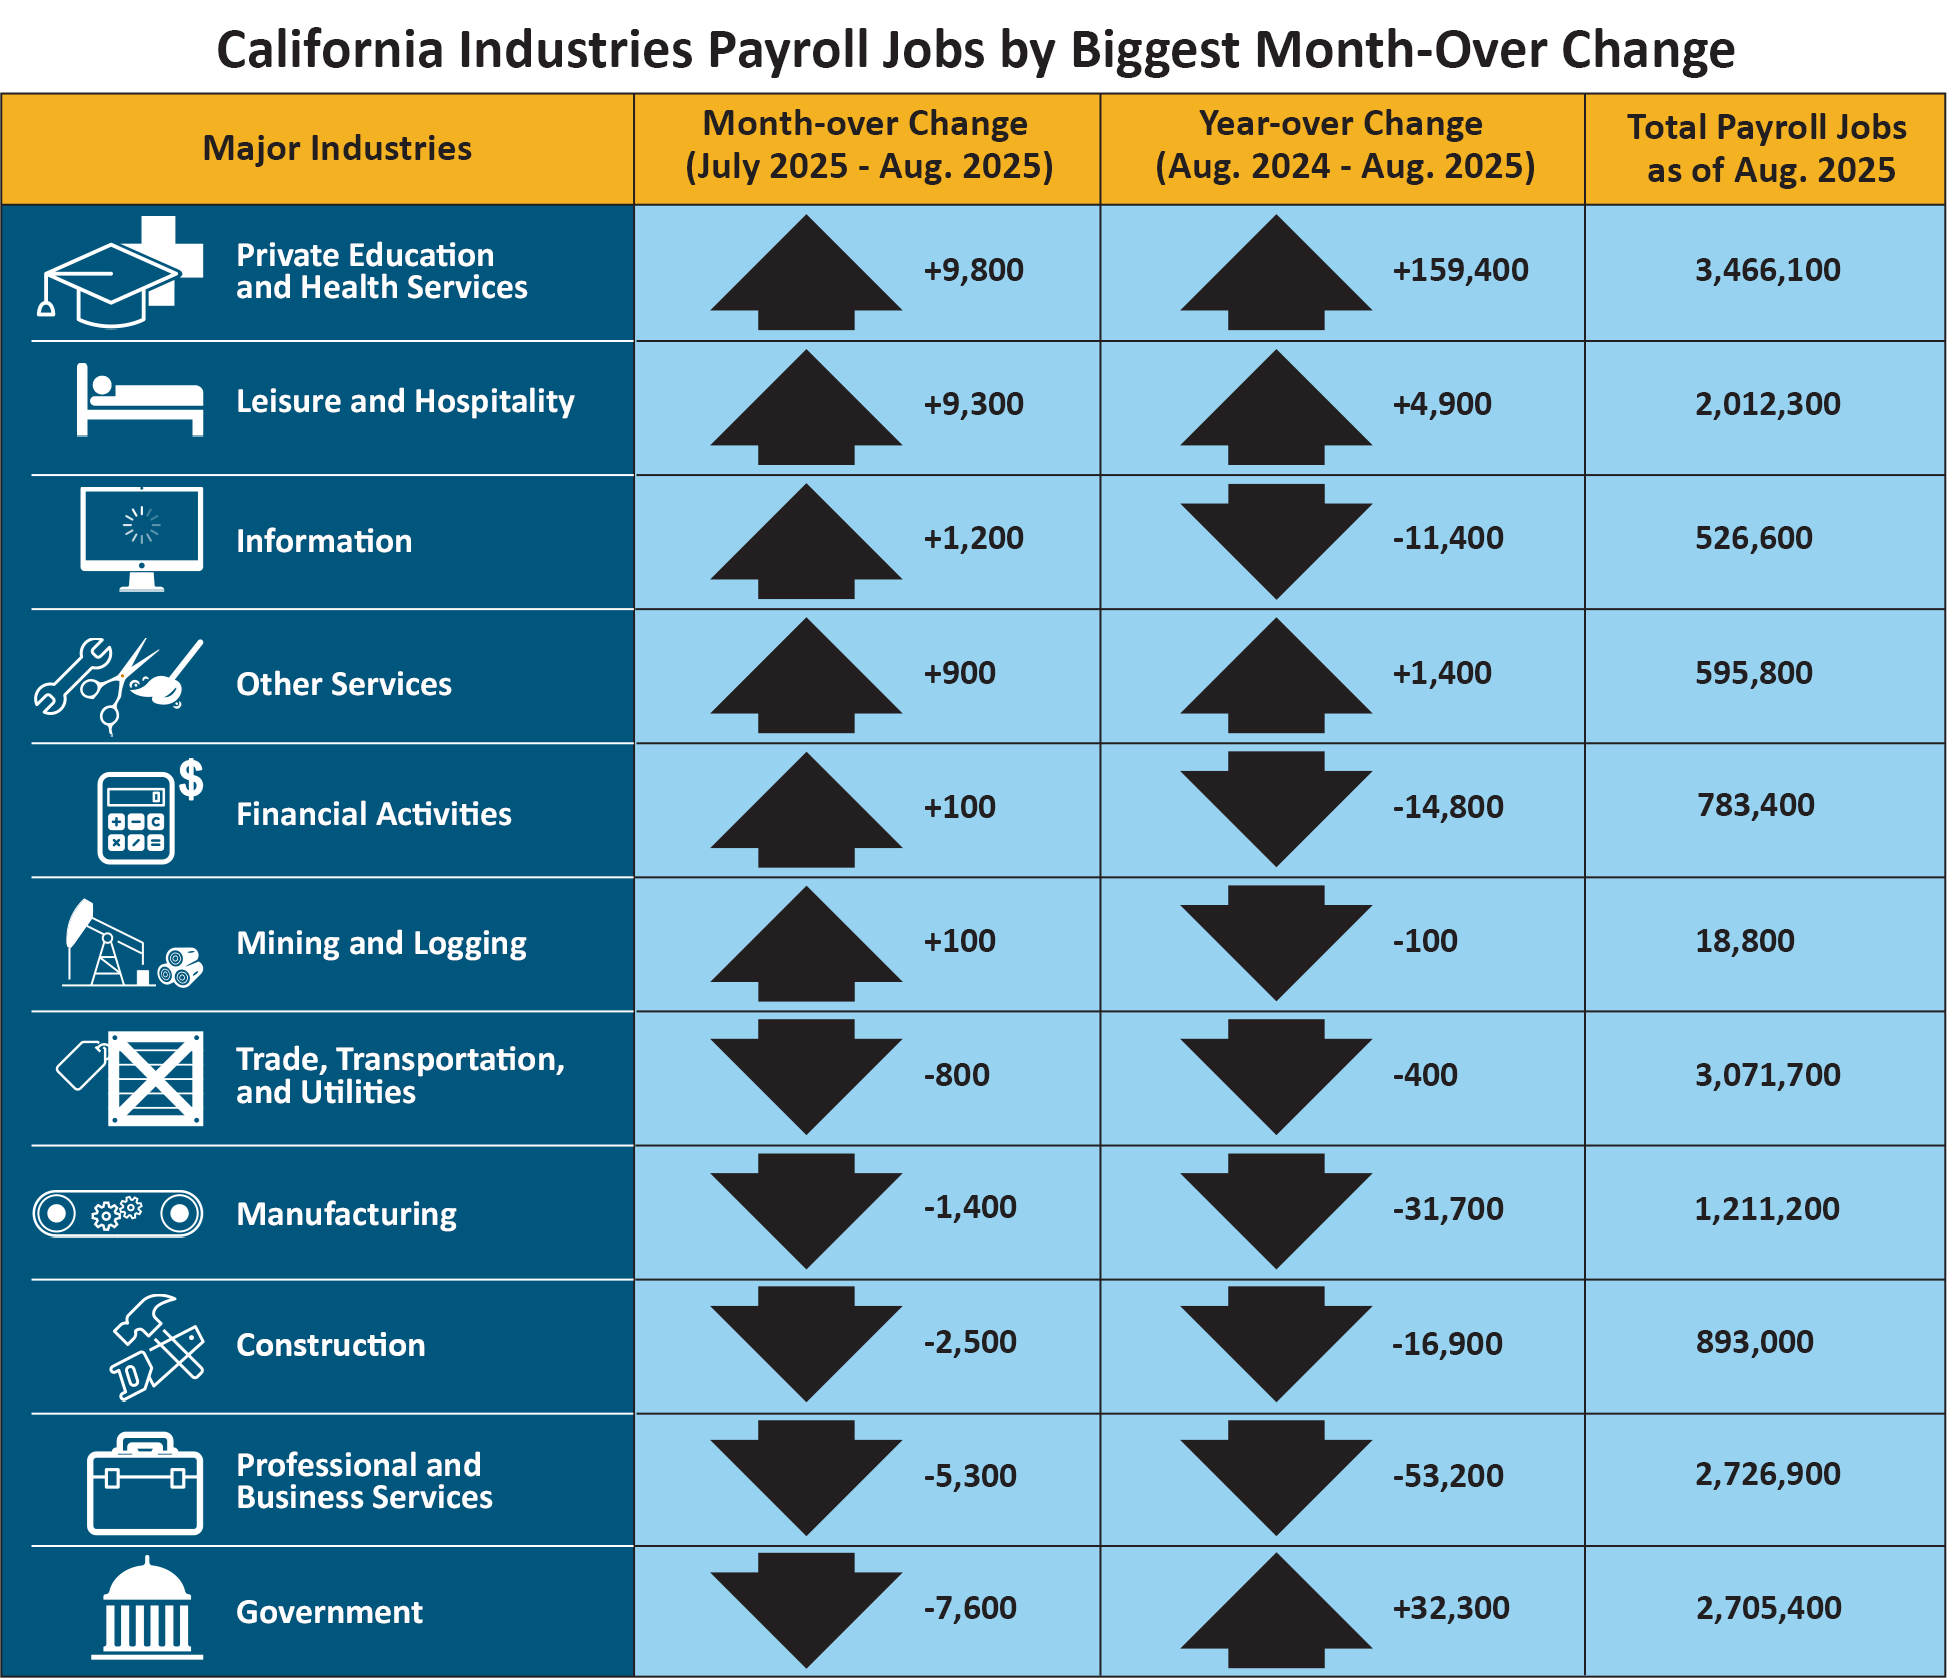
| Major Industries | Month-over Change (July 2025 - August 2025) |
Year-over Change (August 2024 - August 2025) |
Total Payroll Jobs as of August 2025 |
|---|---|---|---|
| Private Education and Health Services | +9,800 | +159,400 | 3,466,100 |
|
Leisure and Hospitality |
+9,300 | +4,900 | 2,012,300 |
|
Information |
+1,200 | -11,400 | 526,600 |
|
Other Services |
+900 | +1,400 | 595,800 |
|
Financial Activities |
+100 | -14,800 | 783,400 |
|
Mining and Logging |
+100 | -100 | 18,800 |
|
Trade, Transportation, and Utilities |
-800 | -400 | 3,071,700 |
| Manufacturing | -1,400 | -31,700 | 1,211,200 |
|
Construction |
-2,500 | -16,900 | 893,000 |
| Professional and Business Services | -5,300 | -53,200 | 2,726,900 |
| Government | -7,600 | +32,300 | 2,705,400 |
Total Farm Jobs – The number of jobs in the agriculture industry decreased by 4,800 jobs month-over to a total of 419,900 jobs in August, due in part to federal tariffs affecting agriculture industries as well as the winding-down of the harvesting season. The agriculture industry had 13,300 more farm jobs in August 2025 than it did in August of last year.
Data Trends about Workers in the Economy
Employment and Unemployment in California (Based on a monthly federal survey of 4,400 California households which focuses on workers in the economy)
- Employed – The number of Californians employed in August was 18,763,300, a gain of 1,100 persons from July’s total of 18,762,200 and up 137,900 from the employment total in August 2024.
- Unemployed – The number of unemployed Californians was 1,094,700 in August, an increase of 5,700 over the month and up 25,600 in comparison to August 2024.
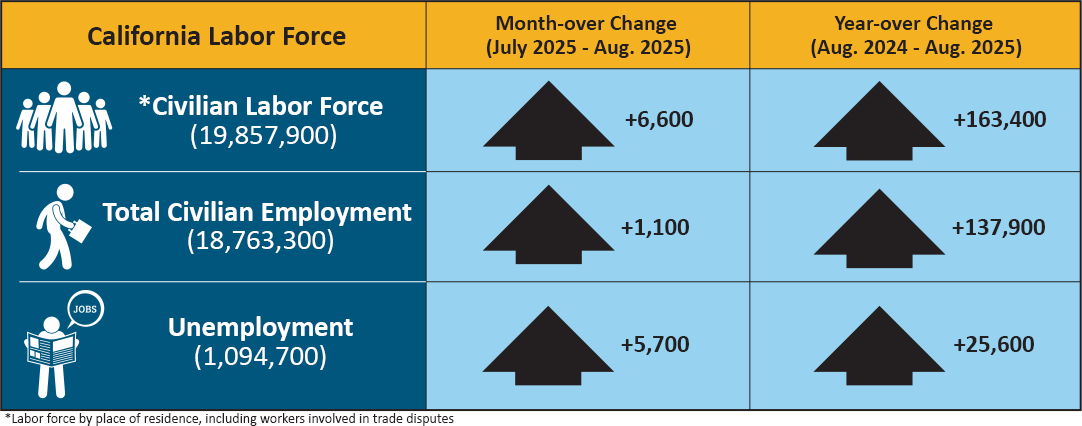
| California Labor Force | Month-over Change (July 2025 – August 2025) | Year-over Change (August 2024 – August 2025) |
|---|---|---|
| * Civilian Labor Force (19,857,900) | +6,600 | +163,400 |
| Total Civilian Employment (18,763,300) | +1,100 | +137,900 |
| Unemployment (1,094,700) | +5,700 | +25,600 |
* Labor force by place of residence, including workers involved in trade disputes.
Unemployment Insurance Claims (Not Seasonally Adjusted)
The following data is from a sample week that includes the 19th of each month:
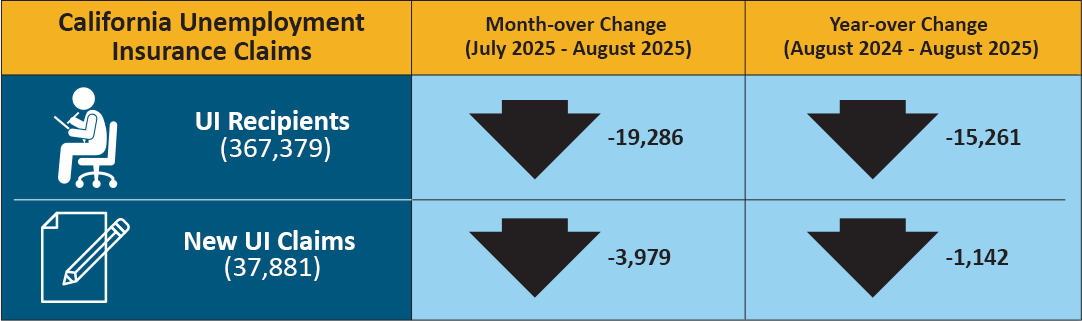
In related data that figures into the State’s unemployment rate, there were 367,379 people certifying for Unemployment Insurance (UI) benefits during the August 2025 sample week. That compares to 386,665 people in July and 382,640 people in August 2024. Concurrently, 37,881 initial claims were processed in the August 2025 sample week, which was a month-over decrease of 3,979 claims from July and a year-over decrease of 1,142 claims from August 2024.
| California Unemployment Insurance Claims | Month-over Change (July 2025 – August 2025) | Year-over Change (August 2024 – August 2025) |
|---|---|---|
| UI Recipients (367,379) | -19,286 | -15,261 |
| New UI Claims (37,881) | -3,979 | -1,142 |
| COUNTY | LABOR FORCE | EMPLOYMENT | UNEMPLOYMENT | RATE |
|---|---|---|---|---|
| STATE TOTAL |
19,939,500 |
18,776,300 |
1,163,200 |
5.8% |
| ALAMEDA |
873,800 |
829,500 |
44,300 |
5.1% |
| ALPINE |
390 |
350 |
40 |
9.0% |
| AMADOR |
15,420 |
14,480 |
940 |
6.1% |
| BUTTE |
93,000 |
87,100 |
5,900 |
6.3% |
| CALAVERAS |
17,980 |
16,810 |
1,180 |
6.6% |
| COLUSA |
11,860 |
10,770 |
1,090 |
9.2% |
| CONTRA COSTA |
587,400 |
556,900 |
30,500 |
5.2% |
| DEL NORTE |
9,060 |
8,470 |
590 |
6.5% |
| EL DORADO |
91,900 |
87,100 |
4,700 |
5.2% |
| FRESNO |
479,500 |
441,200 |
38,300 |
8.0% |
| GLENN |
12,070 |
11,190 |
880 |
7.3% |
| HUMBOLDT |
59,700 |
56,300 |
3,400 |
5.8% |
| IMPERIAL |
76,400 |
60,000 |
16,400 |
21.5% |
| INYO |
8,660 |
8,260 |
400 |
4.6% |
| KERN |
421,700 |
385,700 |
36,000 |
8.5% |
| KINGS |
59,100 |
53,900 |
5,200 |
8.9% |
| LAKE |
26,990 |
25,060 |
1,930 |
7.2% |
| LASSEN |
8,290 |
7,780 |
510 |
6.2% |
| LOS ANGELES |
5,127,500 |
4,802,800 |
324,700 |
6.3% |
| MADERA |
71,600 |
66,300 |
5,300 |
7.4% |
| MARIN |
127,200 |
121,400 |
5,800 |
4.6% |
| MARIPOSA |
7,860 |
7,440 |
420 |
5.3% |
| MENDOCINO |
37,590 |
35,410 |
2,180 |
5.8% |
| MERCED |
122,400 |
110,900 |
11,500 |
9.4% |
| MODOC |
3,330 |
3,140 |
190 |
5.8% |
| MONO |
8,920 |
8,550 |
370 |
4.1% |
| MONTEREY |
235,100 |
221,600 |
13,500 |
5.7% |
| NAPA |
78,100 |
74,700 |
3,300 |
4.3% |
| NEVADA |
48,460 |
46,010 |
2,450 |
5.1% |
| ORANGE |
1,651,500 |
1,576,200 |
75,300 |
4.6% |
| PLACER |
208,700 |
198,900 |
9,800 |
4.7% |
| PLUMAS |
8,020 |
7,530 |
490 |
6.1% |
| RIVERSIDE |
1,204,900 |
1,129,300 |
75,600 |
6.3% |
| SACRAMENTO |
791,800 |
748,400 |
43,400 |
5.5% |
| SAN BENITO |
34,700 |
32,500 |
2,200 |
6.3% |
| SAN BERNARDINO |
1,047,800 |
986,100 |
61,700 |
5.9% |
| SAN DIEGO |
1,681,500 |
1,597,100 |
84,400 |
5.0% |
| SAN FRANCISCO |
515,000 |
492,800 |
22,200 |
4.3% |
| SAN JOAQUIN |
376,800 |
351,400 |
25,400 |
6.8% |
| SAN LUIS OBISPO |
133,800 |
127,100 |
6,700 |
5.0% |
| SAN MATEO |
421,500 |
404,100 |
17,400 |
4.1% |
| SANTA BARBARA |
227,400 |
216,600 |
10,800 |
4.7% |
| SANTA CLARA |
1,038,600 |
990,700 |
47,900 |
4.6% |
| SANTA CRUZ |
140,700 |
132,900 |
7,900 |
5.6% |
| SHASTA |
80,700 |
76,300 |
4,500 |
5.5% |
| SIERRA |
1,510 |
1,440 |
70 |
4.8% |
| SISKIYOU |
17,000 |
15,850 |
1,150 |
6.7% |
| SOLANO |
218,100 |
205,500 |
12,600 |
5.8% |
| SONOMA |
251,800 |
239,900 |
11,900 |
4.7% |
| STANISLAUS |
261,400 |
243,200 |
18,200 |
7.0% |
| SUTTER |
47,800 |
44,200 |
3,600 |
7.6% |
| TEHAMA |
27,740 |
25,930 |
1,810 |
6.5% |
| TRINITY |
5,780 |
5,450 |
330 |
5.7% |
| TULARE |
224,800 |
201,600 |
23,200 |
10.3% |
| TUOLUMNE |
22,890 |
21,640 |
1,250 |
5.5% |
| VENTURA |
425,500 |
403,200 |
22,300 |
5.2% |
| YOLO |
113,800 |
107,100 |
6,600 |
5.8% |
| YUBA |
36,800 |
34,200 |
2,500 |
6.9% |