NR No. 25-20
Contact: Loree Levy/Greg Lawson
916-654-9029
mediainquiries@edd.ca.gov
Employers added 17,700 jobs over the month
Important Note: The employment data for the month of April 2025 comes from the survey week that included April 12. Data for May is scheduled for release on June 20, 2025.
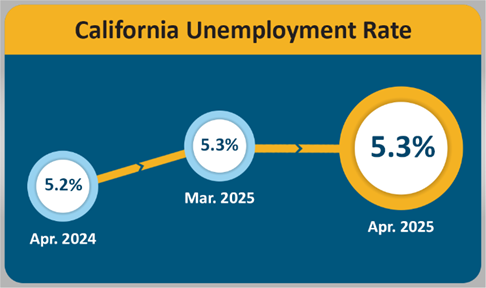
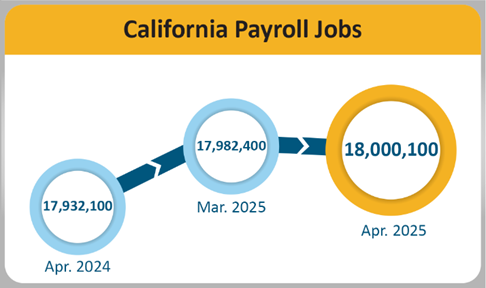
SACRAMENTO — California’s unemployment rate stayed at 5.3 percent1 and California’s nonfarm payroll jobs2 increased by 17,700 jobs in April 2025, according to the latest Employment Development Department (EDD) data coming from two separate surveys. April’s job gain follows a revised job loss of 6,800 for March 2025.
California's Labor Market, by the Numbers...
- Since April 2024, California’s unemployment rate has increased by 0.1 percent, compared to the national unemployment rate, which has increased by 0.3 percent over the same period.
- In the five years since the State started rebounding from the COVID-19 pandemic in April 2020, California has gained 3,080,300 jobs, an average of 51,338 per month.
- Five of California's 11 industry sectors gained jobs in April, with Private Education and Health Services (+9,400) posting a gain for the 39th straight month. The largest gains in Health Care and Social Assistance (+8,100) subsectors include job increases in fields like nursing, partly due to California’s aging population, which has driven more demand for medical services.
- Government (+4,500) also posted a month-over job gain with the largest increase coming from Local Government (+3,400). State Government (+1,300) also increased, while Federal Government (-200) lost jobs in April.
- Professional and Business Services (-2,400) posted the State’s largest month-over loss with the majority of the losses coming from Employment Services, which typically represents a slowdown in the hiring of temporary workers.
1. The unemployment rate comes from a separate federal survey of 4,400 California households.
2. The nonfarm payroll job numbers come from a federal survey of 80,000 California businesses.
Data Trends about Jobs in the Economy
Total Nonfarm Payroll Jobs (Comes from a monthly survey of approximately 80,000 California businesses that estimates jobs in the economy — seasonally adjusted)
- Month-over — Total nonfarm jobs in California’s 11 major industries amounted to 18,000,100 in April — a gain of 17,700 from March. This followed March’s upward revision of 4,800 jobs, resulting in a month-over March loss of 6,800 jobs.
- Year-over — Total nonfarm jobs increased by 68,000 (a 0.4 percent increase) from April 2024 to April 2025 compared to the U.S. annual gain of 1,882,000 jobs (a 1.2 percent increase).
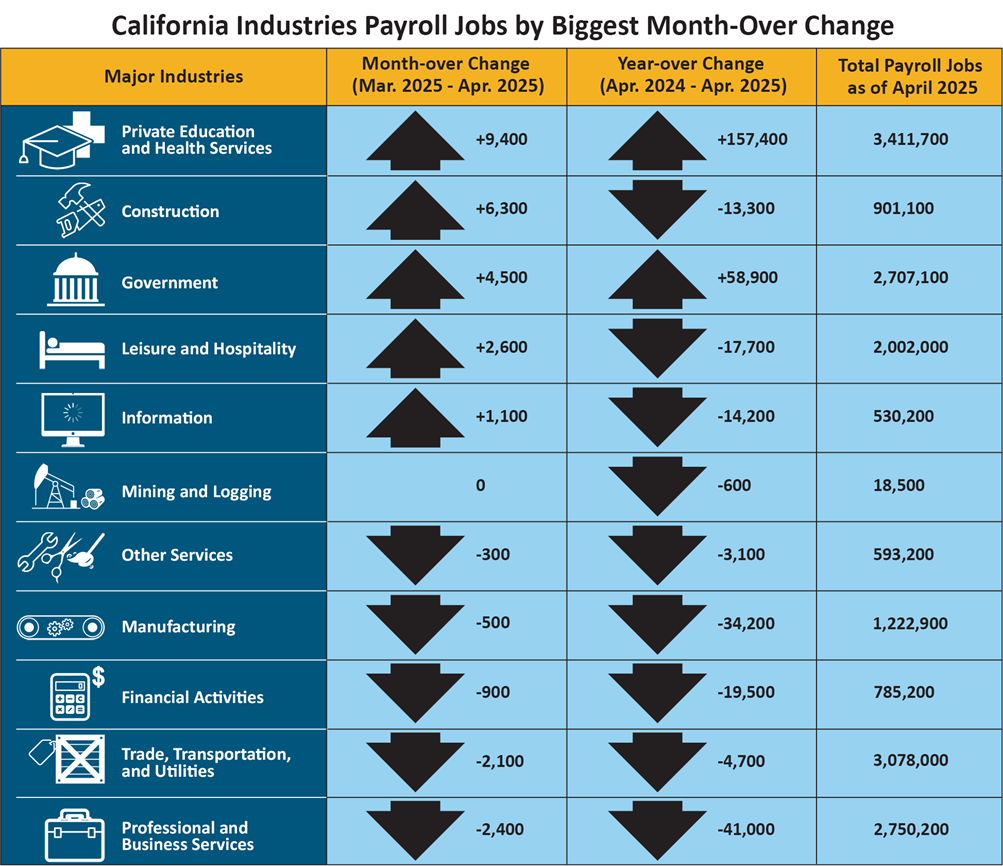
| Major Industries | Month-over Change (Mar. 2025–Apr. 2025) | Year-over Change (Apr. 2024–Apr. 2025) | Total Payroll Jobs as of Apr. 2025 |
|---|---|---|---|
| Private Education and Health Services | +9,400 | +157,400 | 3,411,700 |
| Construction | +6,300 | -13,300 | 901,100 |
| Government | +4,500 | +58,900 | 2,707,100 |
| Leisure and Hospitality | +2,600 | -17,700 | 2,002,000 |
| Information | +1,100 | -14,200 | 530,200 |
| Mining and Logging | 0 | -600 | 18,500 |
| Other Services | -300 | -3,100 | 593,200 |
| Manufacturing | -500 | -34,200 | 1,222,900 |
| Financial Activities | -900 | -19,500 | 785,200 |
| Trade, Transportation, and Utilities | -2,100 | -4,700 | 3,078,000 |
| Professional and Business Services | -2,400 | -41,000 | 2,750,200 |
Total Farm Jobs — The number of jobs in the agriculture industry decreased from March by 10,800 to a total of 414,300 jobs in April. The agriculture industry had 4,900 more farm jobs in April 2025 than it did in April of last year.
Data Trends about Workers in the Economy
Employment and Unemployment in California (Based on a monthly federal survey of 4,400 California households which focuses on workers in the economy)
- Employed — The number of Californians employed in April was 18,699,200, an increase of 39,300 persons from March’s total of 18,659,900 and up 118,700 from the employment total in April 2024.
- Unemployed — The number of unemployed Californians was 1,055,000 in April, an increase of 400 over the month, and up 41,800 in comparison to April 2024.
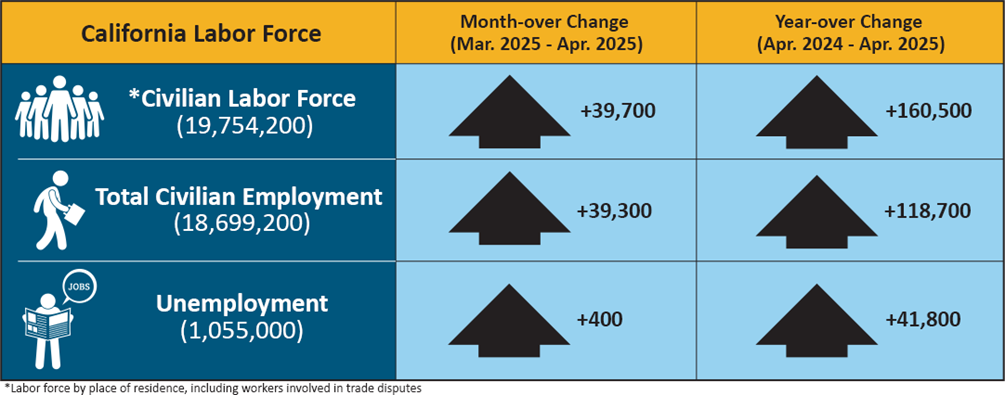
| California Labor Force | Month-over Change (Mar. 2025–Apr. 2025) | Year-over Change (Apr. 2024–Apr. 2025) |
|---|---|---|
| Civilian Labor Force (19,754,200) | +39,700 | +160,500 |
| Total Civilian Employment (18,699,200) | +39,300 | +118,700 |
| Unemployment (1,055,000) | +400 | +41,800 |
*Labor force by place of residence, including workers involved in trade disputes
Unemployment Insurance Claims (Not Seasonally Adjusted)
The following data is from a sample week that includes the 19th of each month:
In related data that figures into the State’s unemployment rate, there were 402,004 people certifying for Unemployment Insurance (UI) benefits during the April 2025 sample week. That compares to 424,213 people in March and 411,413 people in April 2024. Concurrently, 42,222 initial claims were processed in the April 2025 sample week, which was a month-over increase of 1,229 claims from March and a year-over decrease of 2,914 claims from April 2024.
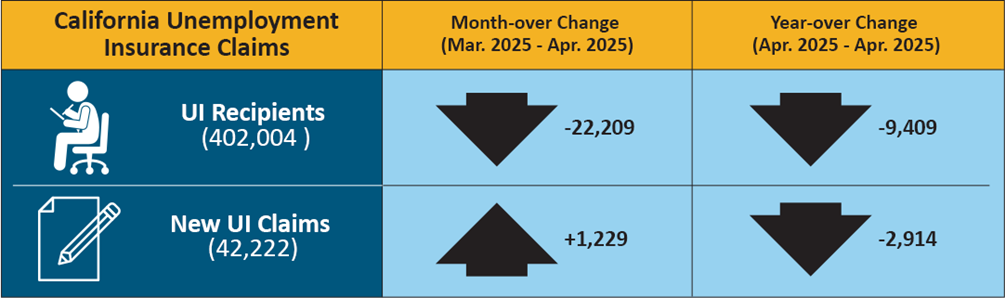
| California Unemployment Insurance Claims | Month-over Change (Mar. 2025–Apr. 2025) | Year-over Change (Apr. 2024–Apr. 2025) |
|---|---|---|
| UI Recipients (402,004) | -22,209 | -9,409 |
| New UI Claims (42,222) | +1,229 | -2,914 |
| COUNTY | LABOR FORCE | EMPLOYMENT | UNEMPLOYMENT | RATE |
|---|---|---|---|---|
| STATE TOTAL |
19,812,900 |
18,824,000 |
988,900 |
5.0% |
| ALAMEDA |
868,600 |
832,500 |
36,100 |
4.2% |
| ALPINE |
490 |
460 |
30 |
6.1% |
| AMADOR |
15,220 |
14,400 |
830 |
5.4% |
| BUTTE |
93,900 |
88,600 |
5,300 |
5.6% |
| CALAVERAS |
17,860 |
16,800 |
1,060 |
6.0% |
| COLUSA |
11,660 |
10,010 |
1,650 |
14.2% |
| CONTRA COSTA |
584,100 |
559,200 |
25,000 |
4.3% |
| DEL NORTE |
9,090 |
8,560 |
530 |
5.8% |
| EL DORADO |
92,000 |
87,800 |
4,200 |
4.5% |
| FRESNO |
481,800 |
441,400 |
40,400 |
8.4% |
| GLENN |
12,190 |
11,360 |
840 |
6.8% |
| HUMBOLDT |
61,100 |
58,200 |
2,900 |
4.8% |
| IMPERIAL |
71,800 |
60,300 |
11,500 |
16.0% |
| INYO |
8,400 |
8,050 |
350 |
4.2% |
| KERN |
410,700 |
374,000 |
36,700 |
8.9% |
| KINGS |
58,900 |
53,400 |
5,500 |
9.3% |
| LAKE |
26,540 |
24,730 |
1,820 |
6.8% |
| LASSEN |
8,210 |
7,720 |
490 |
6.0% |
| LOS ANGELES |
5,095,200 |
4,833,200 |
262,000 |
5.1% |
| MADERA |
71,100 |
65,500 |
5,600 |
7.9% |
| MARIN |
126,500 |
121,800 |
4,600 |
3.7% |
| MARIPOSA |
7,110 |
6,690 |
420 |
5.8% |
| MENDOCINO |
36,940 |
34,900 |
2,040 |
5.5% |
| MERCED |
123,400 |
110,600 |
12,800 |
10.4% |
| MODOC |
3,190 |
2,980 |
220 |
6.7% |
| MONO |
9,200 |
8,910 |
300 |
3.2% |
| MONTEREY |
232,100 |
214,200 |
17,900 |
7.7% |
| NAPA |
76,400 |
73,500 |
2,900 |
3.8% |
| NEVADA |
47,940 |
45,820 |
2,130 |
4.4% |
| ORANGE |
1,641,200 |
1,581,100 |
60,100 |
3.7% |
| PLACER |
208,500 |
200,500 |
8,000 |
3.8% |
| PLUMAS |
7,630 |
7,020 |
620 |
8.1% |
| RIVERSIDE |
1,193,000 |
1,134,700 |
58,300 |
4.9% |
| SACRAMENTO |
789,000 |
753,700 |
35,300 |
4.5% |
| SAN BENITO |
34,800 |
32,500 |
2,300 |
6.7% |
| SAN BERNARDINO |
1,039,400 |
989,400 |
50,000 |
4.8% |
| SAN DIEGO |
1,675,400 |
1,607,600 |
67,800 |
4.0% |
| SAN FRANCISCO |
511,200 |
492,900 |
18,400 |
3.6% |
| SAN JOAQUIN |
373,200 |
349,600 |
23,600 |
6.3% |
| SAN LUIS OBISPO |
134,300 |
129,100 |
5,200 |
3.8% |
| SAN MATEO |
418,500 |
404,100 |
14,400 |
3.4% |
| SANTA BARBARA |
226,000 |
216,400 |
9,500 |
4.2% |
| SANTA CLARA |
1,029,500 |
990,100 |
39,400 |
3.8% |
| SANTA CRUZ |
138,200 |
129,200 |
9,000 |
6.5% |
| SHASTA |
81,300 |
77,100 |
4,200 |
5.1% |
| SIERRA |
1,350 |
1,270 |
80 |
5.6% |
| SISKIYOU |
16,900 |
15,760 |
1,150 |
6.8% |
| SOLANO |
217,600 |
207,100 |
10,500 |
4.8% |
| SONOMA |
249,500 |
239,500 |
10,000 |
4.0% |
| STANISLAUS |
259,700 |
242,000 |
17,800 |
6.8% |
| SUTTER |
46,900 |
42,800 |
4,200 |
8.8% |
| TEHAMA |
27,180 |
25,500 |
1,680 |
6.2% |
| TRINITY |
5,560 |
5,210 |
340 |
6.2% |
| TULARE |
225,900 |
202,700 |
23,200 |
10.3% |
| TUOLUMNE |
22,390 |
21,260 |
1,120 |
5.0% |
| VENTURA |
428,100 |
409,800 |
18,300 |
4.3% |
| YOLO |
112,800 |
107,000 |
5,900 |
5.2% |
| YUBA |
36,300 |
33,900 |
2,400 |
6.6% |