NR No. 24-18
Contact: Loree Levy/Aubrey Henry
916-654-9029
mediainquiries@edd.ca.gov
Important Note: The employment data for the month of April 2024 is taken from the survey week including April 12. Data for May is scheduled for release on June 21, 2024.
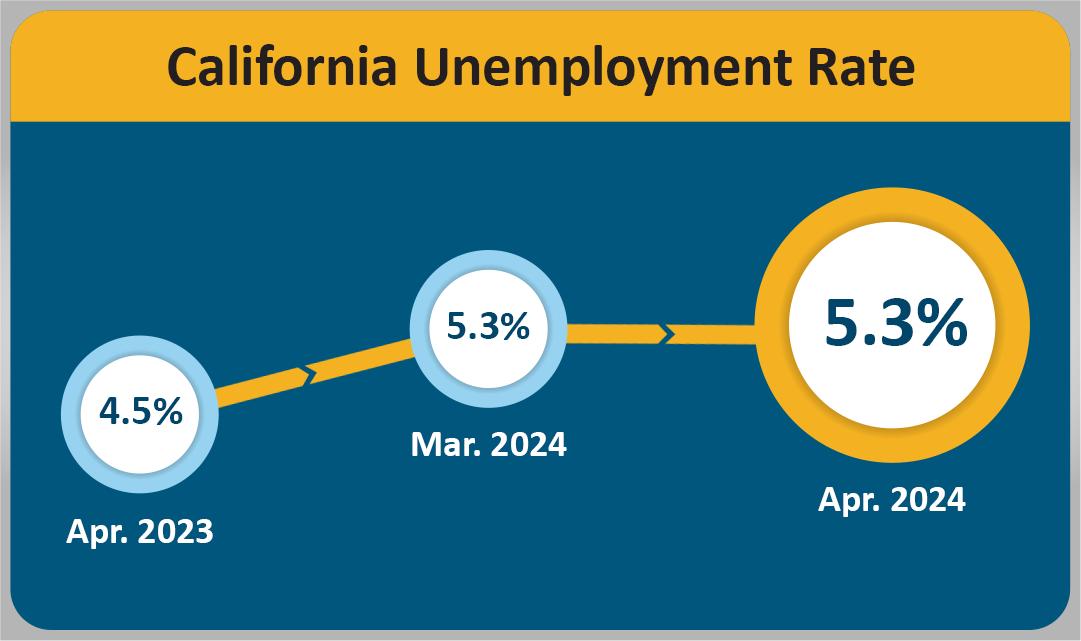
Unemployment Rate Remains Unchanged for Third Consecutive Month
SACRAMENTO – California’s employers added 5,200 nonfarm payroll jobs1 in April 2024 and the unemployment rate remained unchanged for a third consecutive month holding steady at 5.3 percent2, according to data released by the Employment Development Department (EDD). April’s job gain follows a revised job gain of 18,200 for March 2024.
California's Labor Market, by the Numbers...
- The State’s jobs market expansion entered its 48th month in April 2024. Since April 2020, California has gained 3,057,800 jobs, which averages out to 63,704 per month.
- The state’s current job growth started in August 2023 and has amounted to a total gain of 200,300 jobs. This reflects a rebound from the slowdown during the prior 10 months as the state economy settled following its dramatic post-pandemic recovery.
- Five of California's 11 industry sectors gained jobs in April with Private Education & Health Services (+11,900) posting the largest month-over gain for the fourth consecutive month.
- Trade, Transportation, and Utilities (+5,100) also showed noticeable growth as above-average gains were seen in the Truck Transportation and the Couriers and Messengers industry groups.
- Construction (-6,000) saw a small reduction in jobs due to lingering stormy weather conditions affecting construction projects across the state. The industry remains up 15,100 jobs over the year.
1. The unemployment rate comes from a separate federal survey of 5,100 California households.
2. The nonfarm payroll job numbers come from a federal survey of 80,000 California businesses.
Data Trends about Jobs in the Economy
Total Nonfarm Payroll Jobs (Comes from a monthly survey of approximately 80,000 California businesses that estimates jobs in the economy – seasonally adjusted)
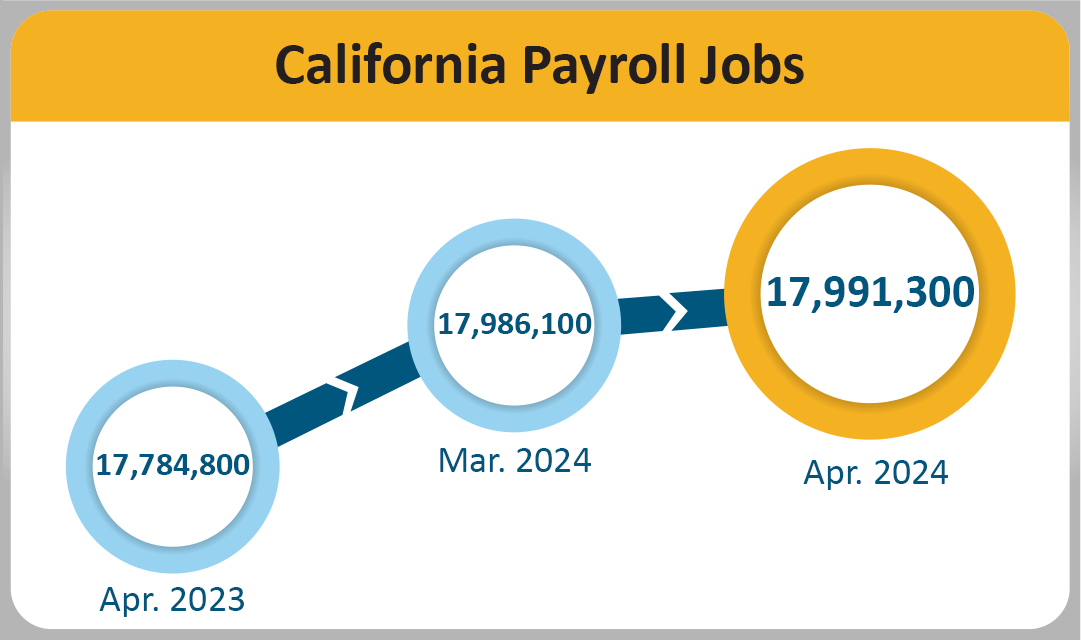
- Month-over – Total nonfarm jobs in California’s 11 major industries amounted to 17,991,300 in April – a net gain of 5,200 from March. This followed a downward revised (-10,100) month-over gain of 18,200 jobs in March.
- Year-over – Total nonfarm jobs increased by 206,500 (a 1.2 percent increase) from April 2023 to April 2024 compared to the U.S. annual gain of 2,802,000 jobs (a 1.8 percent increase)
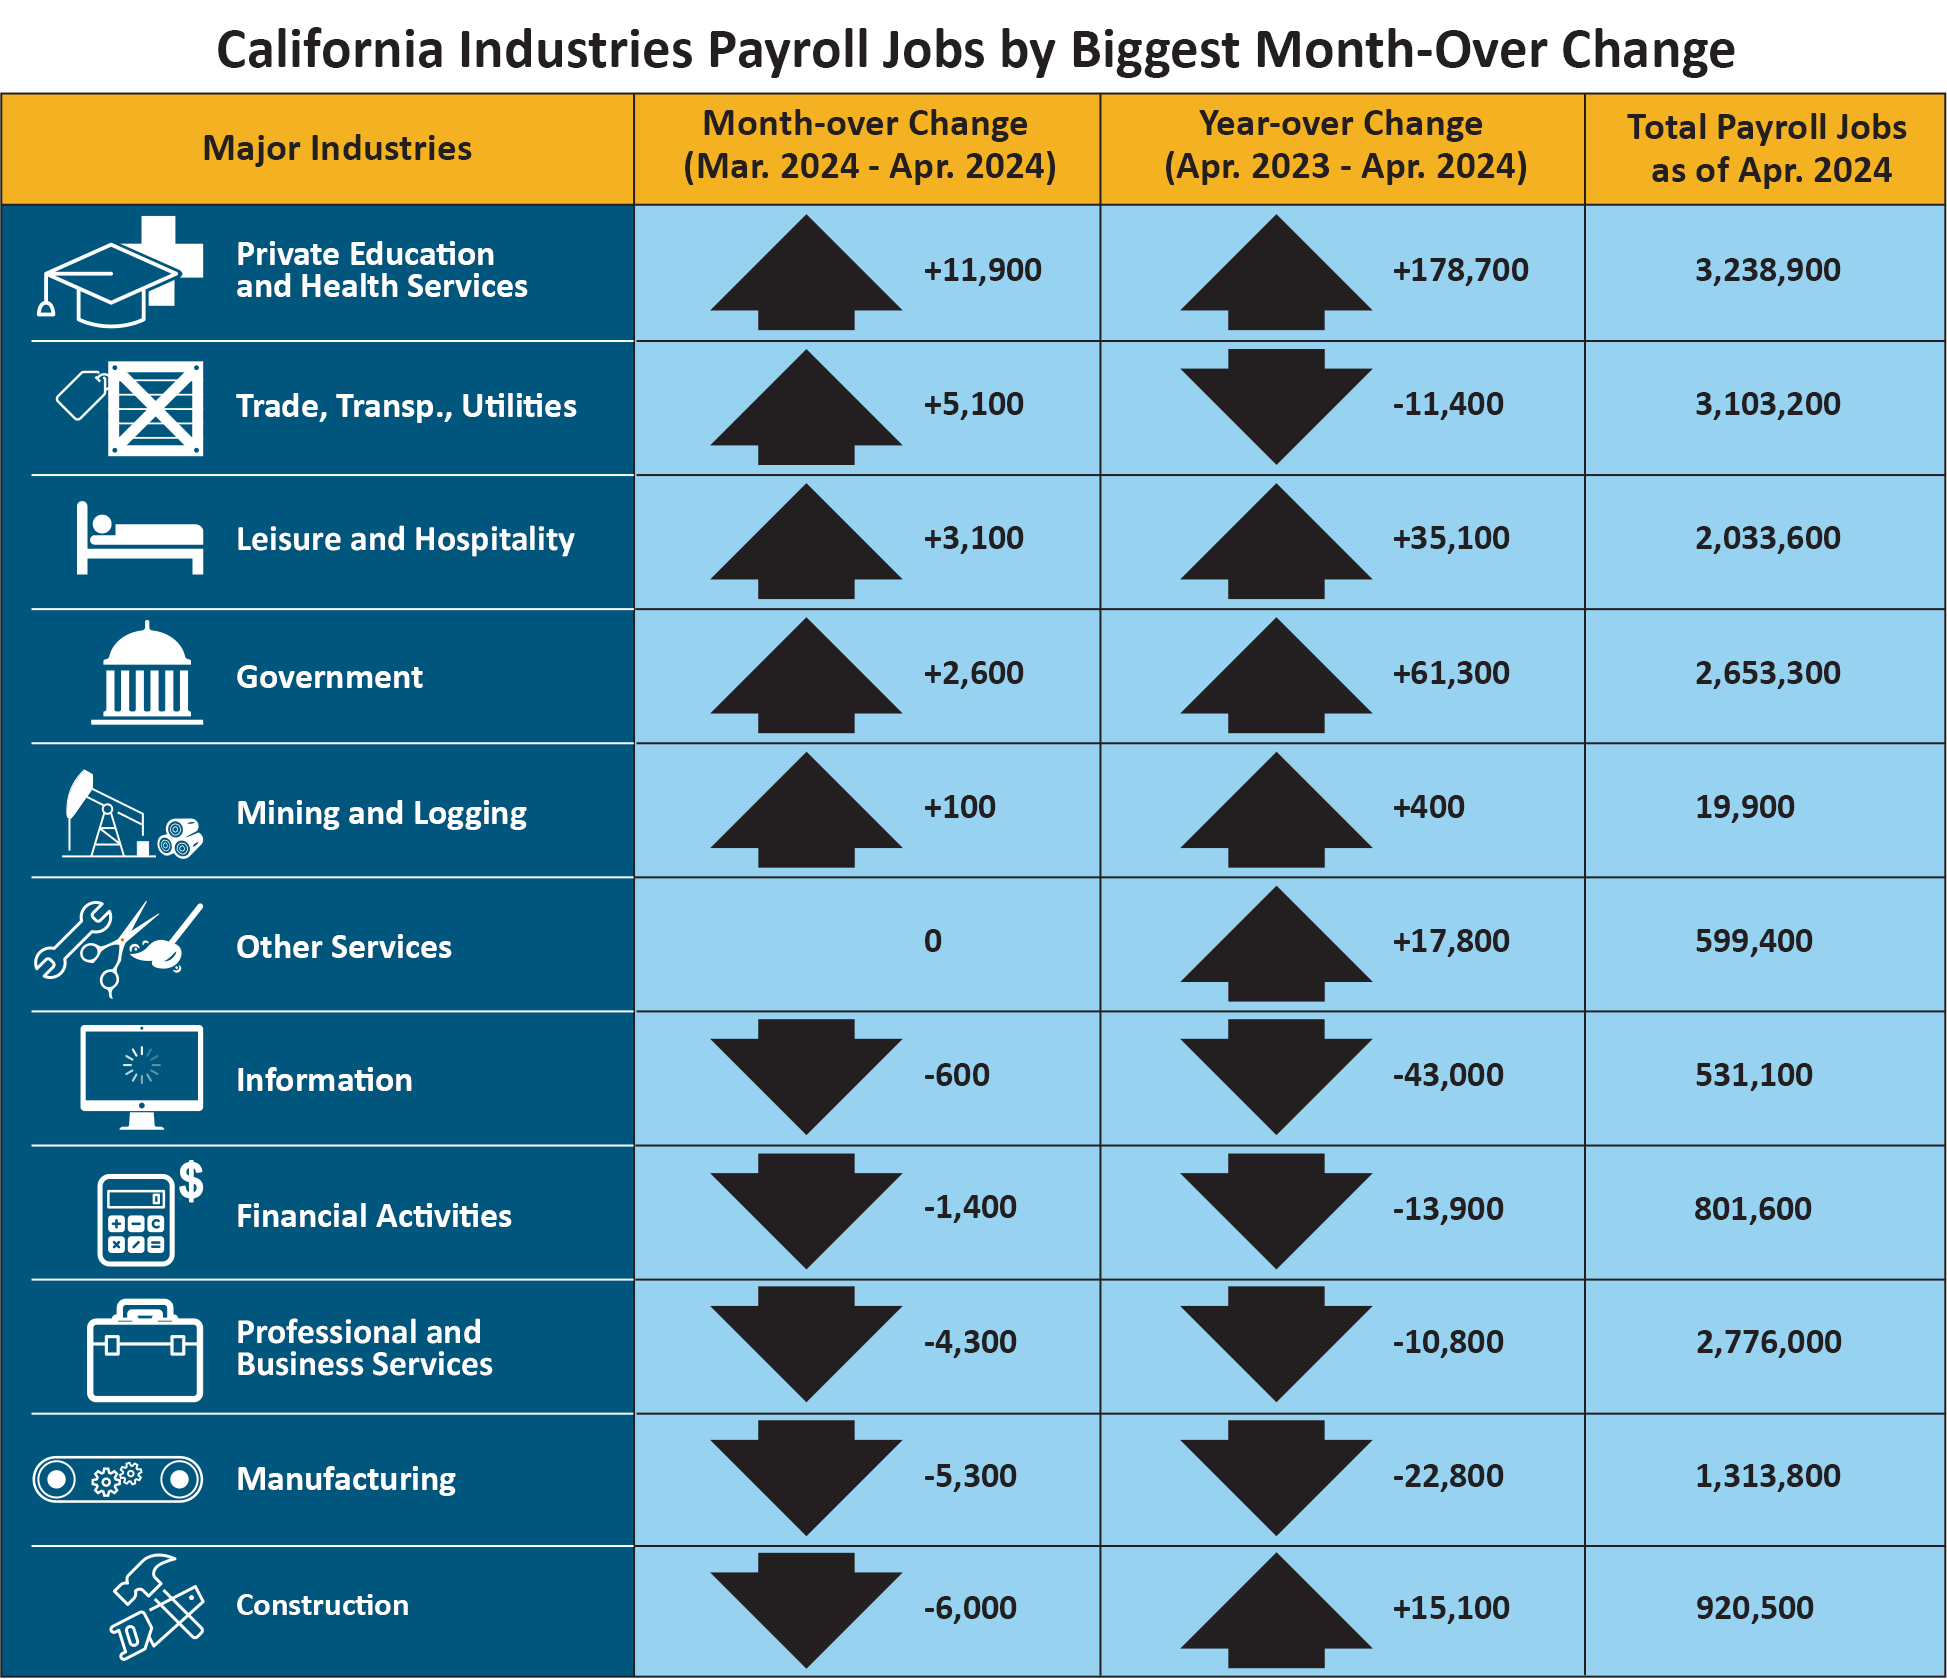
| Major Industries | Month-over Change (March 2024–April 2024) | Year-over Change (April 2023–April 2024) | Total Payroll Jobs as of April 2024 |
|---|---|---|---|
|
Private Education and Health Services |
+11,900 | +178,700 | 3,228,900 |
|
Trade, Transp., Utilities |
+5,100 | -11,400 | 3,103,200 |
|
Leisure and Hospitality |
+3,100 | -+35,100 | 2,033,600 |
|
Government |
+2,600 | +61,300 | 2,653,300 |
|
Other Services |
0 | +17,800 | 599,400 |
|
Information |
-600 | -43,000 | 531,100 |
|
Financial Activities |
-1,400 | -13,900 | 801,600 |
|
Professional and Business Services |
-4,300 | -10,800 | 2,776,000 |
|
Manufacturing |
-5,300 | -22,800 | 1,313,800 |
|
Construction |
-6,000 | +15,100 | 920,500 |
Total Farm Jobs – While the number of jobs in the agriculture industry decreased from by 11,700 from March to a total of 414,700 jobs in April, the agriculture industry did have 30,800 more farm jobs in April 2024 than it did in April a year ago.
Data Trends about Workers in the Economy
Employment and Unemployment in California (Based on a monthly federal survey of 5,100 California households which focuses on workers in the economy)
- Employed – The number of Californians employed in April was 18,319,100, an increase of 5,800 persons from March’s total of 18,313,300, but down 115,100 from the employment total in April 2023.
- Unemployed – The number of unemployed Californians was 1,027,000 in April, a decrease of 5,900 over the month, and up 164,700 in comparison to April 2023. This is the second time in five months the total unemployed has declined.
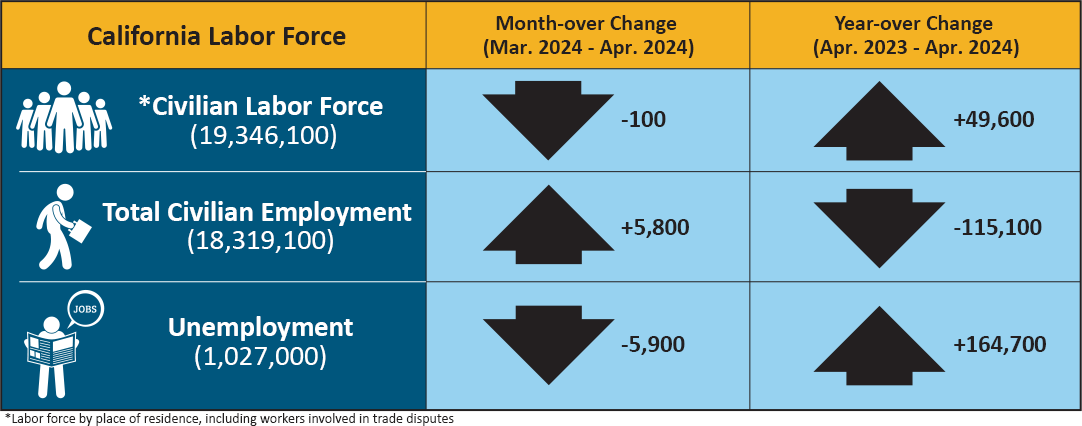
| California Labor Force | Month-over Change (March 2024–April 2024) | Year-over Change (April 2023–April 2024) |
|---|---|---|
| * Civilian Labor Force (19,346,100) | -100 | +49,600 |
| Total Civilian Employment (18,319,100) | +5,800 | -115,100 |
| Unemployment (1,027,000) | -5,900 | +164,700 |
* Labor force by place of residence, including workers involved in trade disputes.
Unemployment Insurance Claims (Not Seasonally Adjusted)
The following data is from a sample week that includes the 19th of each month:
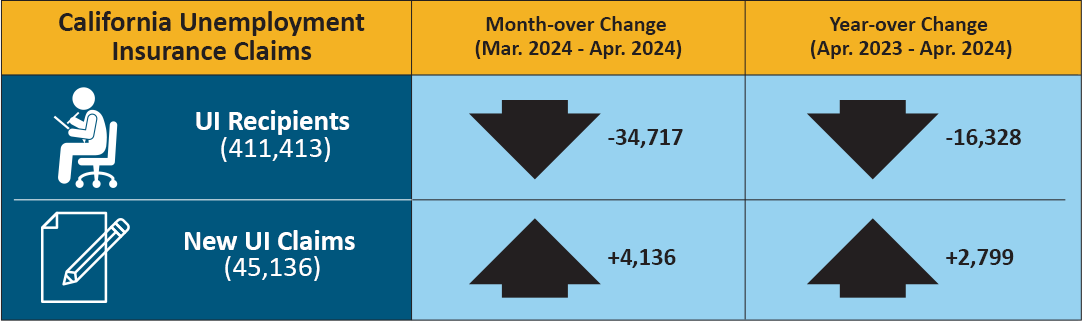
In related data that figures into the State’s unemployment rate, there were 411,413 people certifying for Unemployment Insurance (UI) benefits during the April 2024 sample week. That compares to 446,130 people in March and 427,741 people in April 2023. Concurrently, 45,136 initial claims were processed in the April 2024 sample week, which was a month-over increase of 4,136 claims from March and a year-over increase of 2,799 claims from April 2023.
| California Unemployment Insurance Claims | Month-over Change (March 2024–April 2024) | Year-over Change (April 2023–April 2024) |
|---|---|---|
| UI Recipients (411,413) | -34,717 | -16,328 |
| New UI Claims (45,136) | +4,136 | +2,799 |
| COUNTY | LABOR FORCE | EMPLOYMENT | UNEMPLOYMENT | RATE |
|---|---|---|---|---|
| STATE TOTAL | 19,213,200 | 18,281,900 | 931,400 | 4.8% |
| ALAMEDA | 819,300 | 783,700 | 35,700 | 4.4% |
| ALPINE | 580 | 550 | 30 | 5.5% |
| AMADOR | 14,460 | 13,710 | 750 | 5.2% |
| BUTTE | 92,600 | 87,300 | 5,300 | 5.7% |
| CALAVERAS | 22,190 | 21,140 | 1,040 | 4.7% |
| COLUSA | 10,790 | 9,120 | 1,660 | 15.4% |
| CONTRA COSTA | 546,700 | 522,600 | 24,100 | 4.4% |
| DEL NORTE | 9,040 | 8,520 | 520 | 5.8% |
| EL DORADO | 94,500 | 90,500 | 4,000 | 4.2% |
| FRESNO | 462,500 | 423,500 | 38,900 | 8.4% |
| GLENN | 12,690 | 11,820 | 870 | 6.8% |
| HUMBOLDT | 60,100 | 57,200 | 2,900 | 4.9% |
| IMPERIAL | 71,500 | 60,300 | 11,200 | 15.7% |
| INYO | 8,420 | 8,100 | 320 | 3.8% |
| KERN | 396,800 | 360,000 | 36,800 | 9.3% |
| KINGS | 58,900 | 53,500 | 5,400 | 9.2% |
| LAKE | 28,400 | 26,710 | 1,690 | 6.0% |
| LASSEN | 8,580 | 8,060 | 520 | 6.1% |
| LOS ANGELES | 4,968,200 | 4,743,800 | 224,300 | 4.5% |
| MADERA | 65,100 | 59,700 | 5,400 | 8.3% |
| MARIN | 131,300 | 126,800 | 4,500 | 3.4% |
| MARIPOSA | 7,340 | 6,950 | 390 | 5.4% |
| MENDOCINO | 37,320 | 35,450 | 1,870 | 5.0% |
| MERCED | 120,500 | 107,800 | 12,700 | 10.5% |
| MODOC | 3,240 | 3,010 | 230 | 7.1% |
| MONO | 9,170 | 8,840 | 330 | 3.6% |
| MONTEREY | 222,400 | 204,600 | 17,800 | 8.0% |
| NAPA | 72,000 | 69,300 | 2,700 | 3.8% |
| NEVADA | 48,900 | 46,860 | 2,050 | 4.2% |
| ORANGE | 1,580,400 | 1,522,600 | 57,800 | 3.7% |
| PLACER | 196,100 | 188,400 | 7,700 | 3.9% |
| PLUMAS | 7,270 | 6,610 | 660 | 9.1% |
| RIVERSIDE | 1,151,100 | 1,095,200 | 55,900 | 4.9% |
| SACRAMENTO | 735,300 | 702,000 | 33,300 | 4.5% |
| SAN BENITO | 32,200 | 30,000 | 2,200 | 6.7% |
| SAN BERNARDINO | 1,008,100 | 960,100 | 47,900 | 4.8% |
| SAN DIEGO | 1,588,000 | 1,522,700 | 65,200 | 4.1% |
| SAN FRANCISCO | 552,700 | 533,700 | 19,000 | 3.4% |
| SAN JOAQUIN | 346,700 | 323,800 | 22,900 | 6.6% |
| SAN LUIS OBISPO | 135,700 | 130,900 | 4,800 | 3.5% |
| SAN MATEO | 437,500 | 423,200 | 14,300 | 3.3% |
| SANTA BARBARA | 220,000 | 210,700 | 9,300 | 4.2% |
| SANTA CLARA | 1,025,800 | 986,600 | 39,200 | 3.8% |
| SANTA CRUZ | 132,400 | 123,500 | 8,900 | 6.7% |
| SHASTA | 74,200 | 70,100 | 4,100 | 5.5% |
| SIERRA | 1,310 | 1,230 | 90 | 6.5% |
| SISKIYOU | 16,270 | 15,180 | 1,090 | 6.7% |
| SOLANO | 203,400 | 193,400 | 10,000 | 4.9% |
| SONOMA | 248,700 | 239,100 | 9,600 | 3.8% |
| STANISLAUS | 247,700 | 230,300 | 17,400 | 7.0% |
| SUTTER | 47,700 | 43,500 | 4,200 | 8.8% |
| TEHAMA | 25,840 | 24,210 | 1,630 | 6.3% |
| TRINITY | 4,520 | 4,230 | 290 | 6.5% |
| TULARE | 214,700 | 191,500 | 23,200 | 10.8% |
| TUOLUMNE | 19,760 | 18,690 | 1,080 | 5.5% |
| VENTURA | 413,400 | 395,900 | 17,500 | 4.2% |
| YOLO | 110,600 | 105,000 | 5,600 | 5.1% |
| YUBA | 32,600 | 30,200 | 2,400 | 7.3% |