NR No. 23-22
Contact: Loree Levy/Aubrey Henry
916-654-9029
mediainquiries@edd.ca.gov
IMPORTANT NOTE: The employment data for the month of April 2023 is taken from the survey week including April 12th. Data for the month of May is scheduled for release on June 16, 2023.
Employers added 67,000 nonfarm payroll jobs
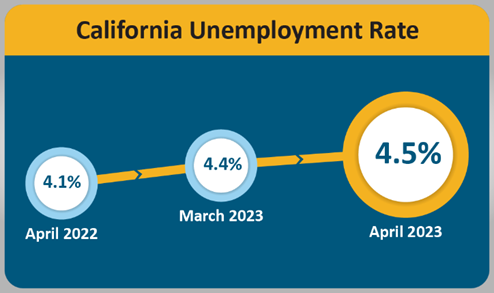
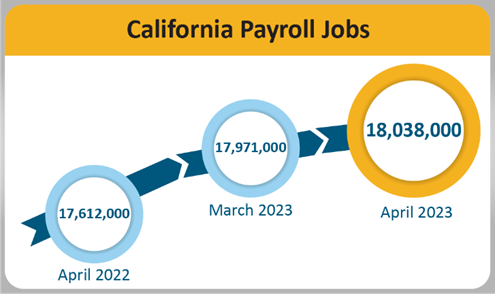
SACRAMENTO – California’s unemployment rate rose 0.1 percent between March and April 2023 to 4.5 percent1, as the state’s employers added 67,000 nonfarm payroll jobs2 to the economy, according to data released today by the California Employment Development Department (EDD) from two surveys.
California's Labor Market, by the Numbers...
- Since the current economic expansion began in April 2020, California has gained 3,120,000 jobs, a monthly average gain of 86,667 jobs over that time.
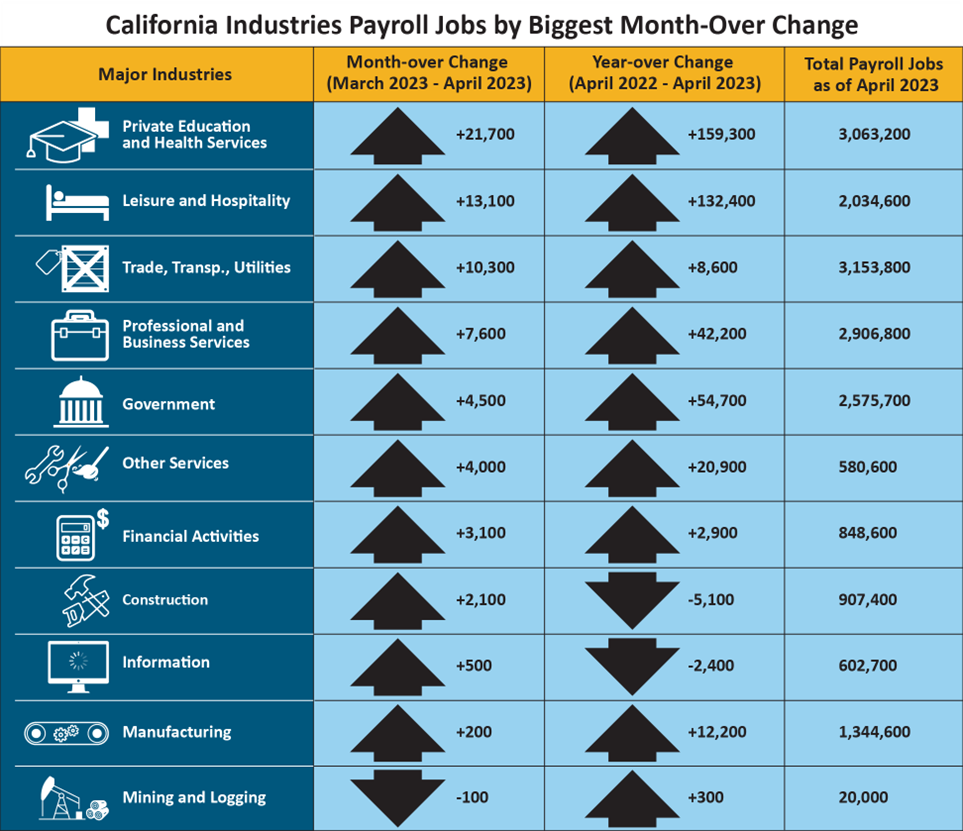
- 10 of California’s 11 industry sectors gained jobs in April with Private Education and Health Services (+21,700) leading the way with notable gains in the Individual and Family Services industry group.
- Leisure and Hospitality (+13,100) enjoyed the second-strongest month-over gains driven by Performing Arts, Spectator Sports & Related Industries, and the Food Services and Drinking Places industry groups.
- Trade, Transportation, and Utilities posted a notable month-over gain (+10,300) because of strong performances in Motor Vehicle and Parts Dealers, Gas Stations and Fuel Dealers, Truck Transportation, and Support Activities for Transportation.
- Mining and Logging (-100) was the only industry sector to suffer a month-over employment loss although the industry’s job totals retained a net gain (+300) when compared with job numbers from April 2022.
1. The unemployment rate comes from a separate federal survey of 5,100 California households.
2. The nonfarm payroll job numbers come from a federal survey of 80,000 California businesses.
Data Trends about Jobs in the Economy
Total Nonfarm Payroll Jobs
Total Nonfarm Payroll Jobs (Comes from a monthly survey of approximately 80,000 California businesses that estimates jobs in the economy – seasonally adjusted)
- Month-over – Total nonfarm jobs in California’s 11 major industries totaled 18,038,000 in April – a net gain of 67,000 from March. This followed an upward revised (+3,200) month-over gain of 11,900 jobs in March.
- Year-over – Total nonfarm jobs increased by 426,000 (a 2.4 percent increase) from April 2022 to April 2023 compared to the U.S. annual gain of 3,995,000 jobs (a 2.6 percent increase).
| Major Industries |
Month-over Change (March 2023–April 2023) |
Year-over Change (April 2022–April 2023) |
Total Payroll Jobs as of April 2023 |
|
Private Education and Health Services
|
+21,700 |
+159,300 |
3,063,200 |
|
Leisure and Hospitality
|
+13,100 |
+132,400 |
2,034,600 |
|
Trade, Transp., Utilities
|
+10,300 |
+8,600 |
3,153,800 |
|
Professional and Business Services
|
+7,600 |
+42,200 |
2,906,800 |
|
Government
|
+4,500 |
+54,700 |
2,575,700 |
|
Other Services
|
+4,000 |
+20,900 |
580,600 |
|
Financial Activities
|
+3,100 |
+2,900 |
848,600 |
|
Construction
|
+2,100 |
-5,100 |
907,400 |
|
Information
|
+500 |
-2,400 |
602,700 |
|
Manufacturing
|
+200 |
+12,200 |
1,344,600 |
|
Mining and Logging
|
-100 |
+300 |
20,000 |
Total Farm jobs – The number of jobs in the agriculture industry decreased from March by 2,100 to to a total of 432,800 jobs in April. The agricultural industry had 10,000 more farm jobs in April 2023 than it did in April a year ago.
Data Trends about Workers in the Economy
Employment and Unemployment in California (Based on a monthly federal survey of 5,100 California households which focuses on workers in the economy)
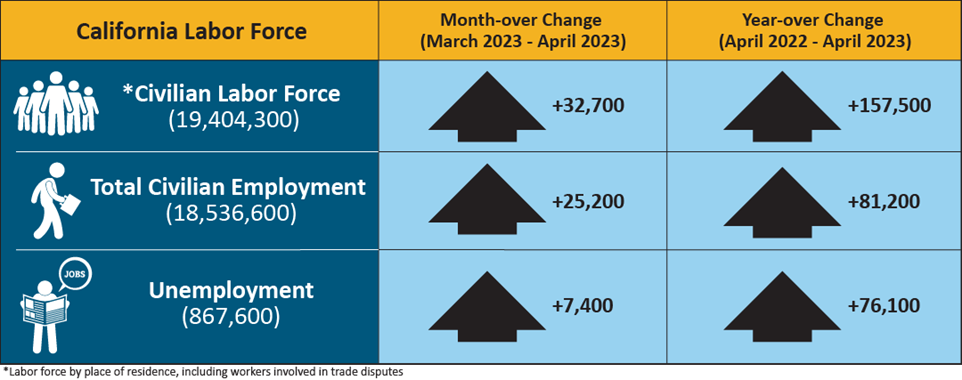
- Employed – The number of Californians employed in April was 18,536,600, an increase of 25,200 persons from March’s total of 18,511,400, and up 81,200 from the employment total in April
- Unemployed – The number of unemployed Californians was 867,600 in April, an increase of 7,400 over the month and up 76,100 in comparison to April 2022.
| California Labor Force |
Month-over Change (March 2023–April 2023) |
Year-over Change (April 2022–April 2023) |
| * Civilian Labor Force (19,404,300) |
+32,700 |
+157,500 |
| Total Civilian Employment (18,536,600) |
+25,200 |
+81,200 |
| Unemployment (867,600) |
+7,400 |
+76,100 |
* Labor force by place of residence, including workers involved in trade disputes.
Unemployment Insurance Claims (Not Seasonally Adjusted)
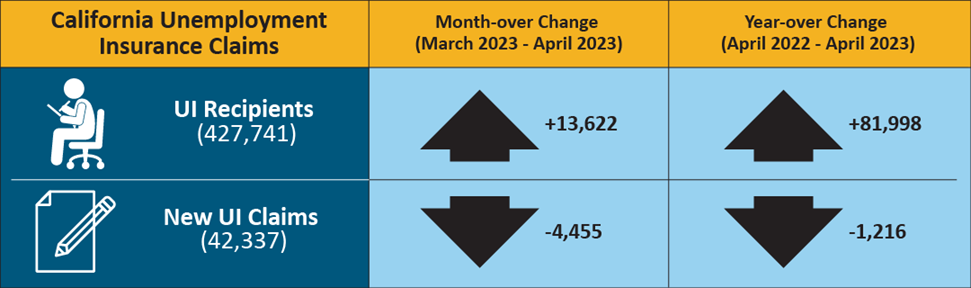
The following data is from a sample week that includes the 19th of each month: In related data that figures into the state’s unemployment rate, there were 427,741 people certifying for Unemployment Insurance benefits during the April 2023 sample week. That compares to 414,119 people in March and 345,743 people in April 2022. Concurrently, 42,337 initial claims were processed in the April 2023 sample week, which was a month-over increase of 13,622 claims from March and also a year-over increase of 81,998 claims from April 2022.
| California Unemployment Insurance Claims |
Month-over Change (March 2023–April 2023) |
Year-over Change (April 2022–April 2023) |
| UI Recipients (427,741) |
+13,622 |
+81,998 |
| New UI Claims (42,337) |
-4,455 |
-1,216 |
MONTHLY LABOR FORCE DATA FOR COUNTIES
April 2023 (Preliminary); 2022 Benchmark
NOT SEASONALLY ADJUSTED
| COUNTY |
LABOR FORCE |
EMPLOYMENT |
UNEMPLOYMENT |
RATE |
| STATE TOTAL |
19,307,900 |
18,481,800 |
826,100 |
4.3% |
| ALAMEDA |
824,100 |
795,800 |
28,300 |
3.4% |
| ALPINE |
530 |
500 |
30 |
6.0% |
| AMADOR |
14,210 |
13,520 |
690 |
4.9% |
| BUTTE |
92,100 |
87,600 |
4,500 |
4.9% |
| CALAVERAS |
21,970 |
21,110 |
860 |
3.9% |
| COLUSA |
10,230 |
8,710 |
1,520 |
14.8% |
| CONTRA COSTA |
549,500 |
530,000 |
19,600 |
3.6% |
| DEL NORTE |
9,180 |
8,690 |
490 |
5.3% |
| EL DORADO |
94,000 |
90,600 |
3,400 |
3.6% |
| FRESNO |
462,300 |
427,900 |
34,400 |
7.4% |
| GLENN |
12,500 |
11,730 |
770 |
6.2% |
| HUMBOLDT |
59,400 |
56,900 |
2,500 |
4.2% |
| IMPERIAL |
69,100 |
59,400 |
9,700 |
14.1% |
| INYO |
8,200 |
7,910 |
290 |
3.5% |
| KERN |
395,600 |
362,900 |
32,800 |
8.3% |
| KINGS |
57,600 |
52,800 |
4,800 |
8.3% |
| LAKE |
27,750 |
26,270 |
1,490 |
5.4% |
| LASSEN |
8,730 |
8,280 |
450 |
5.1% |
| LOS ANGELES |
4,990,800 |
4,765,300 |
225,500 |
4.5% |
| MADERA |
65,800 |
60,900 |
4,900 |
7.4% |
| MARIN |
130,600 |
126,900 |
3,700 |
2.8% |
| MARIPOSA |
7,140 |
6,770 |
370 |
5.1% |
| MENDOCINO |
35,970 |
34,330 |
1,640 |
4.6% |
| MERCED |
116,900 |
105,600 |
11,300 |
9.7% |
| MODOC |
3,150 |
2,930 |
220 |
6.8% |
| MONO |
8,440 |
8,130 |
310 |
3.6% |
| MONTEREY |
232,500 |
215,500 |
17,000 |
7.3% |
| NAPA |
71,500 |
69,200 |
2,300 |
3.2% |
| NEVADA |
47,220 |
45,480 |
1,740 |
3.7% |
| ORANGE |
1,595,300 |
1,546,800 |
48,500 |
3.0% |
| PLACER |
195,300 |
189,000 |
6,400 |
3.3% |
| PLUMAS |
7,060 |
6,440 |
620 |
8.7% |
| RIVERSIDE |
1,142,400 |
1,095,100 |
47,300 |
4.1% |
| SACRAMENTO |
733,100 |
704,200 |
28,900 |
3.9% |
| SAN BENITO |
32,700 |
30,800 |
1,900 |
5.8% |
| SAN BERNARDINO |
1,000,400 |
959,700 |
40,700 |
4.1% |
| SAN DIEGO |
1,599,200 |
1,546,500 |
52,700 |
3.3% |
| SAN FRANCISCO |
574,900 |
559,300 |
15,500 |
2.7% |
| SAN JOAQUIN |
344,700 |
324,600 |
20,100 |
5.8% |
| SAN LUIS OBISPO |
139,100 |
134,900 |
4,200 |
3.0% |
| SAN MATEO |
454,700 |
443,300 |
11,500 |
2.5% |
| SANTA BARBARA |
228,200 |
219,700 |
8,400 |
3.7% |
| SANTA CLARA |
1,044,400 |
1,013,700 |
30,700 |
2.9% |
| SANTA CRUZ |
134,400 |
126,400 |
8,100 |
6.0% |
| SHASTA |
73,400 |
69,800 |
3,700 |
5.0% |
| SIERRA |
1,270 |
1,200 |
70 |
5.8% |
| SISKIYOU |
16,200 |
15,190 |
1,010 |
6.3% |
| SOLANO |
201,900 |
193,400 |
8,500 |
4.2% |
| SONOMA |
249,300 |
241,500 |
7,900 |
3.2% |
| STANISLAUS |
243,600 |
228,500 |
15,100 |
6.2% |
| SUTTER |
47,200 |
43,400 |
3,800 |
8.1% |
| TEHAMA |
25,190 |
23,720 |
1,460 |
5.8% |
| TRINITY |
4,340 |
4,080 |
260 |
6.0% |
| TULARE |
213,700 |
192,900 |
20,800 |
9.7% |
| TUOLUMNE |
19,300 |
18,360 |
940 |
4.9% |
| VENTURA |
416,900 |
402,100 |
14,900 |
3.6% |
| YOLO |
110,200 |
105,500 |
4,800 |
4.3% |
| YUBA |
32,200 |
30,100 |
2,100 |
6.4% |