NR No. 25-26
Contact: Loree Levy/Greg Lawson
916-654-9029
mediainquiries@edd.ca.gov
Important Note: The employment data for the month of June 2025 comes from the survey week that included June 12. Data for July is scheduled for release on August 15, 2025.
Employers Shed 6,100 Jobs in June
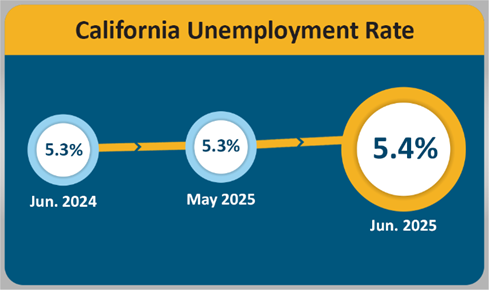
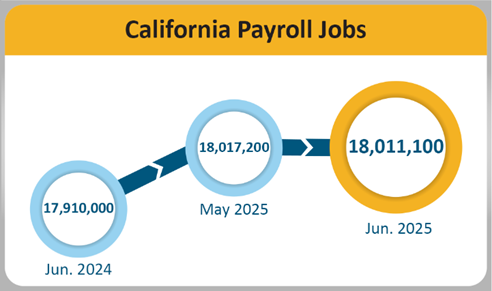
SACRAMENTO — California’s unemployment rate increased slightly to 5.4 percent1 and California’s nonfarm payroll jobs2 decreased by 6,100 jobs in June 2025, according to the latest Employment Development Department (EDD) data that comes from two separate surveys. June’s job decrease follows a revised, lower job gain of 11,700 for May 2025.
California's Labor Market, by the Numbers...
- California’s June 2025 unemployment rate of 5.4 percent has changed little (+0.1 percent) since June 2024 (5.3 percent).
- California has gained 3,091,300 jobs since April 2020, an average of 49,860 per month. Although the State did post a month-over loss of 6,100 jobs for June 2025, California has a net gain of 101,100 nonfarm jobs since June 2024.
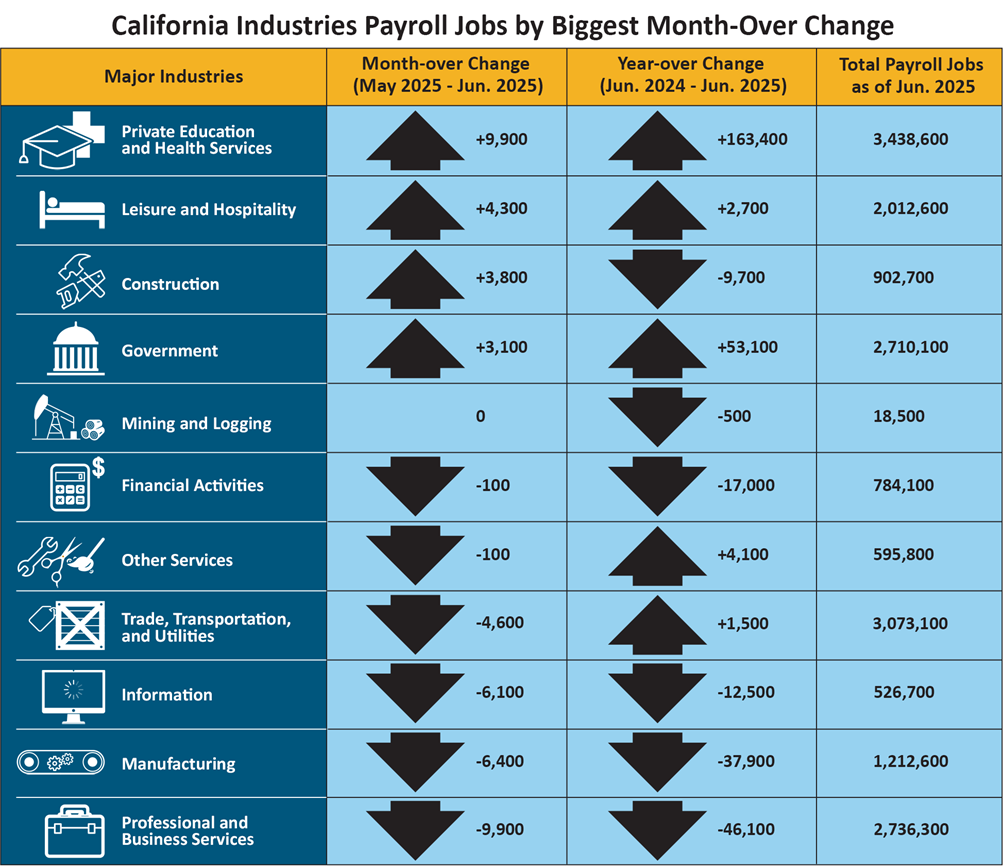
- Four of California's 11 industry sectors gained jobs in June, with Private Education and Health Services (+9,900) posting a gain for the 41st consecutive month. The largest gains were in Health Care and Social Assistance (+2,700). This includes jobs in continuing care retirement communities and assisted living facilities, and nursing and residential care facilities, partly attributed to California’s aging population.
- Leisure and Hospitality (+4,300) also posted a month-over job gain as the arrival of the summer season spurs growth in California’s recreation-focused businesses such as arts and entertainment, spectator sports, and amusement parks.
- Professional and Business Services (-9,900) posted the State’s largest month-over loss as jobs declined in administrative and support services and temporary employment services. Losses also occurred in accounting, tax preparation, bookkeeping and payroll services, and computer systems design.
1. The nonfarm payroll job numbers come from a federal survey of 80,000 California businesses.
2. The unemployment rate comes from a separate federal survey of 4,400 California households.
Data Trends about Jobs in the Economy
Total Nonfarm Payroll Jobs (Comes from a monthly survey of approximately 80,000 California businesses that estimates jobs in the economy — seasonally adjusted)
- Month-over — Total nonfarm jobs in California’s 11 major industries amounted to 18,011,100 in June – a loss of 6,100 from May. This followed May’s downward revision of 6,000 jobs, resulting in a month-over May gain of 11,700 jobs.
- Year-over — Total nonfarm jobs increased by 101,100 (a 0.6 percent increase) from June 2024 to June 2025 compared to the U.S. annual gain of 1,809,000 jobs (a 1.1 percent increase).
| Major Industries | Month-over Change (May 2025 - Jun. 2025) |
Year-over Change (Jun. 2024 - Jun. 2025) |
Total Payroll Jobs as of Jun. 2025 |
|---|---|---|---|
| Private Education and Health Services | +9,900 | +163,400 | 3,438,600 |
| Leisure and Hospitality | +4,300 | +2,700 | 2,012,600 |
|
Construction |
+3,800 | -9,700 | 902,700 |
| Government | +3,100 | +53,100 | 2,710,100 |
|
Mining and Logging |
0 | -500 | 18,500 |
|
Financial Activities |
-100 | -17,000 | 784,100 |
| Other Services | -100 | +4,100 | 595,800 |
| Trade, Transportation, and Utilities | -4,600 | +1,500 | 3,073,100 |
|
Information |
-6,100 | -12,500 | 526,700 |
| Manufacturing | -6,400 | -37,900 | 1,212,600 |
| Professional and Business Services | -9,900 | -46,100 | 2,736,300 |
Total Farm Jobs — The number of jobs in the agriculture industry increased from May by 1,400 to a total of 417,400 jobs in June. The agriculture industry had 6,200 more farm jobs in June 2025 than it did in June of last year.
Data Trends about Workers in the Economy
Employment and Unemployment in California (Based on a monthly federal survey of 4,400 California households which focuses on workers in the economy)
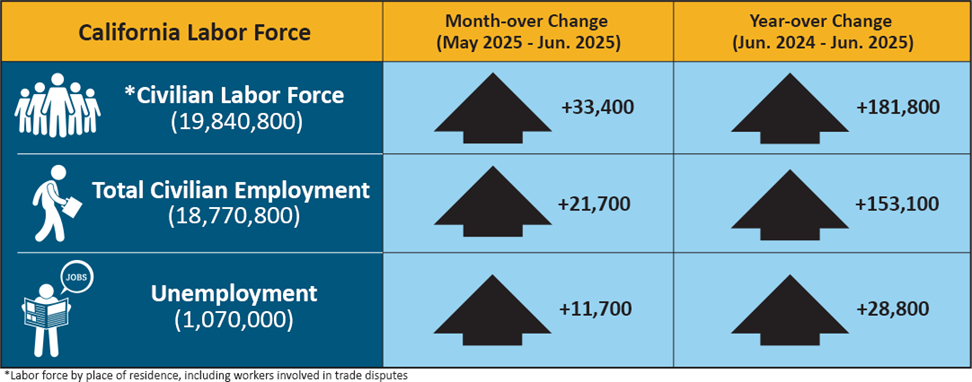
- Employed — The number of Californians employed in June was 18,770,800, an increase of 21,700 persons from May’s total of 18,749,100 and up 153,100 from the employment total in June 2024.
- Unemployed — The number of unemployed Californians was 1,070,000 in June, an increase of 11,700 over the month and up 28,800 in comparison to June 2024.
| California Labor Force | Month-over Change (May 2025 – Jun. 2025) | Year-over Change (Jun. 2024 – Jun. 2025) |
|---|---|---|
| * Civilian Labor Force (19,840,800) | +33,400 | +181,800 |
| Total Civilian Employment (18,770,800) | +21,700 | +153,100 |
| Unemployment (1,070,000) | +11,700 | +28,800 |
* Labor force by place of residence, including workers involved in trade disputes.
Unemployment Insurance Claims (Not Seasonally Adjusted)
The following data is from a sample week that includes the 19th of each month:
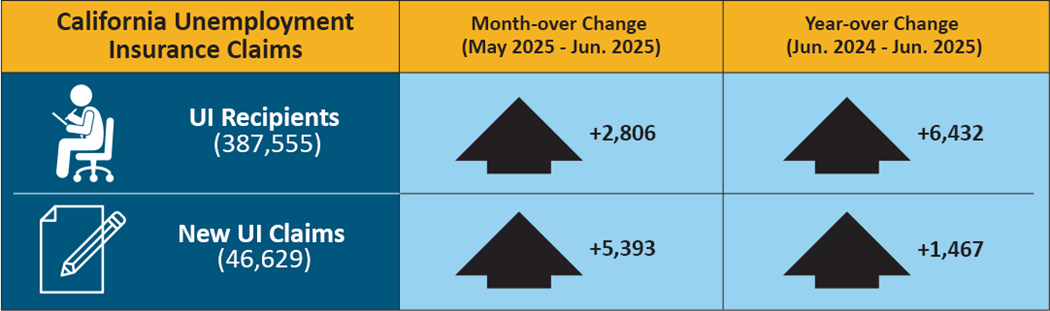
In related data that figures into the State’s unemployment rate, there were 387,555 people certifying for Unemployment Insurance (UI) benefits during the June 2025 sample week. That compares to 384,749 people in May and 381,123 people in June 2024. Concurrently, 46,629 initial claims were processed in the June 2025 sample week, which was a month-over increase of 5,393 claims from May, but a year-over increase of 1,467 claims from June 2024.
| California Unemployment Insurance Claims | Month-over Change (May 2025 – Jun. 2025) | Year-over Change (Jun. 2024 – Jun. 2025) |
|---|---|---|
| UI Recipients (387,555) | +2,806 | +6,432 |
| New UI Claims (46,629) | +5,393 | +1,467 |
| COUNTY | LABOR FORCE | EMPLOYMENT | UNEMPLOYMENT | RATE |
|---|---|---|---|---|
| STATE TOTAL |
19,768,400 |
18,633,300 |
1,135,100 |
5.7% |
| ALAMEDA |
867,400 |
824,300 |
43,100 |
5.0% |
| ALPINE |
390 |
350 |
40 |
10.2% |
| AMADOR |
15,310 |
14,380 |
930 |
6.1% |
| BUTTE |
92,900 |
86,900 |
6,000 |
6.5% |
| CALAVERAS |
17,840 |
16,680 |
1,160 |
6.5% |
| COLUSA |
11,660 |
10,240 |
1,420 |
12.2% |
| CONTRA COSTA |
583,400 |
553,700 |
29,700 |
5.1% |
| DEL NORTE |
9,090 |
8,500 |
590 |
6.5% |
| EL DORADO |
91,500 |
86,800 |
4,800 |
5.2% |
| FRESNO |
483,000 |
441,500 |
41,500 |
8.6% |
| GLENN |
12,220 |
11,270 |
950 |
7.8% |
| HUMBOLDT |
61,200 |
57,800 |
3,400 |
5.6% |
| IMPERIAL |
74,500 |
60,400 |
14,000 |
18.9% |
| INYO |
8,550 |
8,160 |
390 |
4.6% |
| KERN |
413,700 |
374,000 |
39,700 |
9.6% |
| KINGS |
58,900 |
53,100 |
5,700 |
9.7% |
| LAKE |
26,480 |
24,550 |
1,930 |
7.3% |
| LASSEN |
8,240 |
7,730 |
510 |
6.2% |
| LOS ANGELES |
5,043,100 |
4,743,500 |
299,600 |
5.9% |
| MADERA |
72,100 |
66,400 |
5,800 |
8.0% |
| MARIN |
126,500 |
120,800 |
5,600 |
4.5% |
| MARIPOSA |
7,850 |
7,450 |
410 |
5.2% |
| MENDOCINO |
37,510 |
35,340 |
2,170 |
5.8% |
| MERCED |
124,700 |
111,700 |
13,100 |
10.5% |
| MODOC |
3,260 |
3,060 |
200 |
6.1% |
| MONO |
8,750 |
8,390 |
360 |
4.1% |
| MONTEREY |
237,200 |
222,300 |
14,900 |
6.3% |
| NAPA |
78,900 |
75,600 |
3,300 |
4.2% |
| NEVADA |
47,960 |
45,550 |
2,410 |
5.0% |
| ORANGE |
1,638,100 |
1,564,900 |
73,200 |
4.5% |
| PLACER |
207,700 |
198,100 |
9,600 |
4.6% |
| PLUMAS |
8,110 |
7,610 |
500 |
6.1% |
| RIVERSIDE |
1,193,500 |
1,121,900 |
71,700 |
6.0% |
| SACRAMENTO |
786,600 |
744,900 |
41,700 |
5.3% |
| SAN BENITO |
34,500 |
32,100 |
2,400 |
7.0% |
| SAN BERNARDINO |
1,038,900 |
978,000 |
60,900 |
5.9% |
| SAN DIEGO |
1,672,700 |
1,591,200 |
81,500 |
4.9% |
| SAN FRANCISCO |
509,800 |
488,400 |
21,400 |
4.2% |
| SAN JOAQUIN |
372,900 |
346,800 |
26,100 |
7.0% |
| SAN LUIS OBISPO |
135,100 |
128,600 |
6,500 |
4.8% |
| SAN MATEO |
417,600 |
400,500 |
17,200 |
4.1% |
| SANTA BARBARA |
228,600 |
218,000 |
10,700 |
4.7% |
| SANTA CLARA |
1,026,000 |
978,700 |
47,300 |
4.6% |
| SANTA CRUZ |
139,700 |
131,300 |
8,400 |
6.0% |
| SHASTA |
81,200 |
76,700 |
4,500 |
5.5% |
| SIERRA |
1,520 |
1,460 |
70 |
4.3% |
| SISKIYOU |
17,070 |
15,870 |
1,200 |
7.0% |
| SOLANO |
217,200 |
205,000 |
12,200 |
5.6% |
| SONOMA |
250,200 |
238,600 |
11,600 |
4.6% |
| STANISLAUS |
260,300 |
240,500 |
19,800 |
7.6% |
| SUTTER |
47,600 |
43,300 |
4,300 |
9.0% |
| TEHAMA |
27,530 |
25,670 |
1,860 |
6.8% |
| TRINITY |
5,770 |
5,450 |
330 |
5.7% |
| TULARE |
227,400 |
203,000 |
24,400 |
10.7% |
| TUOLUMNE |
22,590 |
21,330 |
1,260 |
5.6% |
| VENTURA |
426,400 |
405,100 |
21,300 |
5.0% |
| YOLO |
113,000 |
106,100 |
6,900 |
6.1% |
| YUBA |
36,500 |
33,900 |
2,600 |
7.2% |