NR No. 24-11
Contact: Loree Levy/Aubrey Henry
916-654-9029
mediainquiries@edd.ca.gov
IMPORTANT NOTE:The employment data for the month of February 2024 is taken from the survey week including Feb. 12. Data for March is scheduled for release on April 19, 2024.
Employers lost 3,400 nonfarm payroll jobs
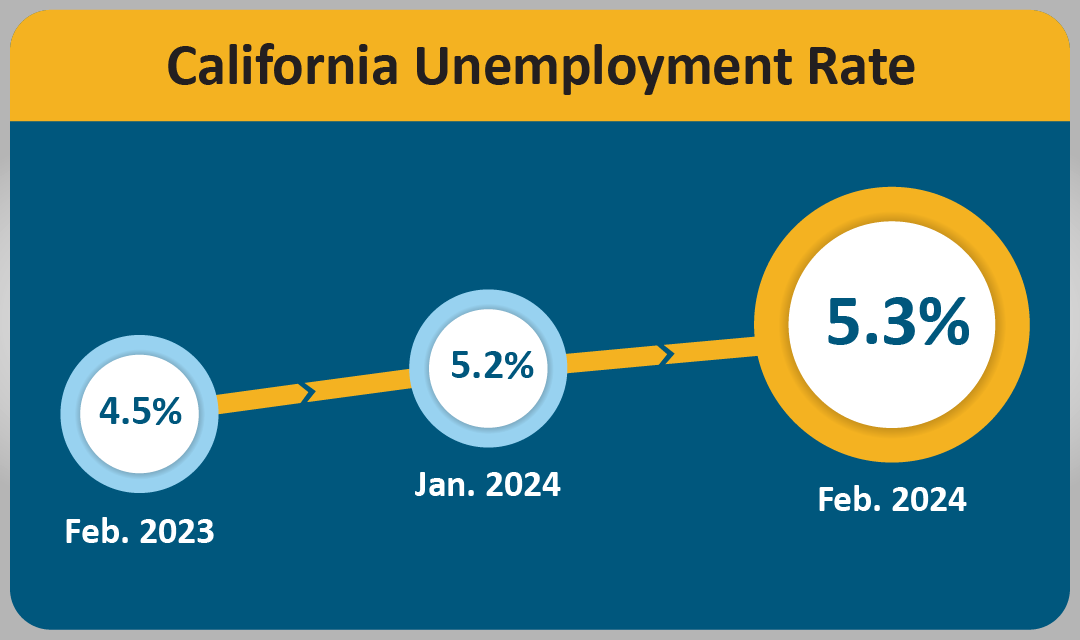
SACRAMENTO – California’s unemployment rate increased to 5.3 percent1 in February 2024, up from 5.2 percent in January, with a loss of 3,400 nonfarm payroll jobs2. Also, the State’s January nonfarm jobs estimate was revised down by 32,500 jobs to a total gain of 25,600 for that month. This is according to data released today by the Employment Development Department (EDD) from two surveys.
California's Labor Market, by the Numbers...
- The State's jobs market expansion turned 46 months old in February 2024. California has gained 3,037,600 jobs since the pre-pandemic peak in February 2020, which averages out to 66,035 per month.
- California's downward-revised January 2024 nonfarm jobs total mirrors the nation, which also saw a large downward revision of approximately 124,000 jobs. The U.S. unemployment rate rose 0.2 percent to 3.9 percent, the highest since January 2022.
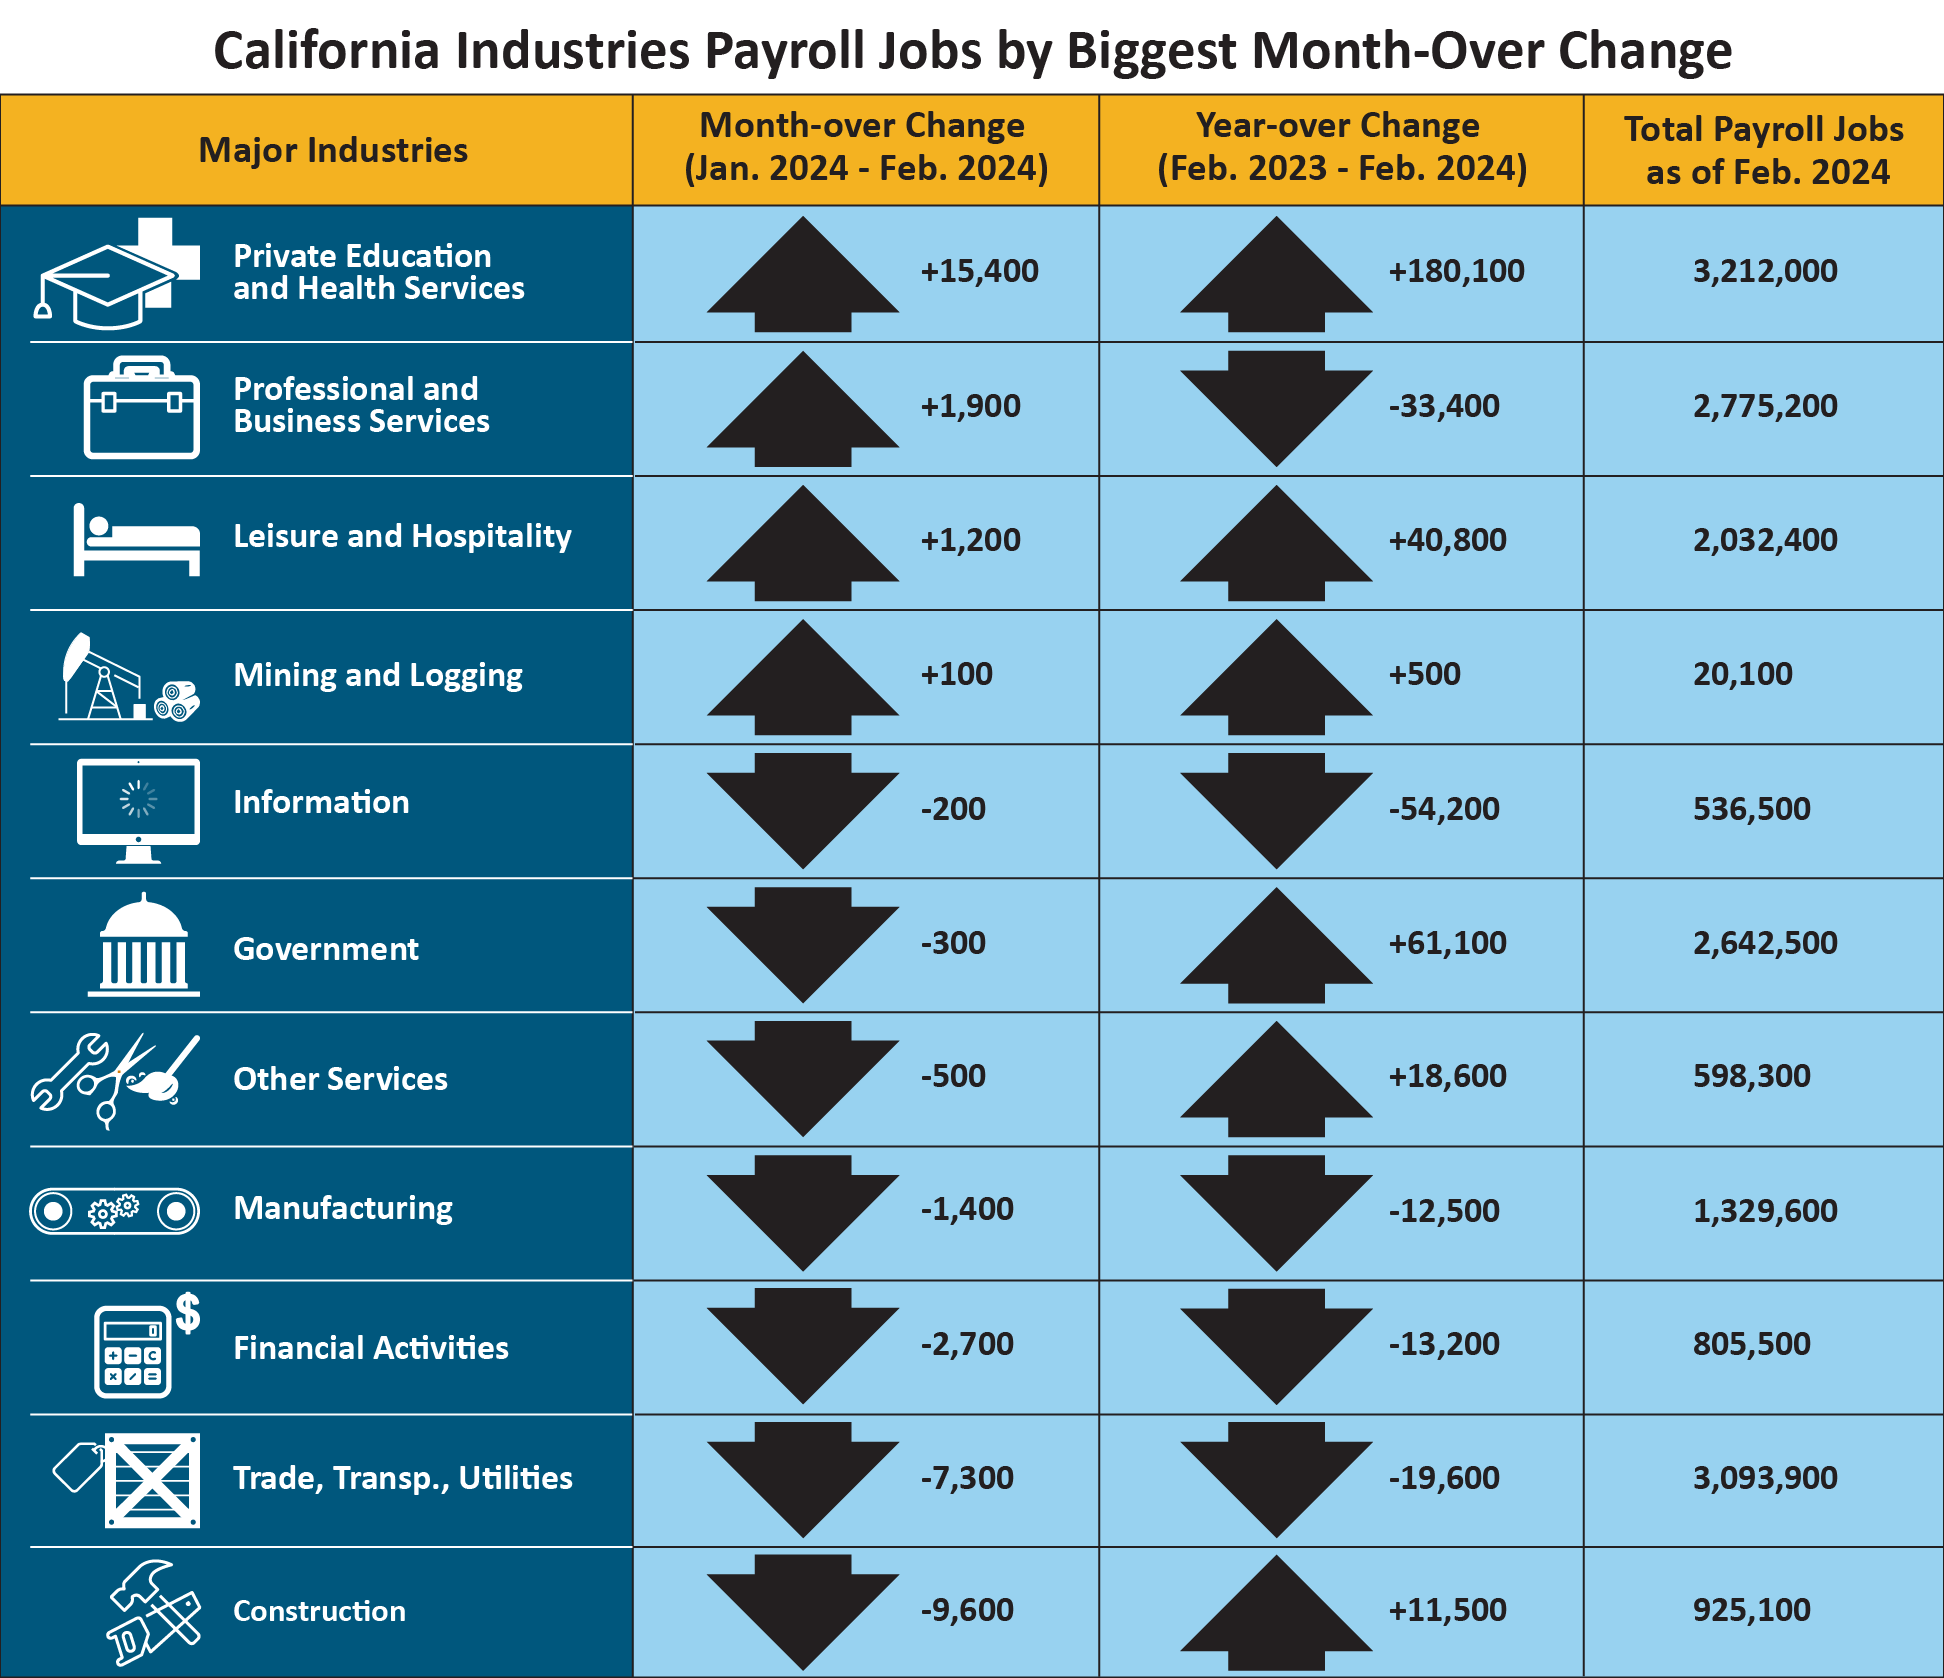
- Four of California's 11 industry sectors gained jobs in February with Private Education & Health Services (+15,400) once again having the largest month-over gain thanks to strength in Other Health Practitioners (such as acupuncturists and dieticians) as well as Home Healthcare Services and Individual and Family Services.
- Noticeable month-over losses were seen in Construction (-9,600) thanks to employment reductions in several industry subsectors due, in part, to disruptions from the multiple “atmospheric river” storms that hit the state throughout the month.
- Trade, Transportation, and Utilities (-7,300) also saw a dip. Declines in sub-sectors like Machinery, Equipment and Supplies Merchant Wholesalers contributed as the nation overall saw lower consumer discretionary spending and demand.
1. The unemployment rate comes from a separate federal survey of 5,100 California households.
2. The nonfarm payroll job numbers come from a federal survey of 80,000 California businesses.
Data Trends about Jobs in the Economy
Total Nonfarm Payroll Jobs (Comes from a monthly survey of approximately 80,000 California businesses that estimates jobs in the economy – seasonally adjusted)
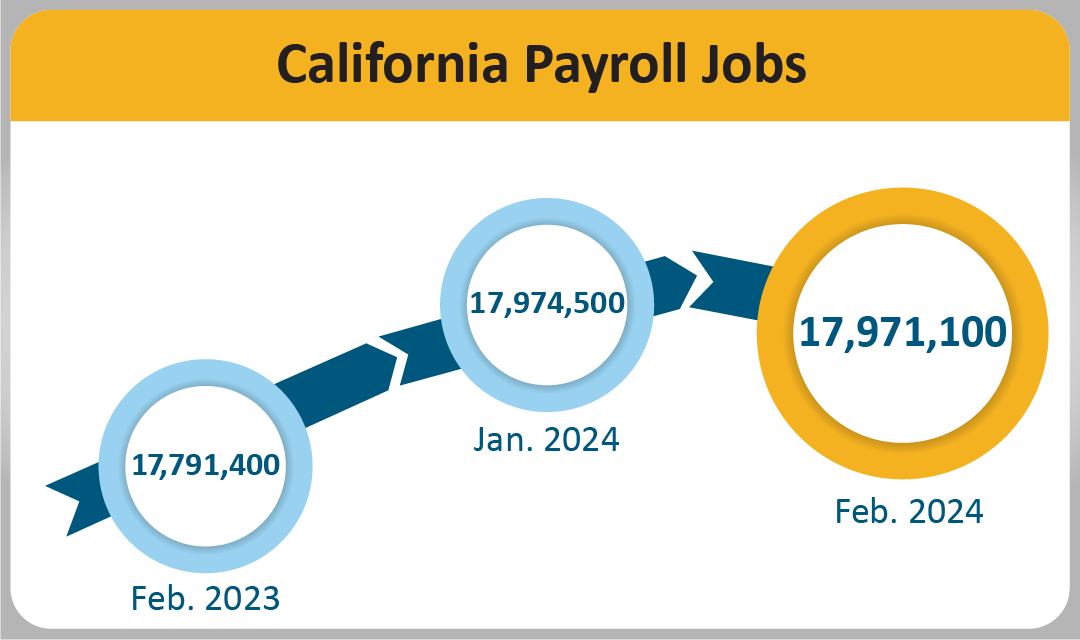
- Month-over – Total nonfarm jobs in California’s 11 major industries amounted to 17,971,100 in February – a net loss of 3,400 from January. This followed a downward revised (-32,500) month-over gain of 25,600 jobs in January.
- Year-over – Total nonfarm jobs increased by 179,700 (a 1.0 percent increase) from February 2023 to February 2024 compared to the U.S. annual gain of 2,748,000 jobs (a 1.8 percent increase).
| Major Industries |
Month-over Change (January 2024-February 2024) |
Year-over Change (February 2023-February 2024 |
Total Payroll Jobs as of February 2024 |
|
Private Education and Health Services
|
+15,400 |
+180,100 |
3,212,000 |
|
Professional and Business Services
|
+1,900 |
-33,400 |
2,775,200 |
| Leisure and Hospitality |
+1,200 |
+40,800 |
2,032,400 |
|
Mining and Logging
|
+100 |
+500 |
20,100 |
|
Information
|
-200 |
-54,200 |
536,500 |
|
Government
|
-300 |
+61,100 |
2,642,500 |
|
Other Services
|
-500 |
+18,600 |
598,300 |
|
Manufacturing
|
-1,400 |
-12,500 |
1,329,600 |
| Financial Activities |
-2,700 |
-13,200 |
805,500 |
|
Trade, Transp., Utilities
|
-7,300 |
-19,600 |
3,093,900 |
|
Construction
|
-9,600 |
+11,500 |
925,100 |
Total Farm jobs – The number of jobs in the agriculture industry decreased from January by 2,100 to a total of 425,000 jobs in February. The agriculture industry had 26,100 more farm jobs in February 2024 than it did in February a year ago.
Data Trends about Workers in the Economy
Employment and Unemployment in California (Based on a monthly federal survey of 5,100 California households which focuses on workers in the economy)
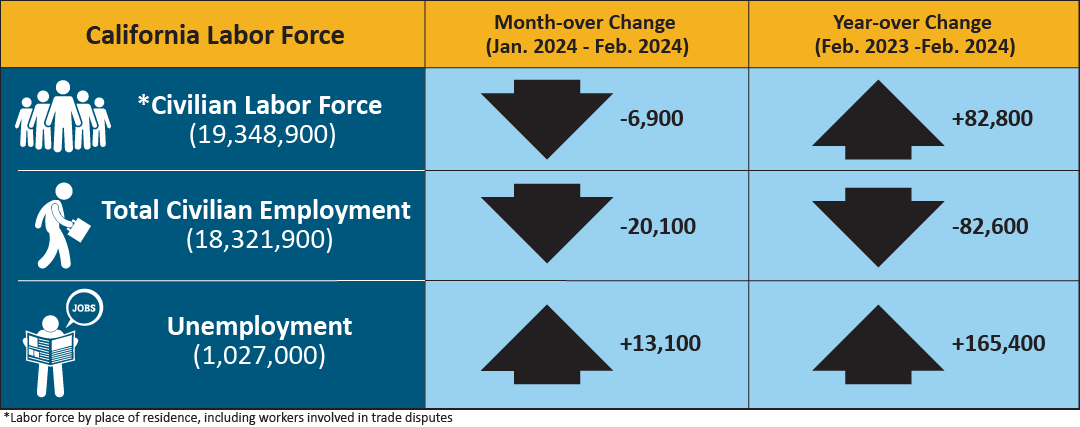
- Employed – The number of Californians employed in February was 18,321,900, a decrease of 20,100 persons from January’s total of 18,342,000 and down 82,600 from the employment total in February 2023.
- Unemployed – The number of unemployed Californians was 1,027,000 in February, an increase of 13,100 over the month and up 165,400 in comparison to February 2023.
| California Labor Force |
Month-over Change (January 2024-February 2024) |
Year-over Change (February 2023-February 2024) |
| *Civilian Labor Force (19,348,900) |
-6,900 |
+82,800 |
| Total Civilian Employment (18,321,900) |
-20,100 |
-82,600 |
| Unemployment (1,027,000) |
+13,100 |
+165,400 |
*Labor force by place of residence, including workers involved in trade disputes.
Unemployment Insurance Claims (not seasonally adjusted)
The following data is from a sample week that includes the 19th of each month:
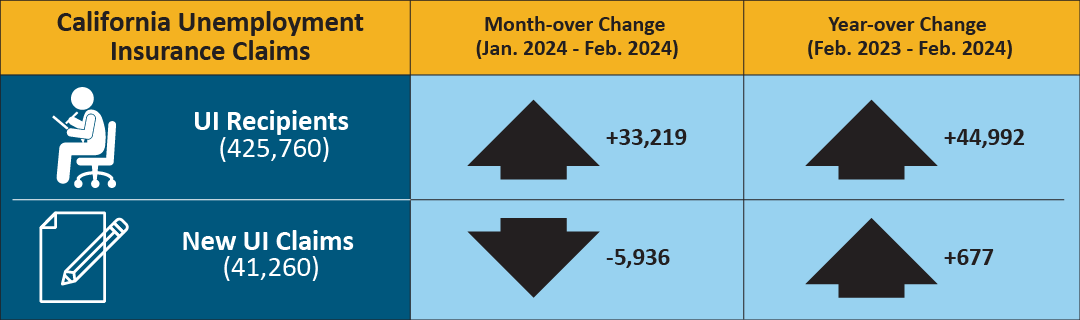
In related data that figures into the state’s unemployment rate, there were 425,760 people certifying for Unemployment Insurance (UI) benefits during the February 2024 sample week. That compares to 392,541 people in January and 380,768 people in February 2023. Concurrently, 41,260 initial claims were processed in the February 2024 sample week, which was a month-over decrease of 5,936 claims from January, but a year-over increase of 677 claims from February 2023.
| California Unemployment Insurance Claims |
Month-over Change (January 2024-February 2024) |
Year-over Change (February 2023-February 2024) |
| UI Recipients (425,760) |
+33,219 |
+44,992 |
| New UI Claims (41,260) |
-5,936 |
+677 |
MONTHLY LABOR FORCE DATA FOR COUNTIES
February 2024 (Preliminary); 2023 Benchmark
NOT SEASONALLY ADJUSTED
| COUNTY |
LABOR FORCE |
EMPLOYMENT |
UNEMPLOYMENT |
RATE |
| STATE TOTAL |
19,394,300 |
18,316,000 |
1,078,300 |
5.6% |
| ALAMEDA |
826,100 |
785,500 |
40,600 |
4.9% |
| ALPINE |
650 |
610 |
40 |
6.2% |
| AMADOR |
14,650 |
13,750 |
900 |
6.1% |
| BUTTE |
93,600 |
87,200 |
6,400 |
6.8% |
| CALAVERAS |
22,260 |
21,030 |
1,230 |
5.5% |
| COLUSA |
11,170 |
8,880 |
2,280 |
20.4% |
| CONTRA COSTA |
552,100 |
524,300 |
27,800 |
5.0% |
| DEL NORTE |
9,240 |
8,630 |
610 |
6.6% |
| EL DORADO |
95,600 |
90,800 |
4,800 |
5.0% |
| FRESNO |
469,400 |
424,700 |
44,600 |
9.5% |
| GLENN |
12,740 |
11,710 |
1,030 |
8.1% |
| HUMBOLDT |
61,100 |
57,500 |
3,600 |
5.9% |
| IMPERIAL |
74,400 |
61,600 |
12,800 |
17.2% |
| INYO |
8,500 |
8,110 |
390 |
4.6% |
| KERN |
400,800 |
359,800 |
41,000 |
10.2% |
| KINGS |
60,200 |
53,900 |
6,300 |
10.5% |
| LAKE |
29,700 |
27,620 |
2,090 |
7.0% |
| LASSEN |
8,600 |
7,930 |
670 |
7.8% |
| LOS ANGELES |
5,014,600 |
4,761,700 |
252,900 |
5.0% |
| MADERA |
67,800 |
61,700 |
6,100 |
9.0% |
| MARIN |
133,300 |
128,000 |
5,300 |
4.0% |
| MARIPOSA |
7,520 |
7,010 |
520 |
6.9% |
| MENDOCINO |
37,990 |
35,640 |
2,340 |
6.2% |
| MERCED |
121,900 |
107,300 |
14,500 |
11.9% |
| MODOC |
3,200 |
2,880 |
320 |
10.1% |
| MONO |
9,840 |
9,440 |
400 |
4.1% |
| MONTEREY |
215,900 |
191,300 |
24,600 |
11.4% |
| NAPA |
72,500 |
69,300 |
3,200 |
4.5% |
| NEVADA |
50,160 |
47,770 |
2,390 |
4.8% |
| ORANGE |
1,597,400 |
1,530,100 |
67,200 |
4.2% |
| PLACER |
197,900 |
188,900 |
9,100 |
4.6% |
| PLUMAS |
7,330 |
6,440 |
890 |
12.2% |
| RIVERSIDE |
1,165,200 |
1,100,200 |
65,000 |
5.6% |
| SACRAMENTO |
742,100 |
703,000 |
39,100 |
5.3% |
| SAN BENITO |
32,400 |
29,800 |
2,600 |
7.9% |
| SAN BERNARDINO |
1,018,900 |
963,400 |
55,500 |
5.4% |
| SAN DIEGO |
1,602,200 |
1,526,100 |
76,100 |
4.7% |
| SAN FRANCISCO |
558,100 |
536,700 |
21,400 |
3.8% |
| SAN JOAQUIN |
351,000 |
324,400 |
26,600 |
7.6% |
| SAN LUIS OBISPO |
136,900 |
131,000 |
5,900 |
4.3% |
| SAN MATEO |
442,200 |
425,900 |
16,300 |
3.7% |
| SANTA BARBARA |
216,800 |
204,300 |
12,400 |
5.7% |
| SANTA CLARA |
1,034,000 |
989,300 |
44,700 |
4.3% |
| SANTA CRUZ |
133,300 |
122,600 |
10,600 |
8.0% |
| SHASTA |
75,100 |
69,900 |
5,200 |
6.9% |
| SIERRA |
1,320 |
1,230 |
100 |
7.3% |
| SISKIYOU |
17,060 |
15,550 |
1,510 |
8.9% |
| SOLANO |
205,400 |
193,700 |
11,700 |
5.7% |
| SONOMA |
250,800 |
239,700 |
11,100 |
4.4% |
| STANISLAUS |
248,500 |
229,100 |
19,400 |
7.8% |
| SUTTER |
47,500 |
42,600 |
4,800 |
10.2% |
| TEHAMA |
26,430 |
24,500 |
1,940 |
7.3% |
| TRINITY |
4,600 |
4,250 |
360 |
7.7% |
| TULARE |
216,800 |
190,100 |
26,800 |
12.3% |
| TUOLUMNE |
20,290 |
19,010 |
1,280 |
6.3% |
| VENTURA |
414,800 |
393,800 |
21,000 |
5.1% |
| YOLO |
111,700 |
104,700 |
7,000 |
6.3% |
| YUBA |
32,800 |
29,900 |
2,800 |
8.6% |