新聞發布號: 24-24
聯絡: Loree Levy/Greg Lawson
916-654-9029
mediainquiries@edd.ca.gov
重要説明: 2024年5月就業數據取自包括5月12日在內的調查周。6月數據計劃於2024年7月19日發布。
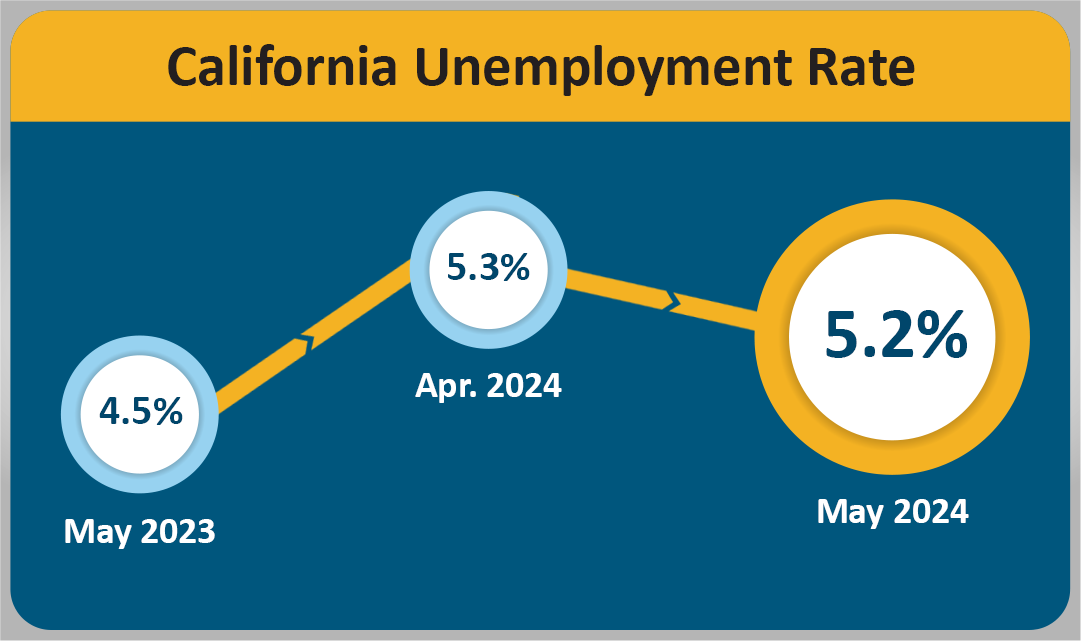
加州失業率降至 5.2%
薩克拉門托—2024 年 5 月加州雇主增加了 43,700 個非農就業崗位1——這是加州自 2023 年 10 月以來最大的增幅,也是加州 2024 年就業增長趨勢的延續。此外,根據就業發展部(EDD)發布的數據,失業率降至 5.2%2。5 月份的就業增長是以2024 年 4 月數據修訂後增加4,100 個就業崗位為基礎計算出來的。
從數字看加州的勞動力市場…
- 2024 年 5 月,加州就業市場擴張進入第 49 個月。自 2020 年 5 月以來,加州已增加 3,100,400 個就業崗位,平均每月增加 63,273 個就業崗位。
- 2024 年 5 月,加州新增 43,700 個就業崗位,占全國新增就業崗位 272,000 個的 1%,明顯高於加州 11% 的全國就業崗位份額。
- 加州 11 個行業中有 8 個在5 月份增加了就業機會,其中休閒和酒店業 (+10,200) 表現出最佳的月度增幅,部分原因是加州氣候的變化,從今年早些時候的雨季轉為旱季。該行業還受益於住宿和食品服務領域(包括快餐店)就業機會的增加,繼上個月增加 5,900 個職位後,5 月份又增加了 8,100 個職位。
- 貿易、運輸和公用事業(+5,100)也表現出顯著增長,卡車運輸和快遞與信使行業組的增長明顯高於平均水平。
- 信息類(-1,900)的就業崗位環比減少幅度最大,延續了四個月以來的走向。
1. 失業率來自對 5,100 戶加州家庭的單獨聯邦調查。
2. 非農就業人數來自對 80,000 家加州企業的聯邦調查。
經濟活動中的就業數據趨勢
非農就業崗位總數 (數據來自對大約 80,000 家加州企業的月度調查,該調查評估經濟活動中的就業崗位——經過季節性調整。)
-
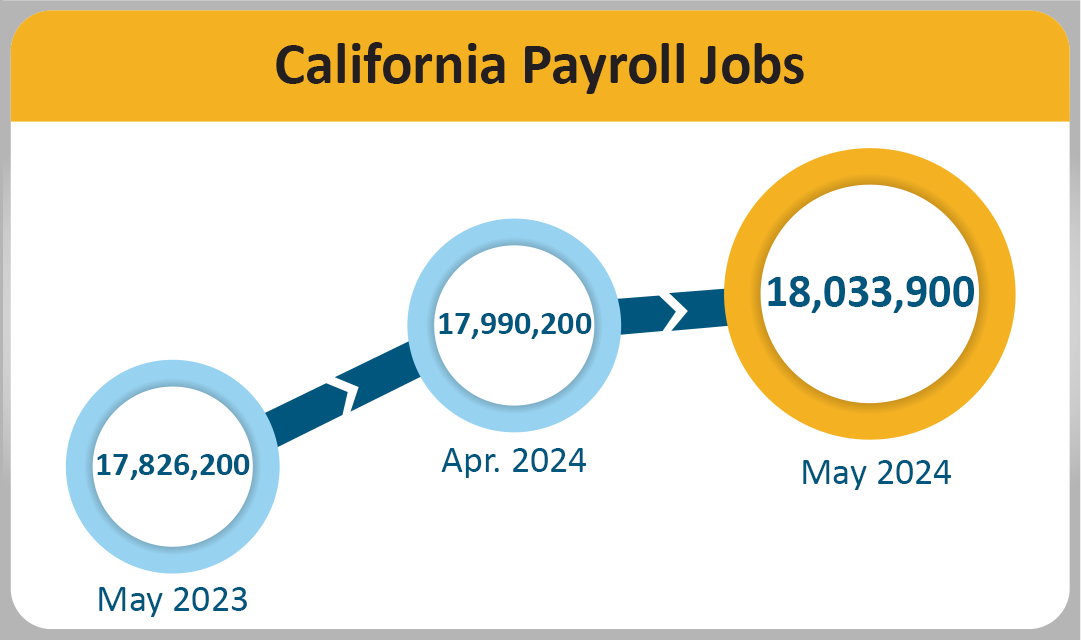
月環比— 5 月份加州 11 個主要行業的非農就業崗位總數達到 18,033,900 個——比 4 月份淨增加 43,700 個。而4 月份新增就業崗位,向下修正(-1,100),環比增長 4,100 個。
- 年同比— 從 2023 年 5 月到 2024 年 5 月,非農就業崗位總數增加了 207,700 個(增長 1.2%),而美國同期的年度增長為 2,756,000 個(增長 1.8%)。
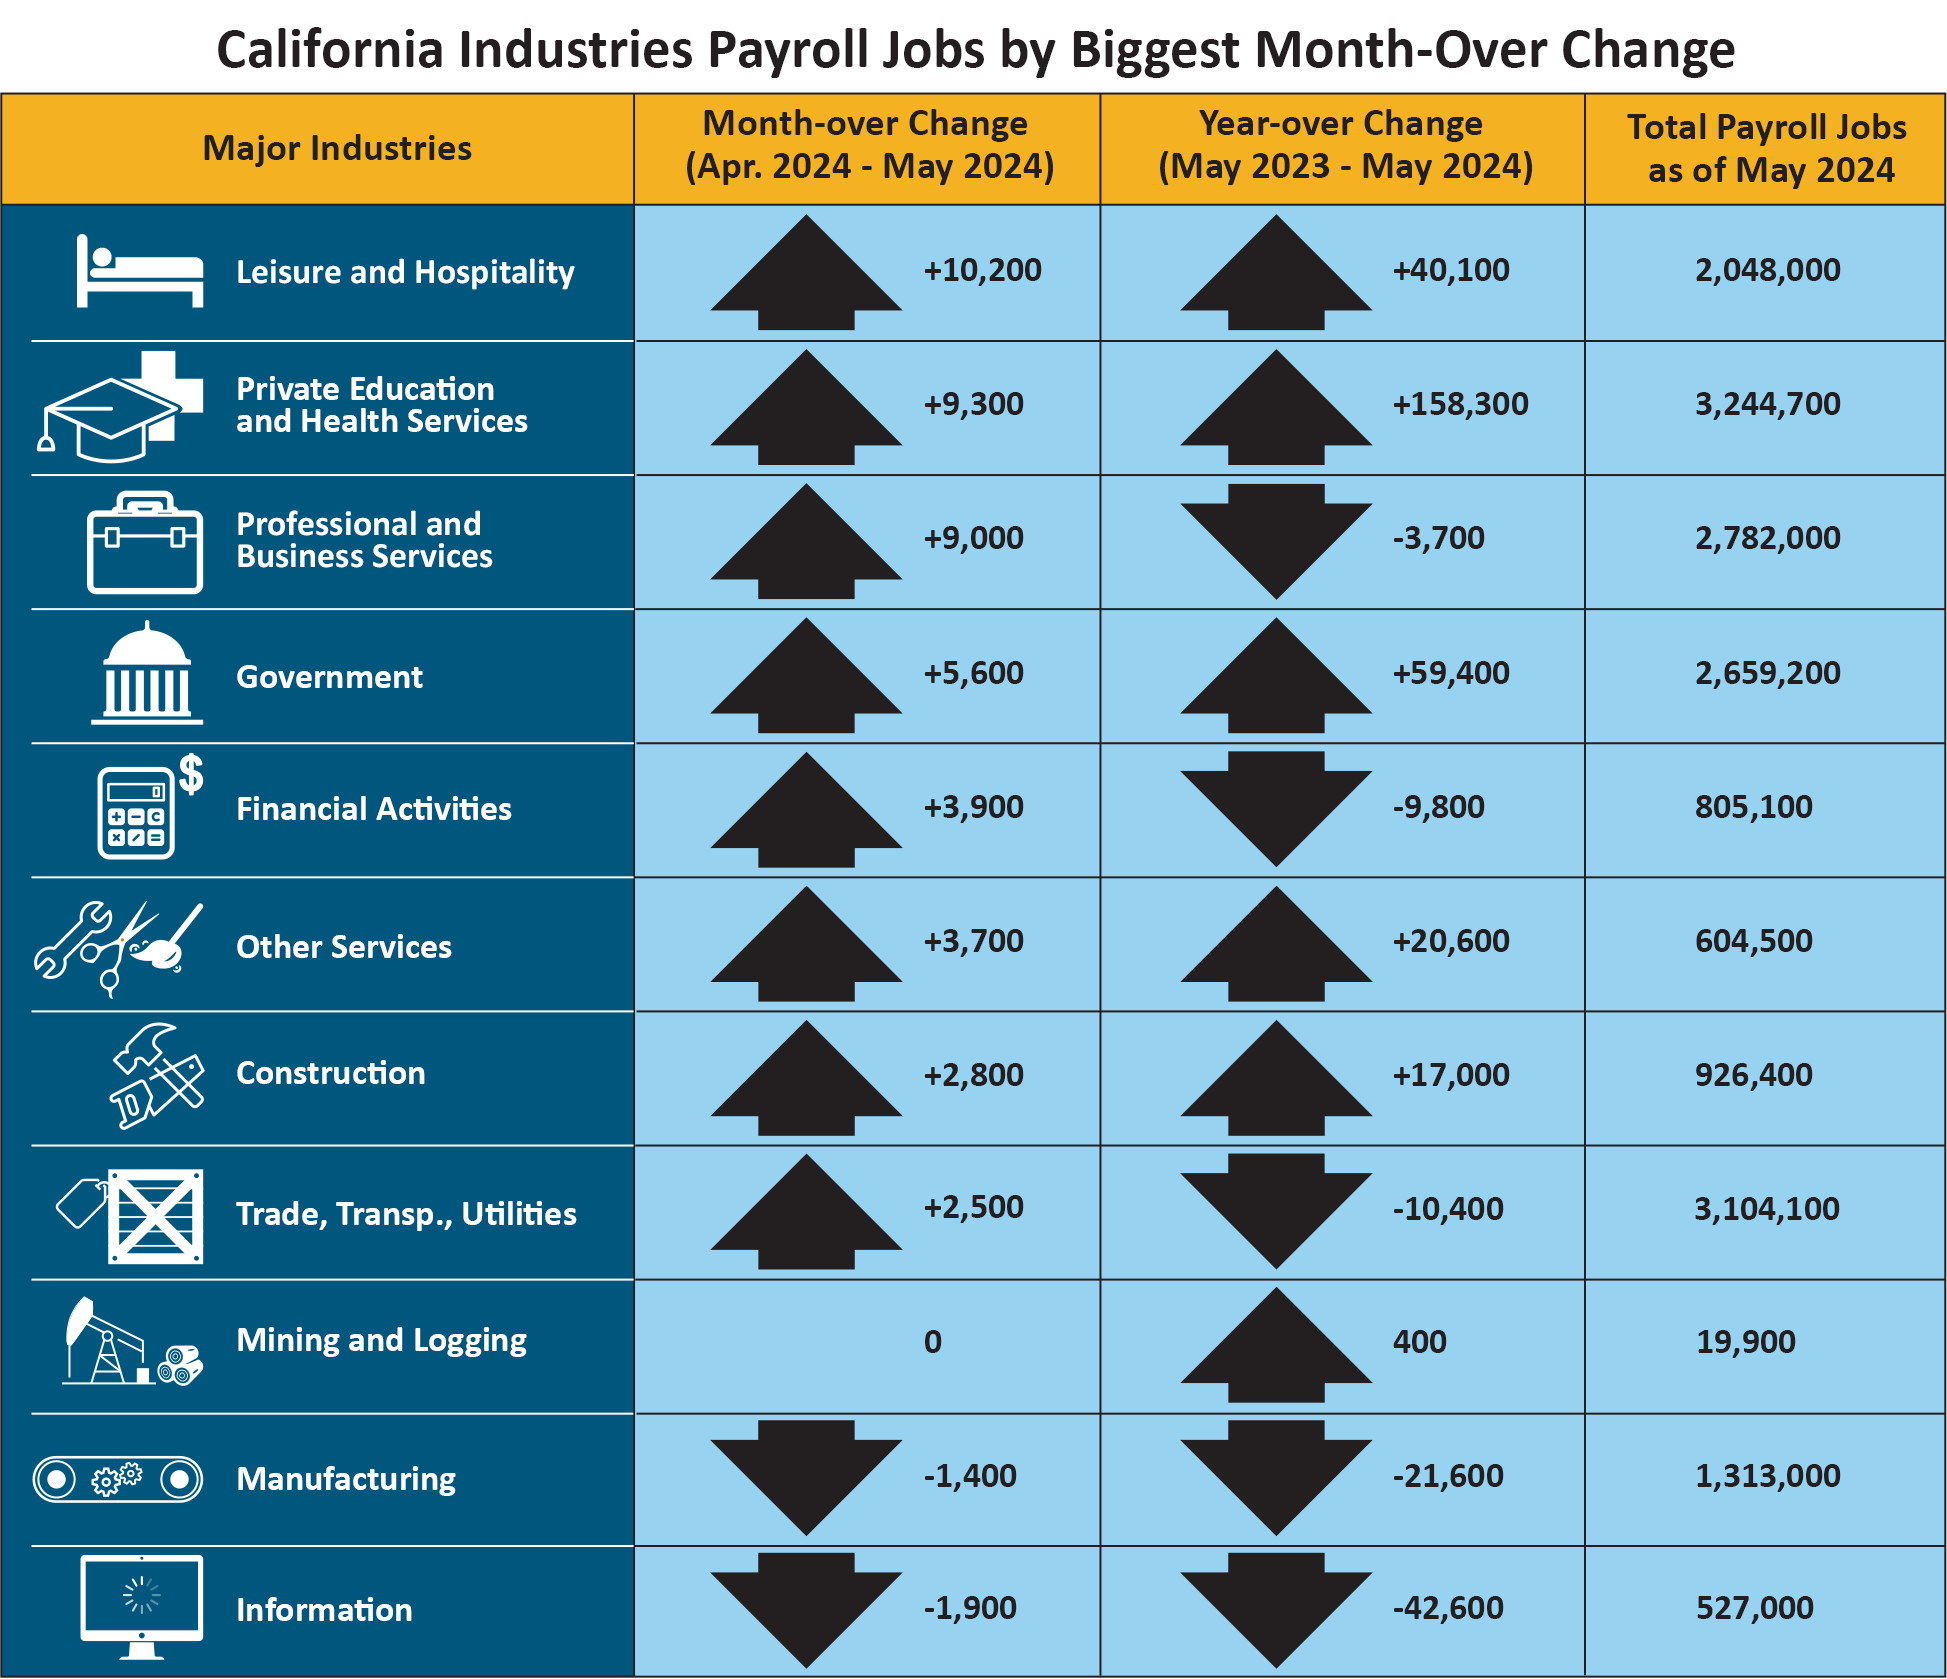
| Major Industries | Month-over Change (April 2024–May 2024) | Year-over Change (May 2023–May 2024) | Total Payroll Jobs as of May 2024 |
|---|---|---|---|
|
Leisure and Hospitality |
+10,200 | +40,100 | 2,048,000 |
|
Private Education and Health Services |
+9,300 | +158,300 | 3,244,700 |
|
Professional and Business Services |
+9,000 | -3,700 | 2,782,000 |
|
Government |
+5,600 | +59,400 | 2,659,200 |
|
Financial Activities |
+3,900 | -9,800 | 805,100 |
|
Other Services |
+3,700 | +20,600 | 604,500 |
|
Construction |
+2,800 | +17,000 | 926,000 |
|
Trade, Transp., Utilities |
+2,500 | -10,400 | 3,104,100 |
|
Mining and Logging |
0 | +400 | 19,900 |
|
Manufacturing |
-1,400 | -21,600 | 1,313,000 |
|
Information |
-1,900 | -42,600 | 527,000 |
農業就業崗位總數— 5 月份農業就業崗位總數較 4 月份增加 3,900 個,達到 410,600 個。 2024 年 5 月,農業的農場工作崗位比去年 5 月增加了 5,400 個。
經濟活動中的人力資源數據趨勢
加州的就業和失業(基於每月對 5,100 個加州家庭進行的聯邦調查,重點關注經濟活動中的工人。)
- 就業人數—5 月份加州就業人數為 18,328,600 人,比 4 月份的 18,319,100 人增加 9,500 人,但比 2023 年 5 月的就業總數減少 113,500 人。
- 失業人數—5 月份加州失業人數為 1,009,800 人,環比減少 17,700 人,但與 2023 年 5 月相比增加 141,800 人。.
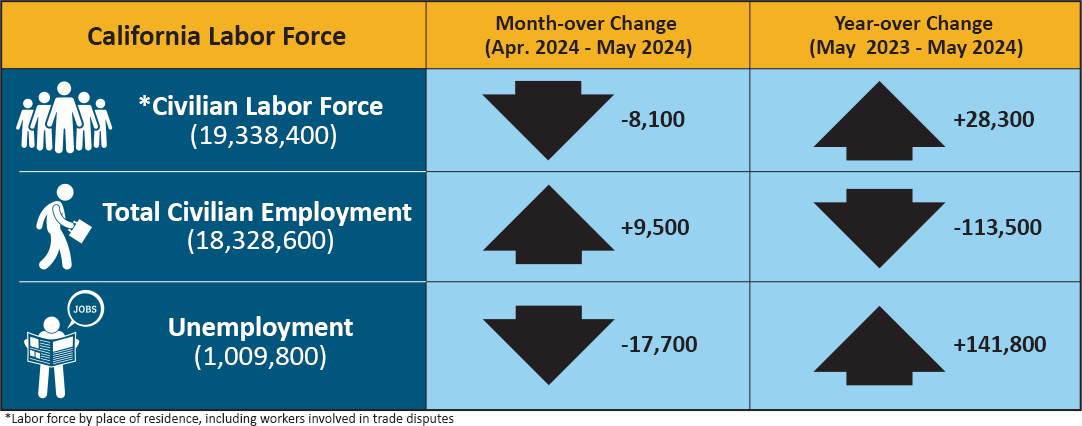
| California Labor Force | Month-over Change (April 2024–May 2024) | Year-over Change (May 2023–May 2024) |
|---|---|---|
| * Civilian Labor Force (19,338,400) | -8,100 | +28,300 |
| Total Civilian Employment (18,328,600) | +9,500 | -113,500 |
| Unemployment (1,009,800) | -17,700 | +141,800 |
* Labor force by place of residence, including workers involved in trade disputes.
申領失業保險金的人數(未經季節性調整 )
以下數據來自包括每月 19 日在內的樣本週:
根據用來計算加州失業率的相關數據,2024 年 5 月樣本周期間有 379,955 人領取失業保險 (UI) 福利。相比之下,2024年4 月有 411,413 人,2023 年 5 月有 391,004 人。同時,2024 年 5 月樣本周處理了 38,893 名初次申請,較 4 月份環比減少 6,243 人,較 2023 年 5 月同比減少 5,480 人。
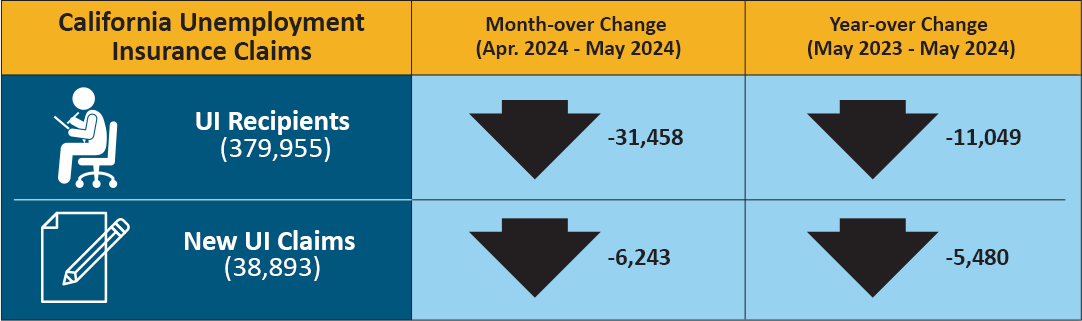
| California Unemployment Insurance Claims | Month-over Change (April 2024–May 2024) | Year-over Change (May 2023–May 2024) |
|---|---|---|
| UI Recipients (379,955) | -31,458 | -11,049 |
| New UI Claims (38,893) | -6,243 | -5,480 |
| COUNTY | LABOR FORCE | EMPLOYMENT | UNEMPLOYMENT | RATE |
|---|---|---|---|---|
| STATE TOTAL | 19,226,300 | 18,353,500 | 872,800 | 4.5% |
| ALAMEDA | 817,700 | 786,000 | 31,700 | 3.9% |
| ALPINE | 500 | 470 | 30 | 6.8% |
| AMADOR | 14,530 | 13,900 | 630 | 4.3% |
| BUTTE | 92,200 | 87,600 | 4,500 | 4.9% |
| CALAVERAS | 22,270 | 21,410 | 860 | 3.9% |
| COLUSA | 10,820 | 9,530 | 1,280 | 11.9% |
| CONTRA COSTA | 545,600 | 524,400 | 21,200 | 3.9% |
| DEL NORTE | 8,980 | 8,540 | 440 | 4.9% |
| EL DORADO | 94,000 | 90,500 | 3,400 | 3.7% |
| FRESNO | 458,400 | 425,500 | 32,900 | 7.2% |
| GLENN | 12,690 | 11,970 | 720 | 5.7% |
| HUMBOLDT | 60,200 | 57,700 | 2,500 | 4.1% |
| IMPERIAL | 72,400 | 61,300 | 11,100 | 15.4% |
| INYO | 8,500 | 8,230 | 260 | 3.1% |
| KERN | 390,900 | 358,400 | 32,400 | 8.3% |
| KINGS | 59,000 | 54,600 | 4,400 | 7.4% |
| LAKE | 28,250 | 26,860 | 1,390 | 4.9% |
| LASSEN | 8,520 | 8,120 | 400 | 4.7% |
| LOS ANGELES | 5,017,400 | 4,758,800 | 258,600 | 5.2% |
| MADERA | 66,100 | 61,500 | 4,500 | 6.8% |
| MARIN | 131,400 | 127,500 | 3,900 | 3.0% |
| MARIPOSA | 7,690 | 7,370 | 320 | 4.1% |
| MENDOCINO | 37,480 | 35,940 | 1,540 | 4.1% |
| MERCED | 120,800 | 110,400 | 10,500 | 8.7% |
| MODOC | 3,260 | 3,090 | 170 | 5.2% |
| MONO | 8,920 | 8,630 | 290 | 3.3% |
| MONTEREY | 224,800 | 211,900 | 12,900 | 5.7% |
| NAPA | 72,800 | 70,500 | 2,300 | 3.1% |
| NEVADA | 48,460 | 46,740 | 1,720 | 3.5% |
| ORANGE | 1,575,500 | 1,524,600 | 51,000 | 3.2% |
| PLACER | 195,000 | 188,400 | 6,600 | 3.4% |
| PLUMAS | 7,420 | 7,000 | 430 | 5.7% |
| RIVERSIDE | 1,146,600 | 1,096,400 | 50,200 | 4.4% |
| SACRAMENTO | 731,000 | 701,800 | 29,200 | 4.0% |
| SAN BENITO | 31,900 | 30,000 | 1,800 | 5.8% |
| SAN BERNARDINO | 1,003,100 | 960,200 | 42,900 | 4.3% |
| SAN DIEGO | 1,580,100 | 1,522,600 | 57,500 | 3.6% |
| SAN FRANCISCO | 550,800 | 534,100 | 16,700 | 3.0% |
| SAN JOAQUIN | 351,400 | 331,900 | 19,500 | 5.5% |
| SAN LUIS OBISPO | 135,800 | 131,800 | 4,000 | 3.0% |
| SAN MATEO | 436,200 | 423,700 | 12,500 | 2.9% |
| SANTA BARBARA | 220,700 | 213,300 | 7,400 | 3.3% |
| SANTA CLARA | 1,023,100 | 988,500 | 34,600 | 3.4% |
| SANTA CRUZ | 132,900 | 126,100 | 6,800 | 5.1% |
| SHASTA | 74,000 | 70,600 | 3,400 | 4.6% |
| SIERRA | 1,360 | 1,300 | 60 | 4.0% |
| SISKIYOU | 16,390 | 15,480 | 910 | 5.5% |
| SOLANO | 203,300 | 194,400 | 8,900 | 4.4% |
| SONOMA | 248,800 | 240,700 | 8,100 | 3.3% |
| STANISLAUS | 247,700 | 232,400 | 15,300 | 6.2% |
| SUTTER | 47,700 | 44,000 | 3,600 | 7.6% |
| TEHAMA | 25,850 | 24,480 | 1,370 | 5.3% |
| TRINITY | 4,610 | 4,390 | 230 | 4.9% |
| TULARE | 215,700 | 195,600 | 20,100 | 9.3% |
| TUOLUMNE | 19,950 | 19,050 | 900 | 4.5% |
| VENTURA | 413,000 | 397,700 | 15,200 | 3.7% |
| YOLO | 109,600 | 105,000 | 4,700 | 4.2% |
| YUBA | 32,300 | 30,300 | 2,000 | 6.1% |