NR 序號: 23-22
聯絡人: Loree Levy/Aubrey Henry
916-654-9029
mediainquiries@edd.ca.gov
重要説明: 2023 年 4 月的就業數據取自包括 4 月 12 日在內的取樣週。 5 月份的數據定於 2023 年 6 月 16 日發布。
雇主增加了 67,000 個非農就業崗位
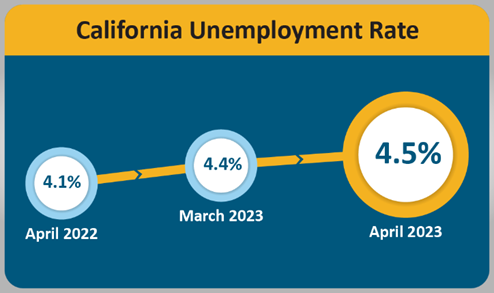
薩克拉門托—加州就業發展局(EDD)今天公佈的兩項調查數據顯示,加州的失業率在 2023 年 3 月至 2023 年 4 月期間上升了 0.1%至 4.5%1,同時加州雇主為經濟活動增加了 67,000 個非 農就業崗位 2。
從數字看加州的勞動力市場…
- 自 2020 年 4 月開始直至當前的經濟擴張以來,加州已經增加了 3,120,000 個工作崗位, 在此期間每月平均增加 86,667 個工作崗位。
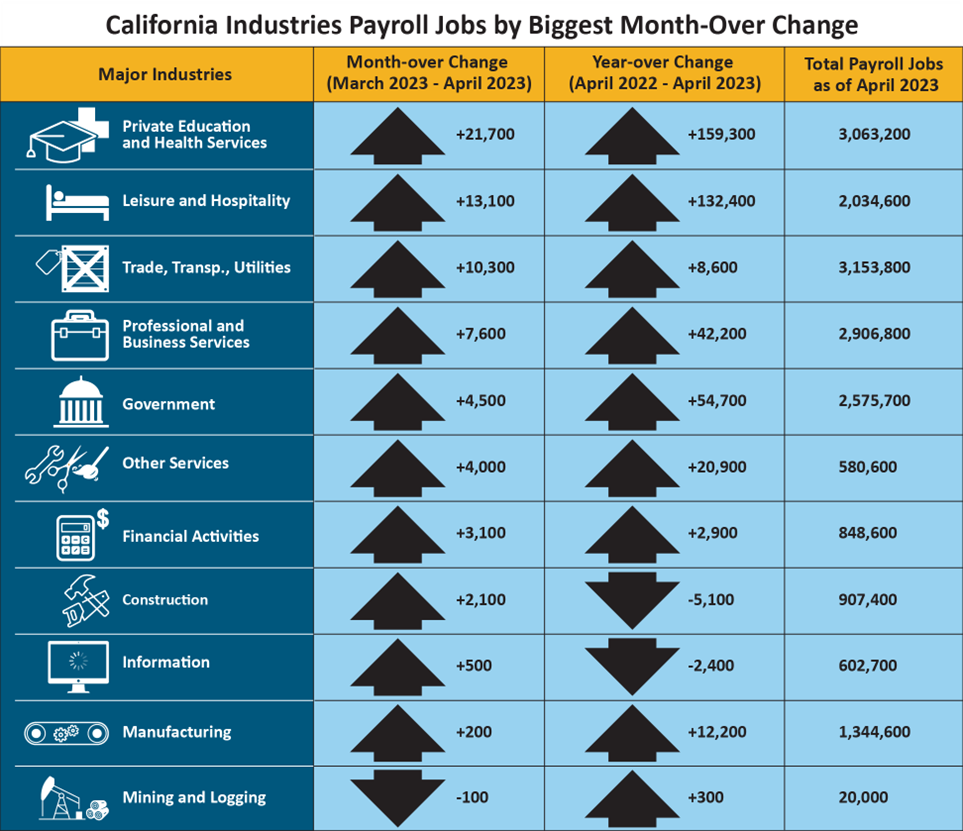
- 加利福尼亞州 11 個行業中的 10 個在 4 月份呈現就業增加趨勢,其中私立教育和醫療服務 (+21,700)領引增長,個人和家庭服務行業亦顯著上升。
- 在表演藝術、觀眾體育及相關行業,在食品服務和飲酒場所行業組合推動下,休閒和酒店 業(+13,100)實現了第二大月度增長。
- 由於機動車和零件經銷商、加油站和燃料經銷商、卡車運輸和運輸相關活動的強勁表現, 貿易、運輸和公用事業實現了顯著的月度增長(+10,300) 。
- 採礦和伐木業(-100)是唯一月度就業人數下降的行業,儘管與 2022 年 4 月相比,該行業 的就業總數保持淨增長(+300) 。
1. 失業率來自對 5,100 戶加州家庭的單獨聯邦調查。
2. 非農就業人數來自對 80,000 家加州企業的聯邦調查。
經濟活動中的就業數據趨勢
非農就業崗位總數 (數據來自對大約 80,000 家加州企業的月度調查,該調查評估經濟活動中 的就業崗位——經過季節性調整) 。
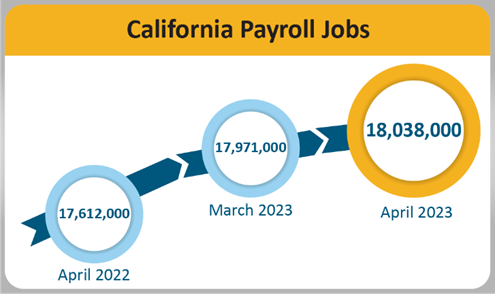
- 月環比—4 月份加州 11 個主要行業的非農就業崗位總數為 18,038,000 個——比 3 月份淨 增 67,000 個。這數字是繼 3 月份就業崗位向上修正(+3,200)為 11,900 個後得出的。
- 年同比—從 2022 年 4 月到 2023 年 4 月,加州非農就業崗位總數增加了 426,000 個(增 長 2.4% ),而美國每年增加 3,995,000 個(增長 2.6% )。
| Major Industries |
Month-over Change (March 2023–April 2023) |
Year-over Change (April 2022–April 2023) |
Total Payroll Jobs as of April 2023 |
|
Private Education and Health Services
|
+21,700 |
+159,300 |
3,063,200 |
|
Leisure and Hospitality
|
+13,100 |
+132,400 |
2,034,600 |
|
Trade, Transp., Utilities
|
+10,300 |
+8,600 |
3,153,800 |
|
Professional and Business Services
|
+7,600 |
+42,200 |
2,906,800 |
|
Government
|
+4,500 |
+54,700 |
2,575,700 |
|
Other Services
|
+4,000 |
+20,900 |
580,600 |
|
Financial Activities
|
+3,100 |
+2,900 |
848,600 |
|
Construction
|
+2,100 |
-5,100 |
907,400 |
|
Information
|
+500 |
-2,400 |
602,700 |
|
Manufacturing
|
+200 |
+12,200 |
1,344,600 |
|
Mining and Logging
|
-100 |
+300 |
20,000 |
Total Farm jobs – The number of jobs in the agriculture industry decreased from March by 2,100 to to a total of 432,800 jobs in April. The agricultural industry had 10,000 more farm jobs in April 2023 than it did in April a year ago.
Data Trends about Workers in the Economy
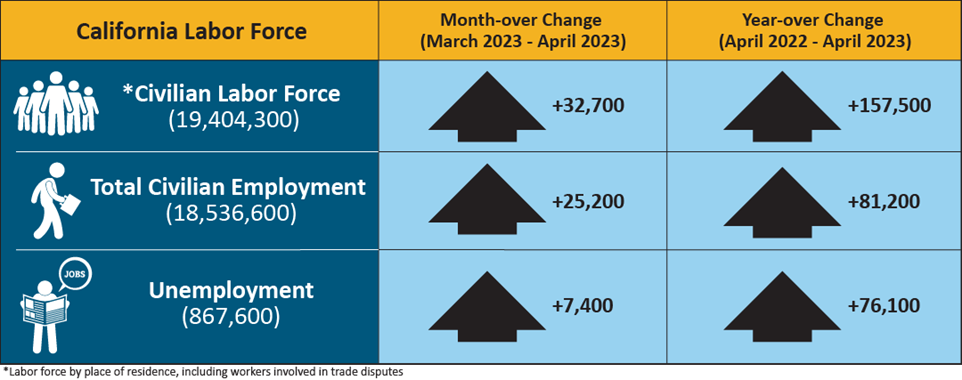
Employment and Unemployment in California (Based on a monthly federal survey of 5,100 California households which focuses on workers in the economy)
- Employed – The number of Californians employed in April was 18,536,600, an increase of 25,200 persons from March’s total of 18,511,400, and up 81,200 from the employment total in April
- Unemployed – The number of unemployed Californians was 867,600 in April, an increase of 7,400 over the month and up 76,100 in comparison to April 2022.
| California Labor Force |
Month-over Change (March 2023–April 2023) |
Year-over Change (April 2022–April 2023) |
| * Civilian Labor Force (19,404,300) |
+32,700 |
+157,500 |
| Total Civilian Employment (18,536,600) |
+25,200 |
+81,200 |
| Unemployment (867,600) |
+7,400 |
+76,100 |
* Labor force by place of residence, including workers involved in trade disputes.
Unemployment Insurance Claims (Not Seasonally Adjusted)
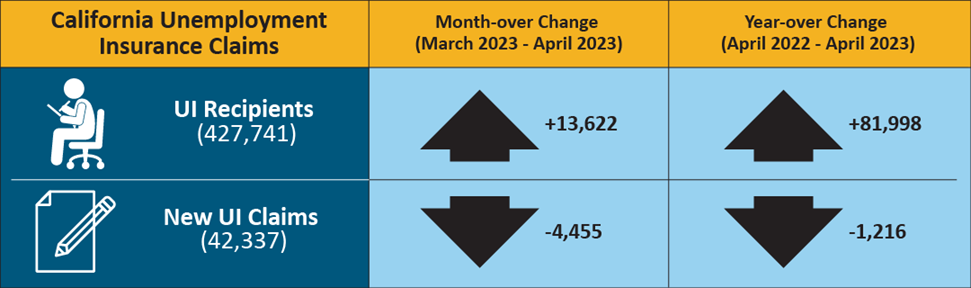
The following data is from a sample week that includes the 19th of each month: In related data that figures into the state’s unemployment rate, there were 427,741 people certifying for Unemployment Insurance benefits during the April 2023 sample week. That compares to 414,119 people in March and 345,743 people in April 2022. Concurrently, 42,337 initial claims were processed in the April 2023 sample week, which was a month-over increase of 13,622 claims from March and also a year-over increase of 81,998 claims from April 2022.
| California Unemployment Insurance Claims |
Month-over Change (March 2023–April 2023) |
Year-over Change (April 2022–April 2023) |
| UI Recipients (427,741) |
+13,622 |
+81,998 |
| New UI Claims (42,337) |
-4,455 |
-1,216 |
MONTHLY LABOR FORCE DATA FOR COUNTIES
April 2023 (Preliminary); 2022 Benchmark
NOT SEASONALLY ADJUSTED
| COUNTY |
LABOR FORCE |
EMPLOYMENT |
UNEMPLOYMENT |
RATE |
| STATE TOTAL |
19,307,900 |
18,481,800 |
826,100 |
4.3% |
| ALAMEDA |
824,100 |
795,800 |
28,300 |
3.4% |
| ALPINE |
530 |
500 |
30 |
6.0% |
| AMADOR |
14,210 |
13,520 |
690 |
4.9% |
| BUTTE |
92,100 |
87,600 |
4,500 |
4.9% |
| CALAVERAS |
21,970 |
21,110 |
860 |
3.9% |
| COLUSA |
10,230 |
8,710 |
1,520 |
14.8% |
| CONTRA COSTA |
549,500 |
530,000 |
19,600 |
3.6% |
| DEL NORTE |
9,180 |
8,690 |
490 |
5.3% |
| EL DORADO |
94,000 |
90,600 |
3,400 |
3.6% |
| FRESNO |
462,300 |
427,900 |
34,400 |
7.4% |
| GLENN |
12,500 |
11,730 |
770 |
6.2% |
| HUMBOLDT |
59,400 |
56,900 |
2,500 |
4.2% |
| IMPERIAL |
69,100 |
59,400 |
9,700 |
14.1% |
| INYO |
8,200 |
7,910 |
290 |
3.5% |
| KERN |
395,600 |
362,900 |
32,800 |
8.3% |
| KINGS |
57,600 |
52,800 |
4,800 |
8.3% |
| LAKE |
27,750 |
26,270 |
1,490 |
5.4% |
| LASSEN |
8,730 |
8,280 |
450 |
5.1% |
| LOS ANGELES |
4,990,800 |
4,765,300 |
225,500 |
4.5% |
| MADERA |
65,800 |
60,900 |
4,900 |
7.4% |
| MARIN |
130,600 |
126,900 |
3,700 |
2.8% |
| MARIPOSA |
7,140 |
6,770 |
370 |
5.1% |
| MENDOCINO |
35,970 |
34,330 |
1,640 |
4.6% |
| MERCED |
116,900 |
105,600 |
11,300 |
9.7% |
| MODOC |
3,150 |
2,930 |
220 |
6.8% |
| MONO |
8,440 |
8,130 |
310 |
3.6% |
| MONTEREY |
232,500 |
215,500 |
17,000 |
7.3% |
| NAPA |
71,500 |
69,200 |
2,300 |
3.2% |
| NEVADA |
47,220 |
45,480 |
1,740 |
3.7% |
| ORANGE |
1,595,300 |
1,546,800 |
48,500 |
3.0% |
| PLACER |
195,300 |
189,000 |
6,400 |
3.3% |
| PLUMAS |
7,060 |
6,440 |
620 |
8.7% |
| RIVERSIDE |
1,142,400 |
1,095,100 |
47,300 |
4.1% |
| SACRAMENTO |
733,100 |
704,200 |
28,900 |
3.9% |
| SAN BENITO |
32,700 |
30,800 |
1,900 |
5.8% |
| SAN BERNARDINO |
1,000,400 |
959,700 |
40,700 |
4.1% |
| SAN DIEGO |
1,599,200 |
1,546,500 |
52,700 |
3.3% |
| SAN FRANCISCO |
574,900 |
559,300 |
15,500 |
2.7% |
| SAN JOAQUIN |
344,700 |
324,600 |
20,100 |
5.8% |
| SAN LUIS OBISPO |
139,100 |
134,900 |
4,200 |
3.0% |
| SAN MATEO |
454,700 |
443,300 |
11,500 |
2.5% |
| SANTA BARBARA |
228,200 |
219,700 |
8,400 |
3.7% |
| SANTA CLARA |
1,044,400 |
1,013,700 |
30,700 |
2.9% |
| SANTA CRUZ |
134,400 |
126,400 |
8,100 |
6.0% |
| SHASTA |
73,400 |
69,800 |
3,700 |
5.0% |
| SIERRA |
1,270 |
1,200 |
70 |
5.8% |
| SISKIYOU |
16,200 |
15,190 |
1,010 |
6.3% |
| SOLANO |
201,900 |
193,400 |
8,500 |
4.2% |
| SONOMA |
249,300 |
241,500 |
7,900 |
3.2% |
| STANISLAUS |
243,600 |
228,500 |
15,100 |
6.2% |
| SUTTER |
47,200 |
43,400 |
3,800 |
8.1% |
| TEHAMA |
25,190 |
23,720 |
1,460 |
5.8% |
| TRINITY |
4,340 |
4,080 |
260 |
6.0% |
| TULARE |
213,700 |
192,900 |
20,800 |
9.7% |
| TUOLUMNE |
19,300 |
18,360 |
940 |
4.9% |
| VENTURA |
416,900 |
402,100 |
14,900 |
3.6% |
| YOLO |
110,200 |
105,500 |
4,800 |
4.3% |
| YUBA |
32,200 |
30,100 |
2,100 |
6.4% |