NR No. 22-26
Contact: Loree Levy/Aubrey Henry
916-654-9029
mediainquiries@edd.ca.gov
IMPORTANT NOTE: The employment data for the month of June 2022 is taken from the survey week including June 12th. Data for the month of July is scheduled for release on Aug. 19, 2022.
Employers added 19,900 nonfarm payroll jobs
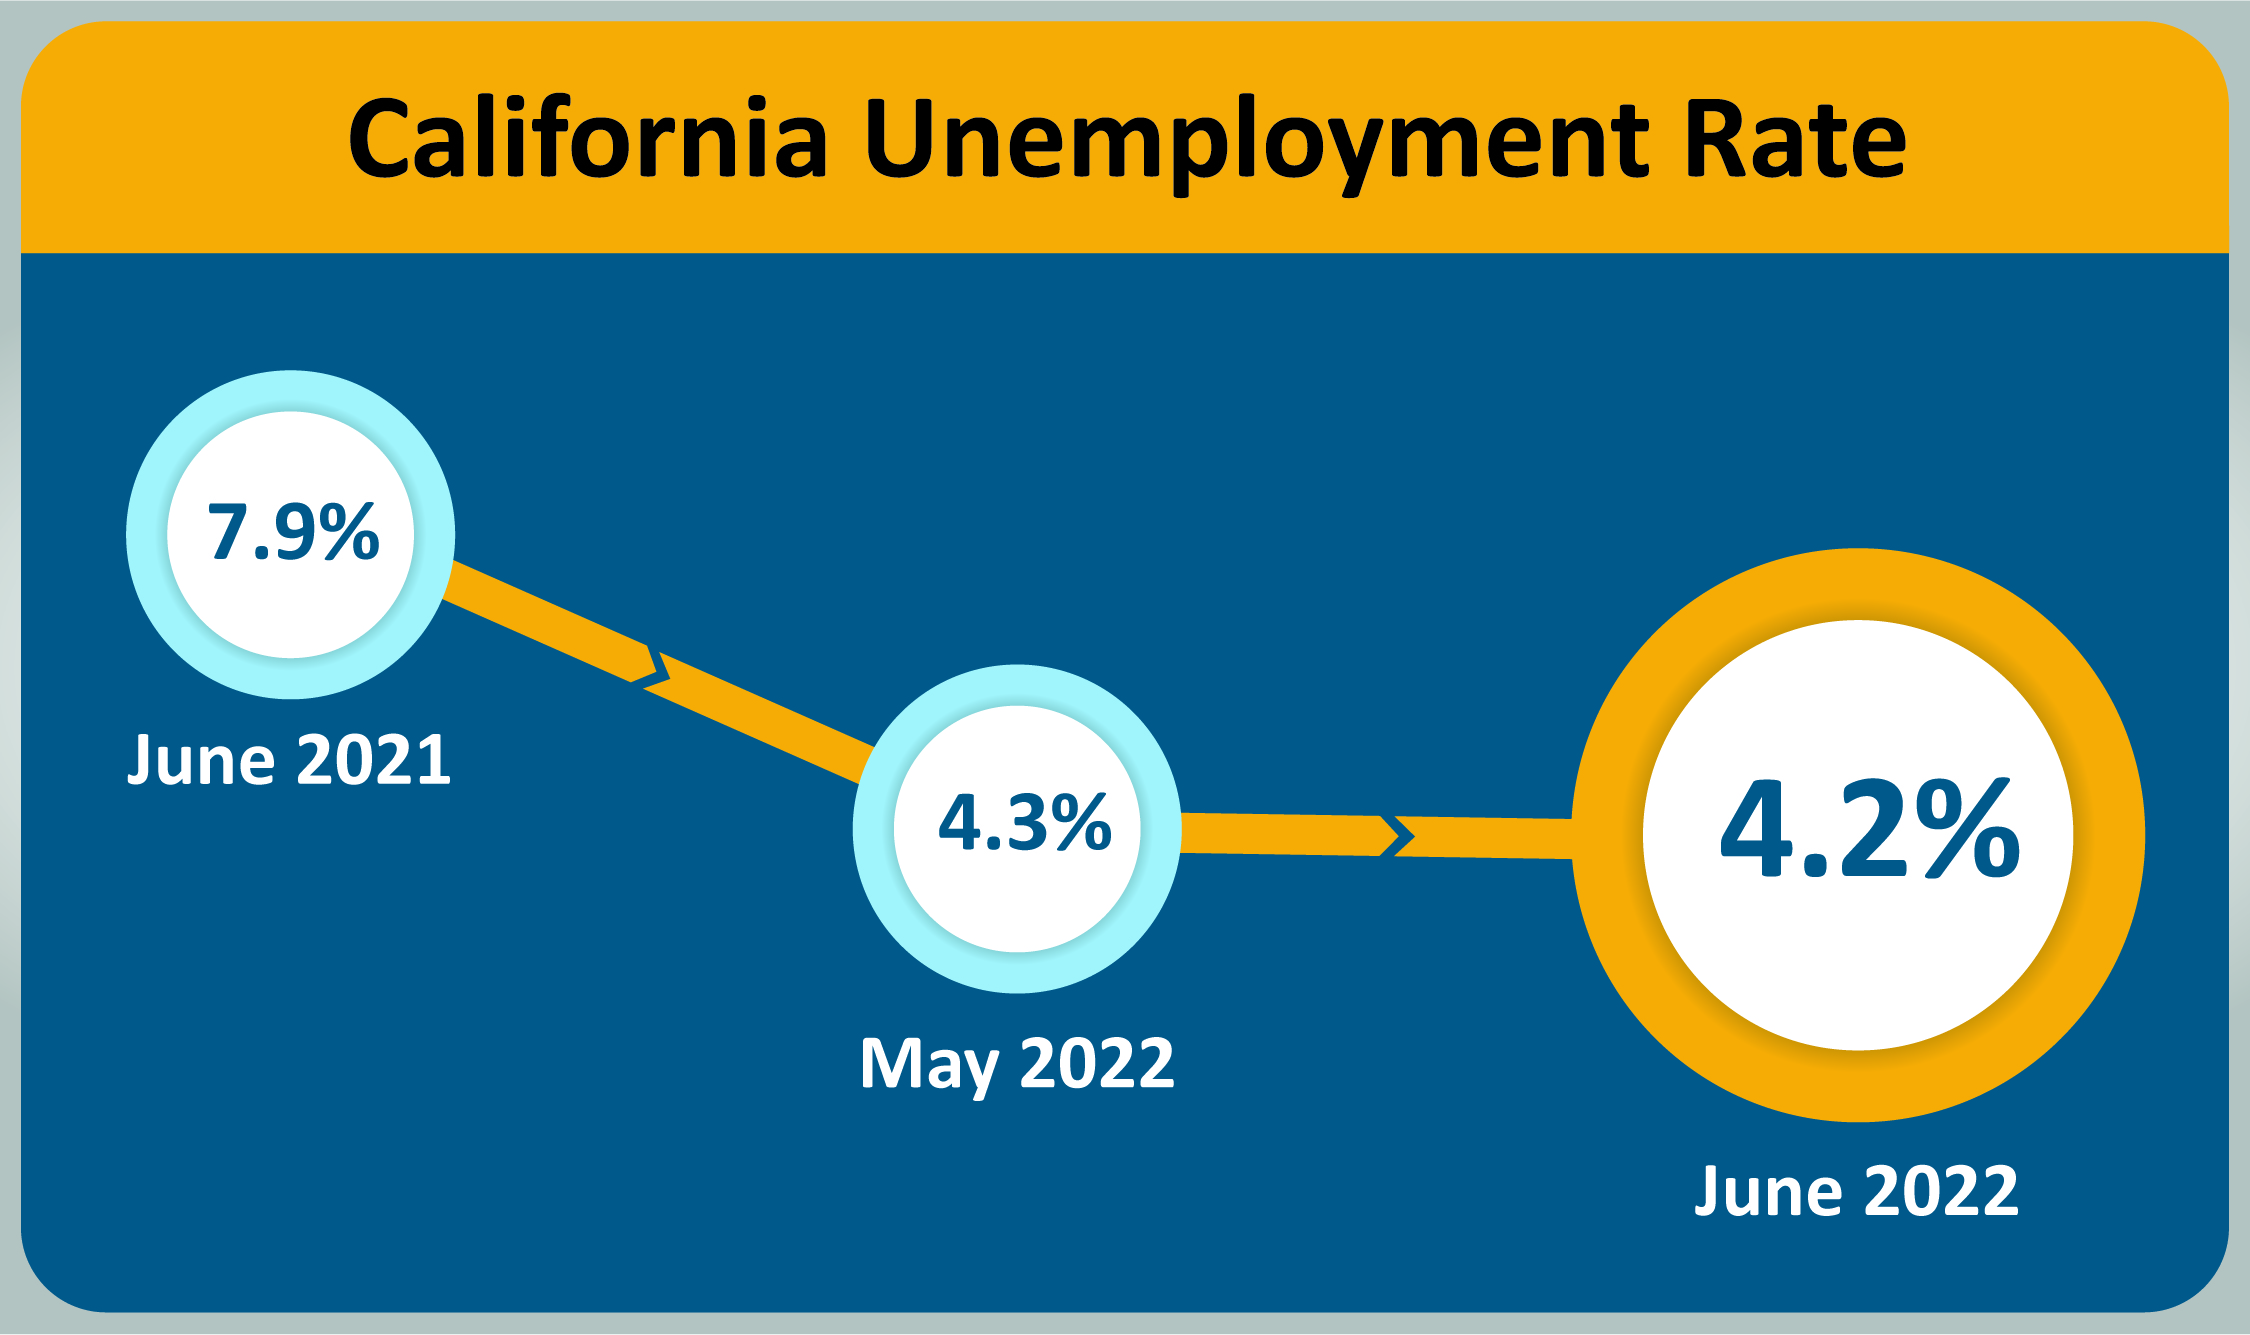
SACRAMENTO – California’s unemployment rate dropped in the month of June 2022 to 4.2 percent1 as the state’s employers added 19,900 nonfarm payroll jobs2 to the economy, according to data released today by the California Employment Development Department (EDD) from two surveys.
California’s Labor Market, by the Numbers...
- California has now regained 93.6 percent (2,582,900) of the 2,758,900 nonfarm jobs lost during March and April of 2020 due to the COVID-19 pandemic.
- June 2022 marked the sixth consecutive month of labor force gains and the twelfth consecutive month with a decrease in unemployment.
- June 2022 also marked the ninth consecutive month-over gain for nonfarm jobs, with 561,300 such jobs gained over that time period.
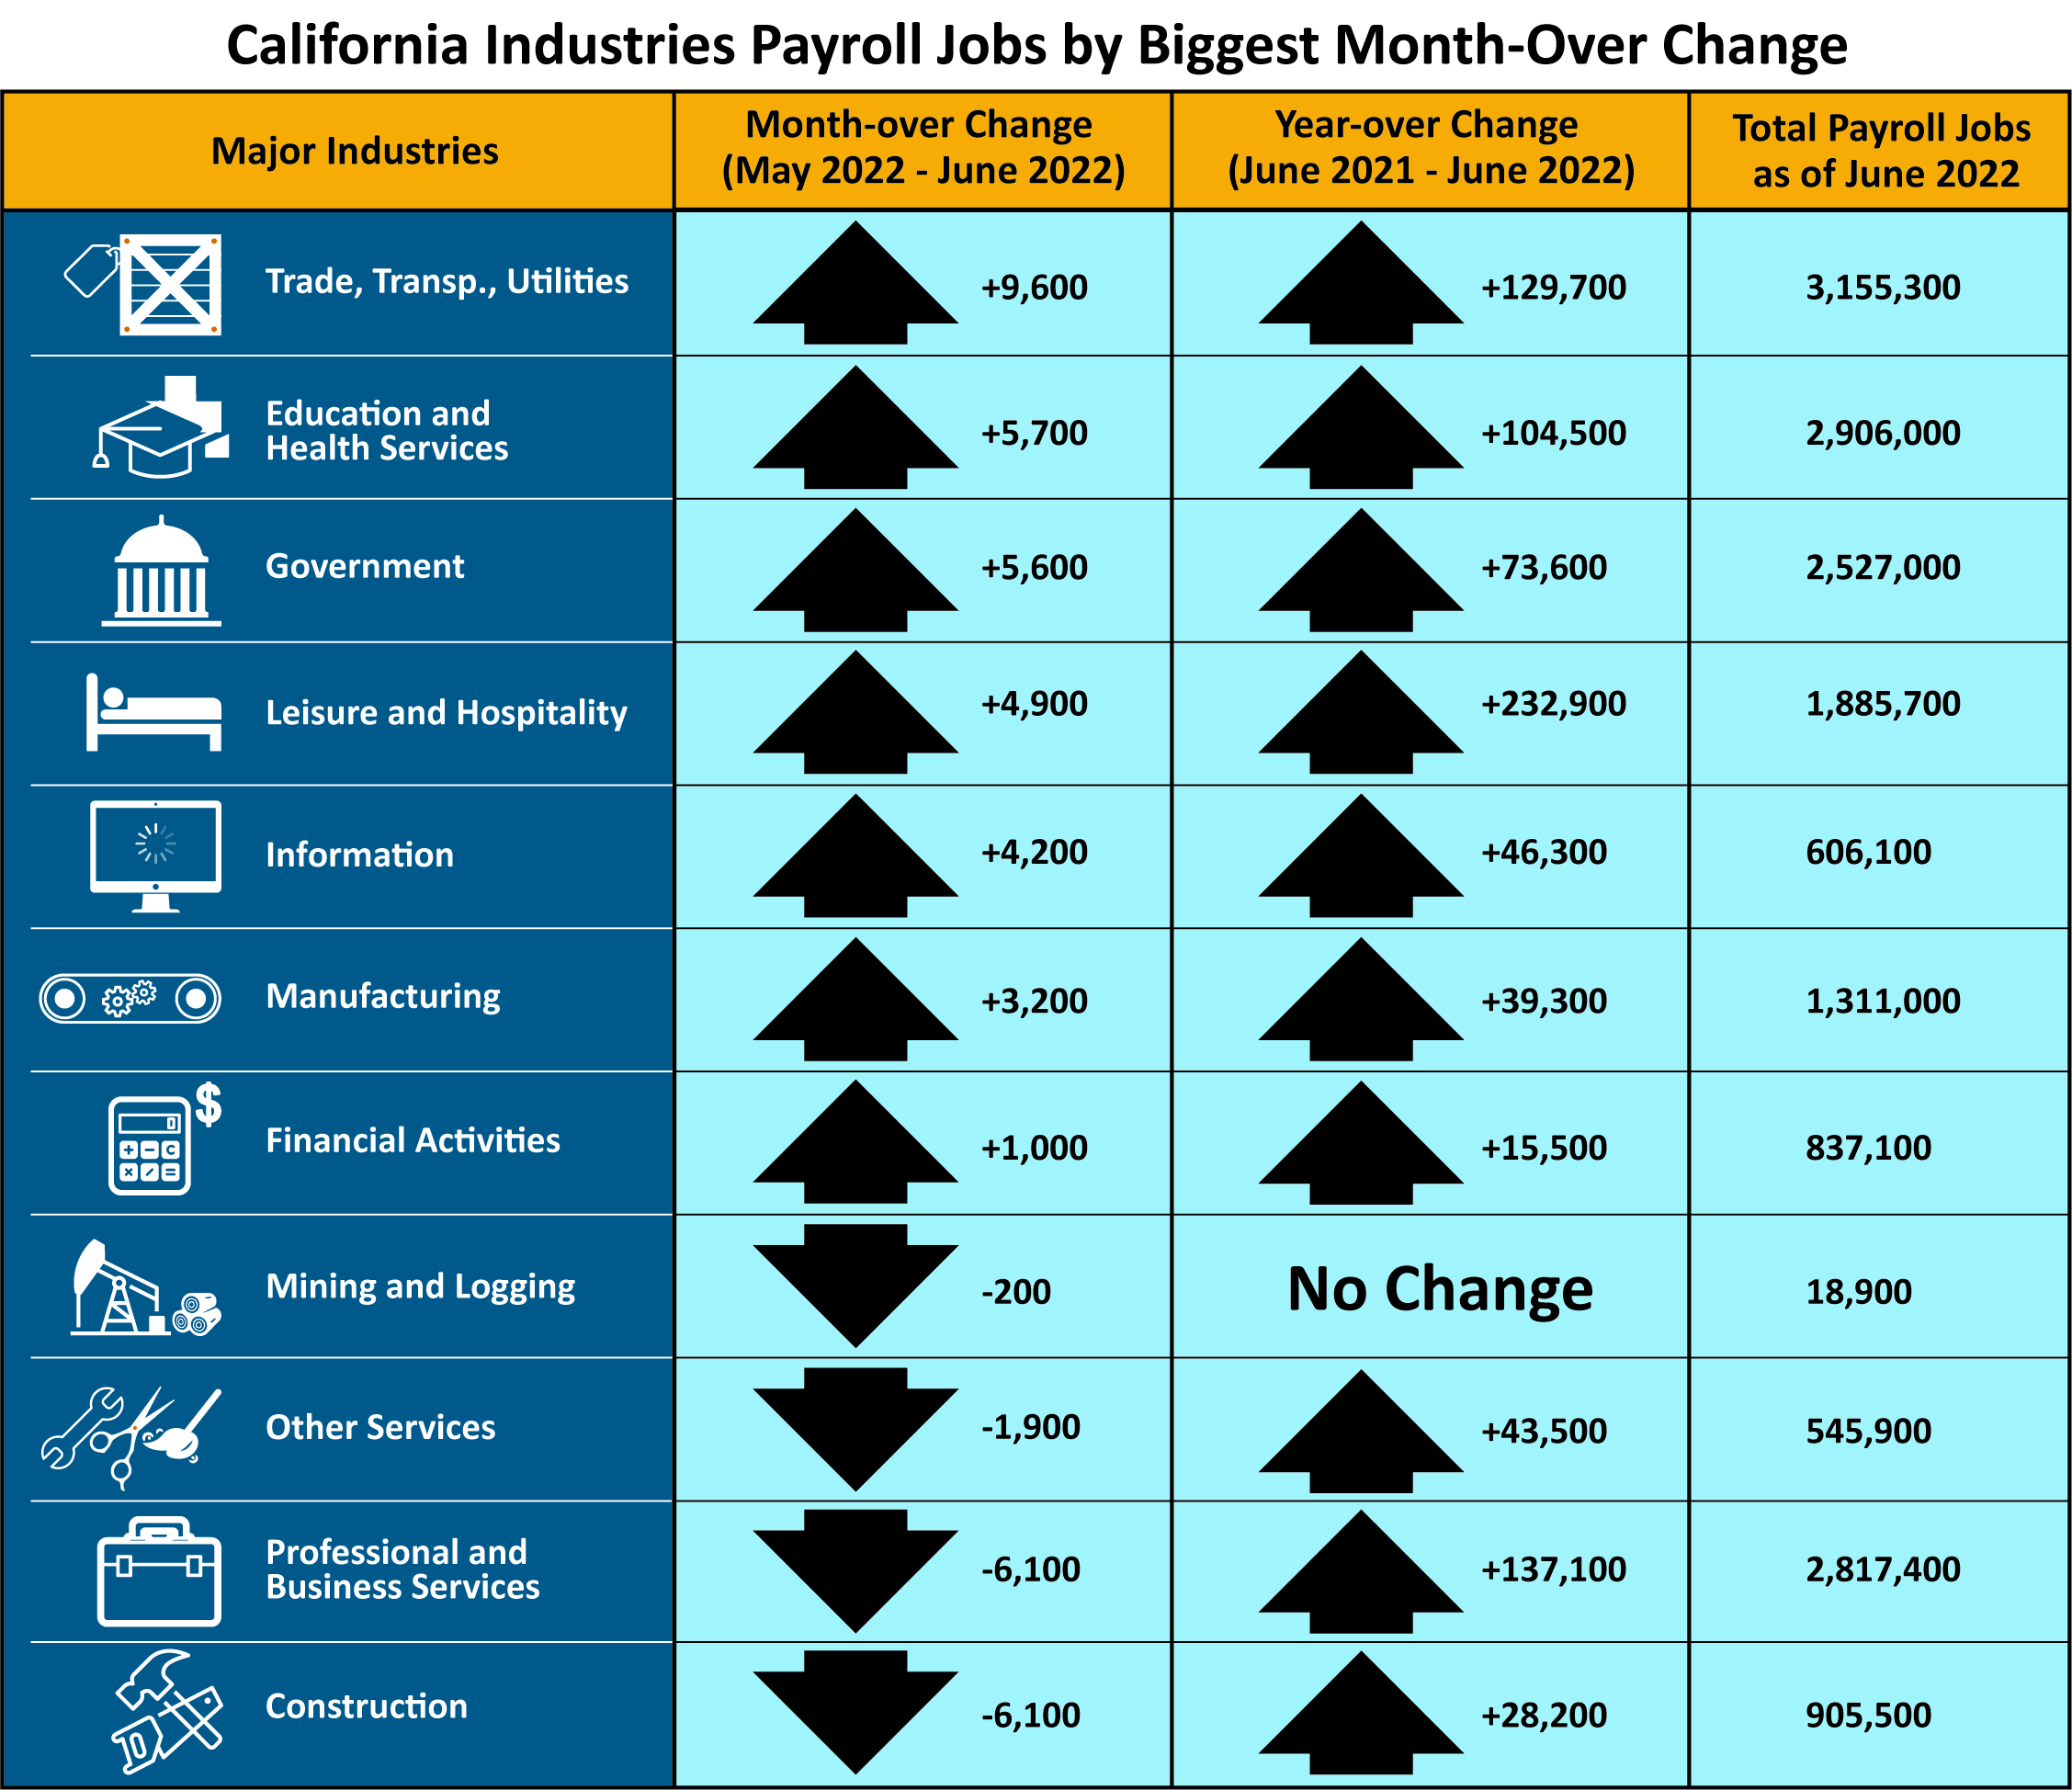
- Seven of California’s 11 industry sectors gained jobs with Trade, Transportation, and Utilities (+9,600) having the largest month-over gain thanks to strength in Retail as well as in Transportation and Warehousing.
- Education and Health Services (+5,700) also had strong month-over growth thanks to gains in Health Care and Social Assistance.
- Both Professional and Business Services (-6,100) and Construction (-6,100) had June 2022’s largest month-over losses due to declines in Accounting and Employment Services for the former and losses in Building Foundation and Exterior Contractors for the latter.
1. The unemployment rate comes from a separate federal survey of 5,100 California households.
2. The nonfarm payroll job numbers come from a federal survey of 80,000 California businesses.
Data Trends about Jobs in the Economy
Total Nonfarm Payroll Jobs
This comes from a monthly survey of approximately 80,000 California businesses that estimates jobs in the economy – seasonally adjusted.
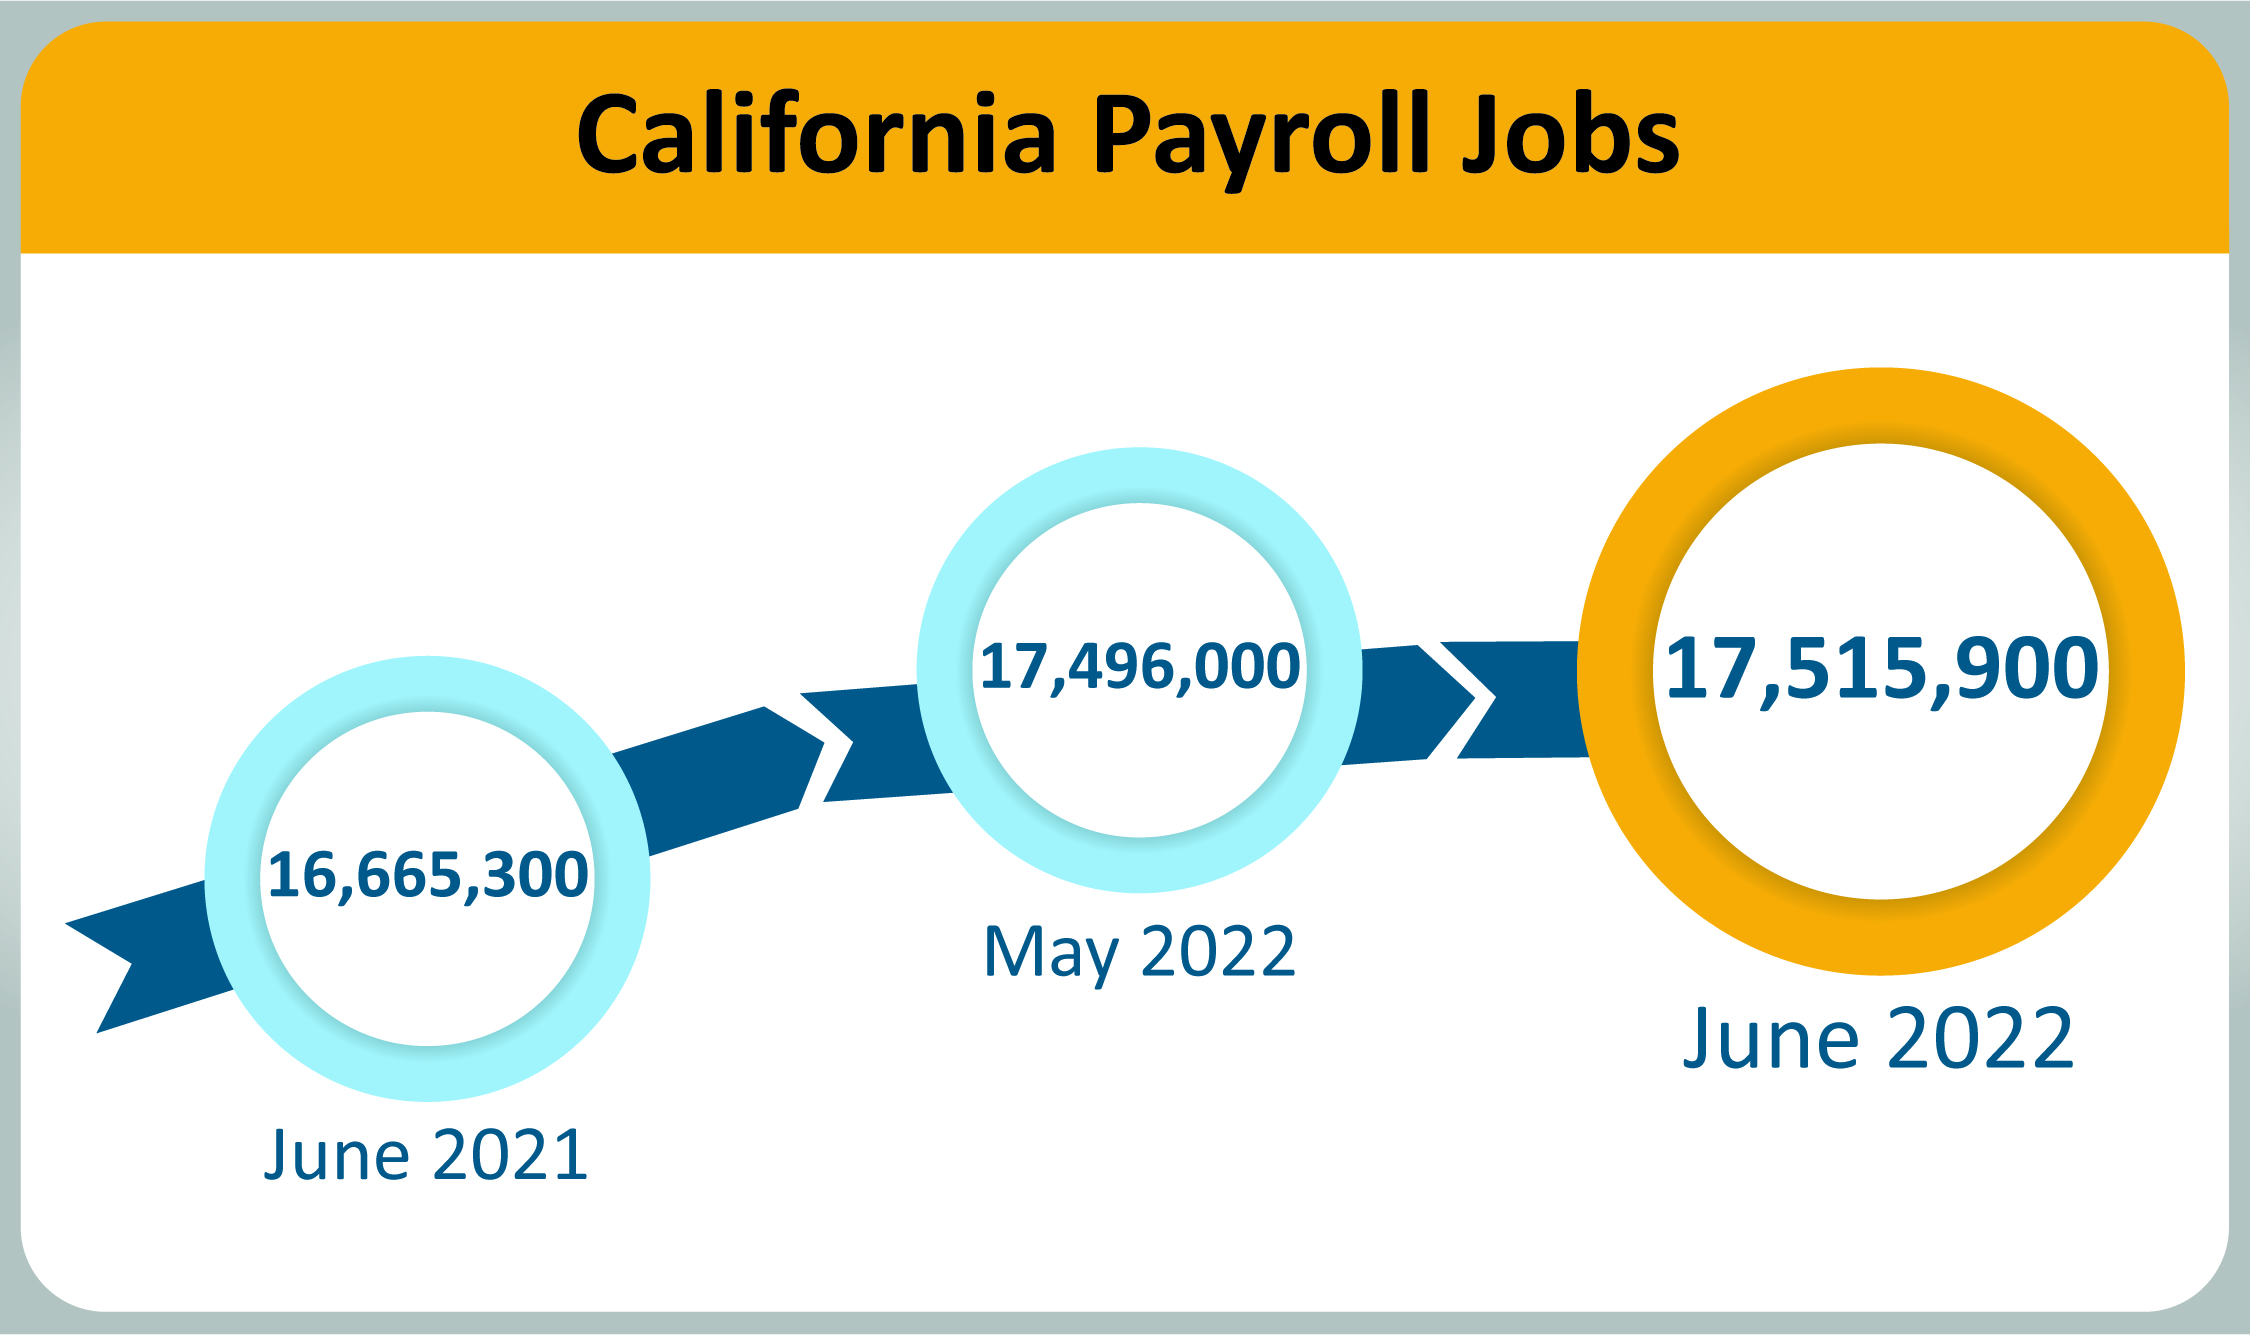
- Month-over – Total nonfarm jobs in California’s 11 major industries totaled 17,515,900 in June – a net gain of 19,900 jobs from May. This followed a downward revised (-2,100) month-over gain of 40,800 jobs in May.
- Year-over – Total nonfarm jobs increased by 850,600 (a 5.1 percent increase) from June 2021 to June 2022 compared to the U.S. annual gain of 6,282,000 jobs (a 4.3 percent increase).
| Major Industries |
Month-over Change (May 2022–June 2022) |
Year-over Change (June 2021–June 2022) |
Total Payroll Jobs as of June 2022 |
| Trade, Transp., Utilities |
+9,600 |
+129,700 |
3,155,300 |
| Education and Health Services |
+5,700 |
+104,500 |
2,906,000 |
| Government |
+5,600 |
+73,600 |
2,527,000 |
| Leisure and Hospitality |
+4,900 |
+232,900 |
1,885,700 |
| Information |
+4,200 |
+46,300 |
606,100 |
| Manufacturing |
+3,200 |
+39,300 |
1,311,000 |
| Financial Activities |
+1,000 |
+15,500 |
837,100 |
| Mining and Logging |
-200 |
No Change |
18,990 |
| Other Services |
-1,900 |
+43,500 |
545,900 |
| Professional and Business Services |
-6,100 |
+137,100 |
2,817,400 |
| Construction |
-6,100 |
+28,200 |
905,500 |
Total Farm jobs – The number of jobs in the agriculture industry decreased from May by 6,500 to total 413,700 jobs in June. The agricultural industry had 17,300 more farm jobs in June 2022 than it did in June a year ago.
Data Trends about Workers in the Economy
Employment and Unemployment in California
This information is based on a monthly federal survey of 5,100 California households which focuses on workers in the economy.
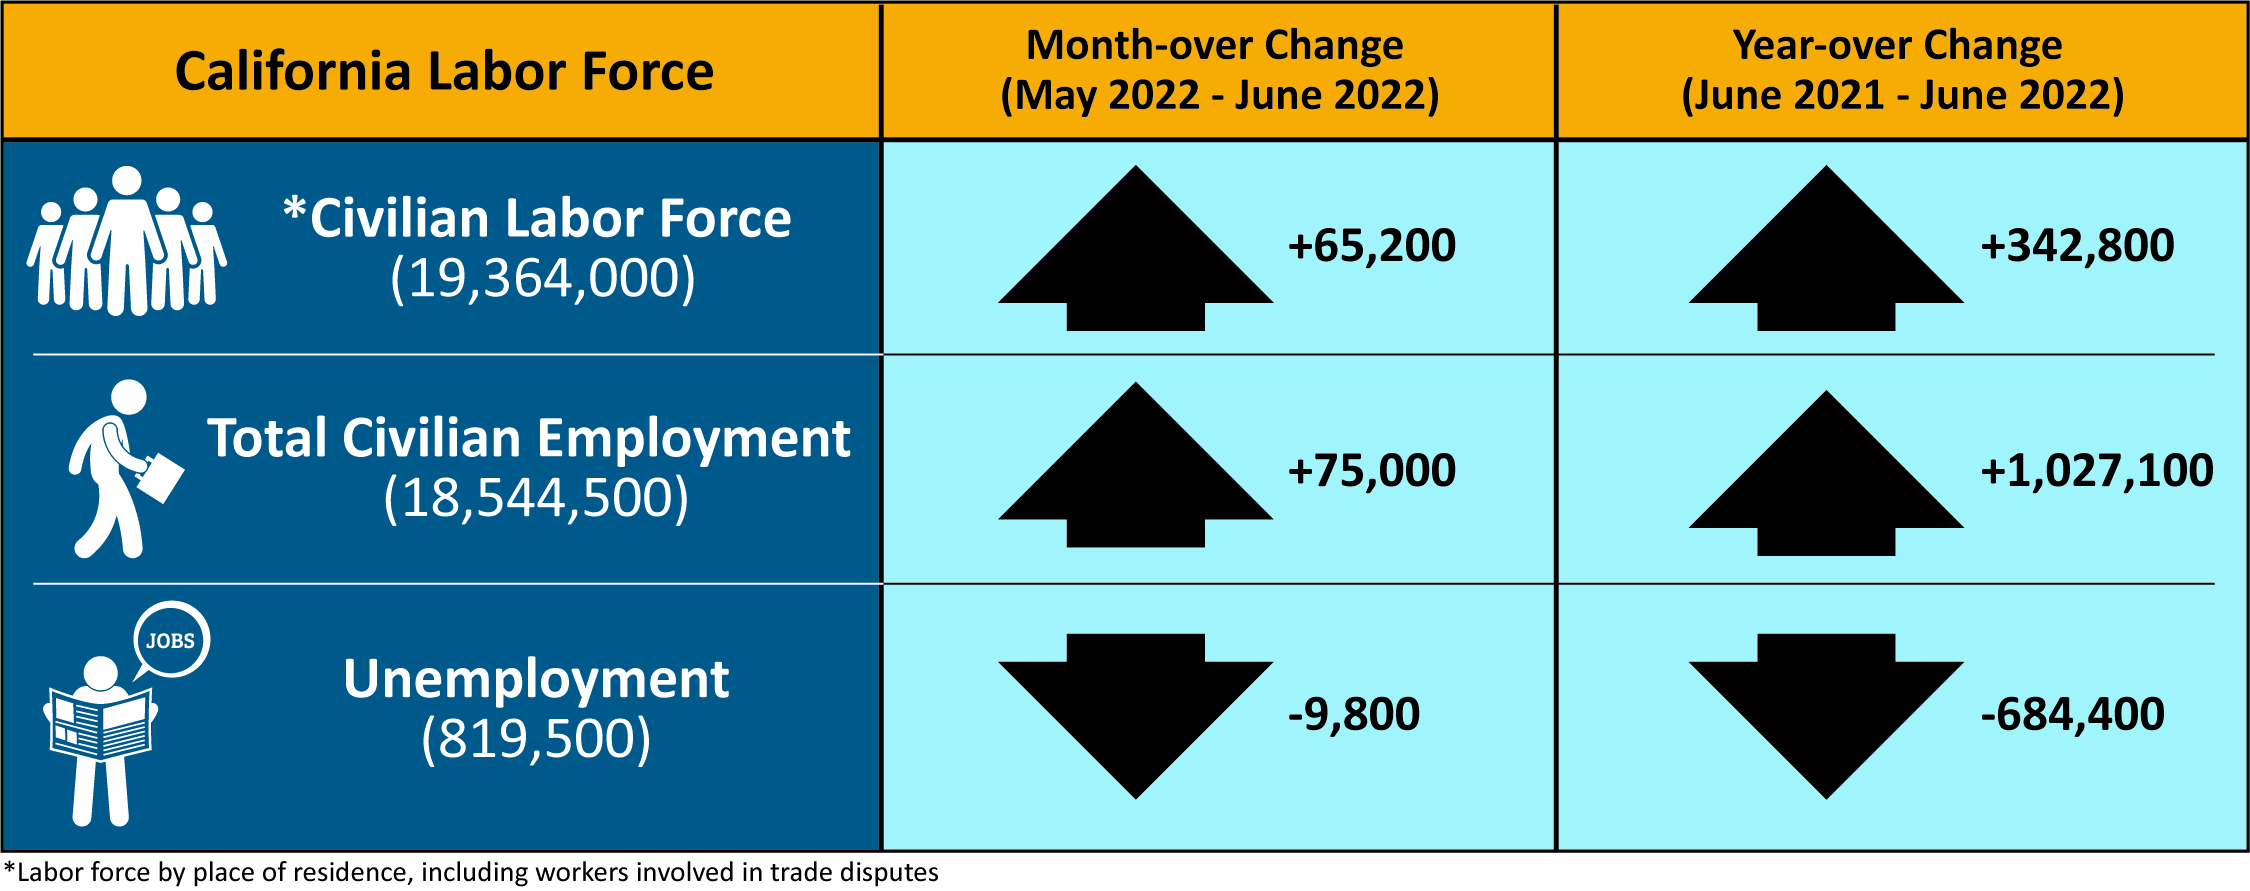
- Employed – The number of Californians employed in June was 18,544,500, an increase of 75,000 persons from May’s total of 18,469,500 and up 1,027,100 from the employment total in June 2021.
- Unemployed – The number of unemployed Californians was 819,500 in June, a decrease of 9,800 over the month and down 684,400 in comparison to June 2021.
| California Labor Force |
Month-over Change (May 2022–June 2022) |
Year-over Change (June 2021–June 2022) |
| * Civilian Labor Force (19,304,200) |
+65,200 |
+342,808 |
| Total Civilian Employment (18,469,200) |
+75,000 |
+1,027,100 |
| Unemployment (835,100) |
-9,800 |
-684,400 |
* Labor force by place of residence, including workers involved in trade disputes.
Unemployment Insurance Claims (Not Seasonally Adjusted)
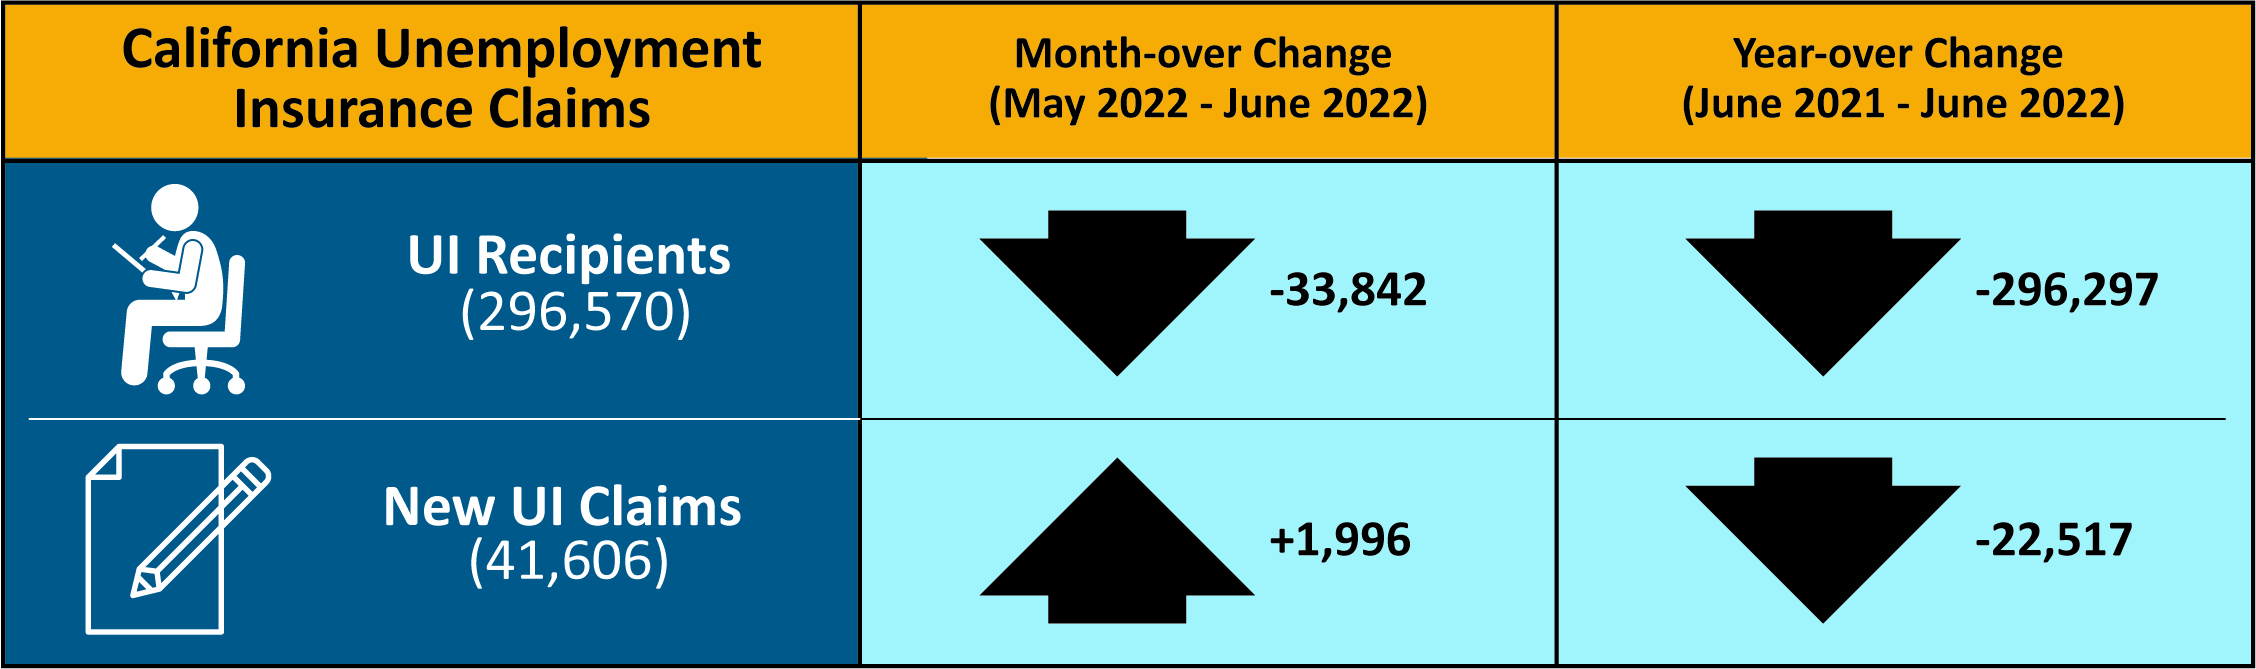
The following data is from a sample week that includes the 19th of each month: In related data that figures into the state’s unemployment rate, there were 296,570 people certifying for Unemployment Insurance benefits during the June 2022 sample week. That compares to 330,412 people in May and 592,867 people in June 2021. Concurrently, 41,606 initial claims were processed in the June 2022 sample week, which was a month-over increase of 1,996 claims from May, but a year-over decrease of 22,517 claims from June 2021.
| California Unemployment Insurance Claims |
Month-over Change (May 2022–June 2022) |
Year-over Change (June 2021–June 2022) |
| UI Recipients (296,570) |
-33,842 |
-296,297 |
| New UI Claims (41,606) |
+1,996 |
-22,517 |
MONTHLY LABOR FORCE DATA FOR COUNTIES
June 2022 (Preliminary); 2021 Benchmark
NOT SEASONALLY ADJUSTED
| COUNTY |
LABOR FORCE |
EMPLOYMENT |
UNEMPLOYMENT |
RATE |
| STATE TOTAL |
19,110,300 |
18,346,900 |
763,300 |
4.0% |
| ALAMEDA |
822,400 |
798,200 |
24,200 |
2.9% |
| ALPINE |
450 |
430 |
30 |
6.0% |
| AMADOR |
14,560 |
14,010 |
550 |
3.8% |
| BUTTE |
91,600 |
87,900 |
3,700 |
4.0% |
| CALAVERAS |
21,920 |
21,250 |
670 |
3.1% |
| COLUSA |
11,100 |
10,130 |
970 |
8.7% |
| CONTRA COSTA |
549,700 |
532,200 |
17,500 |
3.2% |
| DEL NORTE |
9,410 |
8,980 |
420 |
4.5% |
| EL DORADO |
92,000 |
89,400 |
2,600 |
2.9% |
| FRESNO |
451,800 |
425,500 |
26,200 |
5.8% |
| GLENN |
12,600 |
12,020 |
590 |
4.6% |
| HUMBOLDT |
59,500 |
57,500 |
2,000 |
3.4% |
| IMPERIAL |
68,900 |
59,900 |
9,000 |
13.0% |
| INYO |
8,290 |
8,040 |
250 |
3.0% |
| KERN |
383,200 |
357,300 |
25,900 |
6.8% |
| KINGS |
55,400 |
51,900 |
3,500 |
6.4% |
| LAKE |
28,570 |
27,330 |
1,240 |
4.4% |
| LASSEN |
9,010 |
8,720 |
300 |
3.3% |
| LOS ANGELES |
4,960,500 |
4,703,800 |
256,700 |
5.2% |
| MADERA |
62,500 |
59,000 |
3,500 |
5.6% |
| MARIN |
129,700 |
126,800 |
2,900 |
2.2% |
| MARIPOSA |
7,350 |
7,070 |
290 |
3.9% |
| MENDOCINO |
37,640 |
36,390 |
1,250 |
3.3% |
| MERCED |
115,100 |
107,100 |
8,000 |
7.0% |
| MODOC |
3,340 |
3,210 |
130 |
3.9% |
| MONO |
8,830 |
8,560 |
270 |
3.1% |
| MONTEREY |
221,100 |
211,300 |
9,800 |
4.5% |
| NAPA |
70,900 |
69,000 |
1,900 |
2.7% |
| NEVADA |
47,830 |
46,460 |
1,370 |
2.9% |
| ORANGE |
1,575,400 |
1,530,200 |
45,200 |
2.9% |
| PLACER |
190,900 |
186,000 |
4,900 |
2.6% |
| PLUMAS |
7,860 |
7,480 |
380 |
4.8% |
| RIVERSIDE |
1,146,300 |
1,101,000 |
45,300 |
4.0% |
| SACRAMENTO |
717,900 |
691,900 |
26,000 |
3.6% |
| SAN BENITO |
32,700 |
31,300 |
1,400 |
4.2% |
| SAN BERNARDINO |
1,001,900 |
962,200 |
39,700 |
4.0% |
| SAN DIEGO |
1,568,500 |
1,518,800 |
49,700 |
3.2% |
| SAN FRANCISCO |
566,200 |
553,800 |
12,400 |
2.2% |
| SAN JOAQUIN |
336,100 |
319,500 |
16,700 |
5.0% |
| SAN LUIS OBISPO |
138,000 |
134,500 |
3,600 |
2.6% |
| SAN MATEO |
448,300 |
439,100 |
9,200 |
2.0% |
| SANTA BARBARA |
224,400 |
218,000 |
6,300 |
2.8% |
| SANTA CLARA |
1,038,600 |
1,015,600 |
23,100 |
2.2% |
| SANTA CRUZ |
136,600 |
131,300 |
5,200 |
3.8% |
| SHASTA |
73,400 |
70,500 |
2,900 |
3.9% |
| SIERRA |
1,400 |
1,360 |
50 |
3.2% |
| SISKIYOU |
16,620 |
15,840 |
780 |
4.7% |
| SOLANO |
199,500 |
191,500 |
8,000 |
4.0% |
| SONOMA |
247,500 |
240,900 |
6,600 |
2.7% |
| STANISLAUS |
236,500 |
224,200 |
12,300 |
5.2% |
| SUTTER |
46,300 |
43,600 |
2,700 |
5.8% |
| TEHAMA |
25,410 |
24,330 |
1,080 |
4.3% |
| TRINITY |
4,590 |
4,430 |
160 |
3.5% |
| TULARE |
207,200 |
192,100 |
15,100 |
7.3% |
| TUOLUMNE |
20,070 |
19,280 |
790 |
3.9% |
| VENTURA |
407,600 |
394,600 |
12,900 |
3.2% |
| YOLO |
108,200 |
104,500 |
3,700 |
3.4% |
| YUBA |
31,200 |
29,600 |
1,600 |
5.0% |