NR No. 22-13
Contact: Loree Levy/Aubrey Henry
916-654-9029
mediainquiries@edd.ca.gov
IMPORTANT NOTE: Every year at this time the EDD releases benchmarked data which updates prior estimates. The employment data for the month of January 2022 is taken from the survey week including January 12. Data for the month of February is scheduled for release on March 25, 2022.
Employers added 53,600 nonfarm payroll jobs
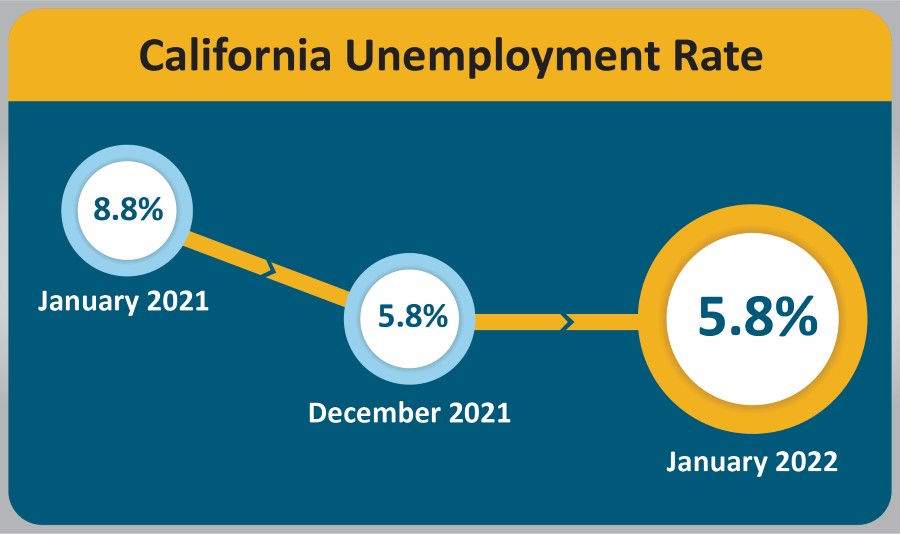
SACRAMENTO – California’s unemployment rate stayed steady from December 2021 into January 2022 at 5.8 percent1 as the state’s employers added 53,600 nonfarm payroll jobs2 to the economy, according to data released today by the California Employment Development Department (EDD) from two surveys. December’s unemployment rate was revised down 0.7 percentage points to 5.8 percent due to updated benchmarking figures that showed an increase of 248,200 jobs for that month.
California’s Labor Market, by the Numbers...
- Updated data shows that California outpaced the rest of the nation in year-over job gains (Jan. 2021 – Jan. 2022), with the state posting a 7.4 percent increase in jobs compared to the national job increase of 4.6 percent for the same time period.
- The benchmarked data shows the state’s job recovery so far is much stronger than first estimated, now regaining 2,261,100 (approx. 82 percent), of the 2,758,900 jobs lost in March and April 2020 due to the COVID-19 pandemic.
- Revised data also shows the peak unemployment rate during the pandemic was 16.1 percent in May 2020 instead of the previous estimate of 16 percent in April 2020.
- Eight of California’s 11 industry sectors gained jobs in January with Trade, Transportation, and Utilities (+26,600) posting the largest gain, primarily within the General Freight Trucking industry subsector.
- Both the Trade, Transportation, and Utilities, and Professional and Business Services industry sectors have regained all job losses incurred due to the COVID-19 pandemic.
- The biggest industry sector job losses were in Government (-800); more specifically in Local Government Education.
1. The nonfarm payroll job numbers come from a federal survey of 80,000 California businesses.
2. The unemployment rate comes from a separate federal survey of 5,100 California households.
Data Trends about Jobs in the Economy
Total Nonfarm Payroll Jobs
This comes from a monthly survey of approximately 80,000 California businesses that estimates jobs in the economy – seasonally adjusted.
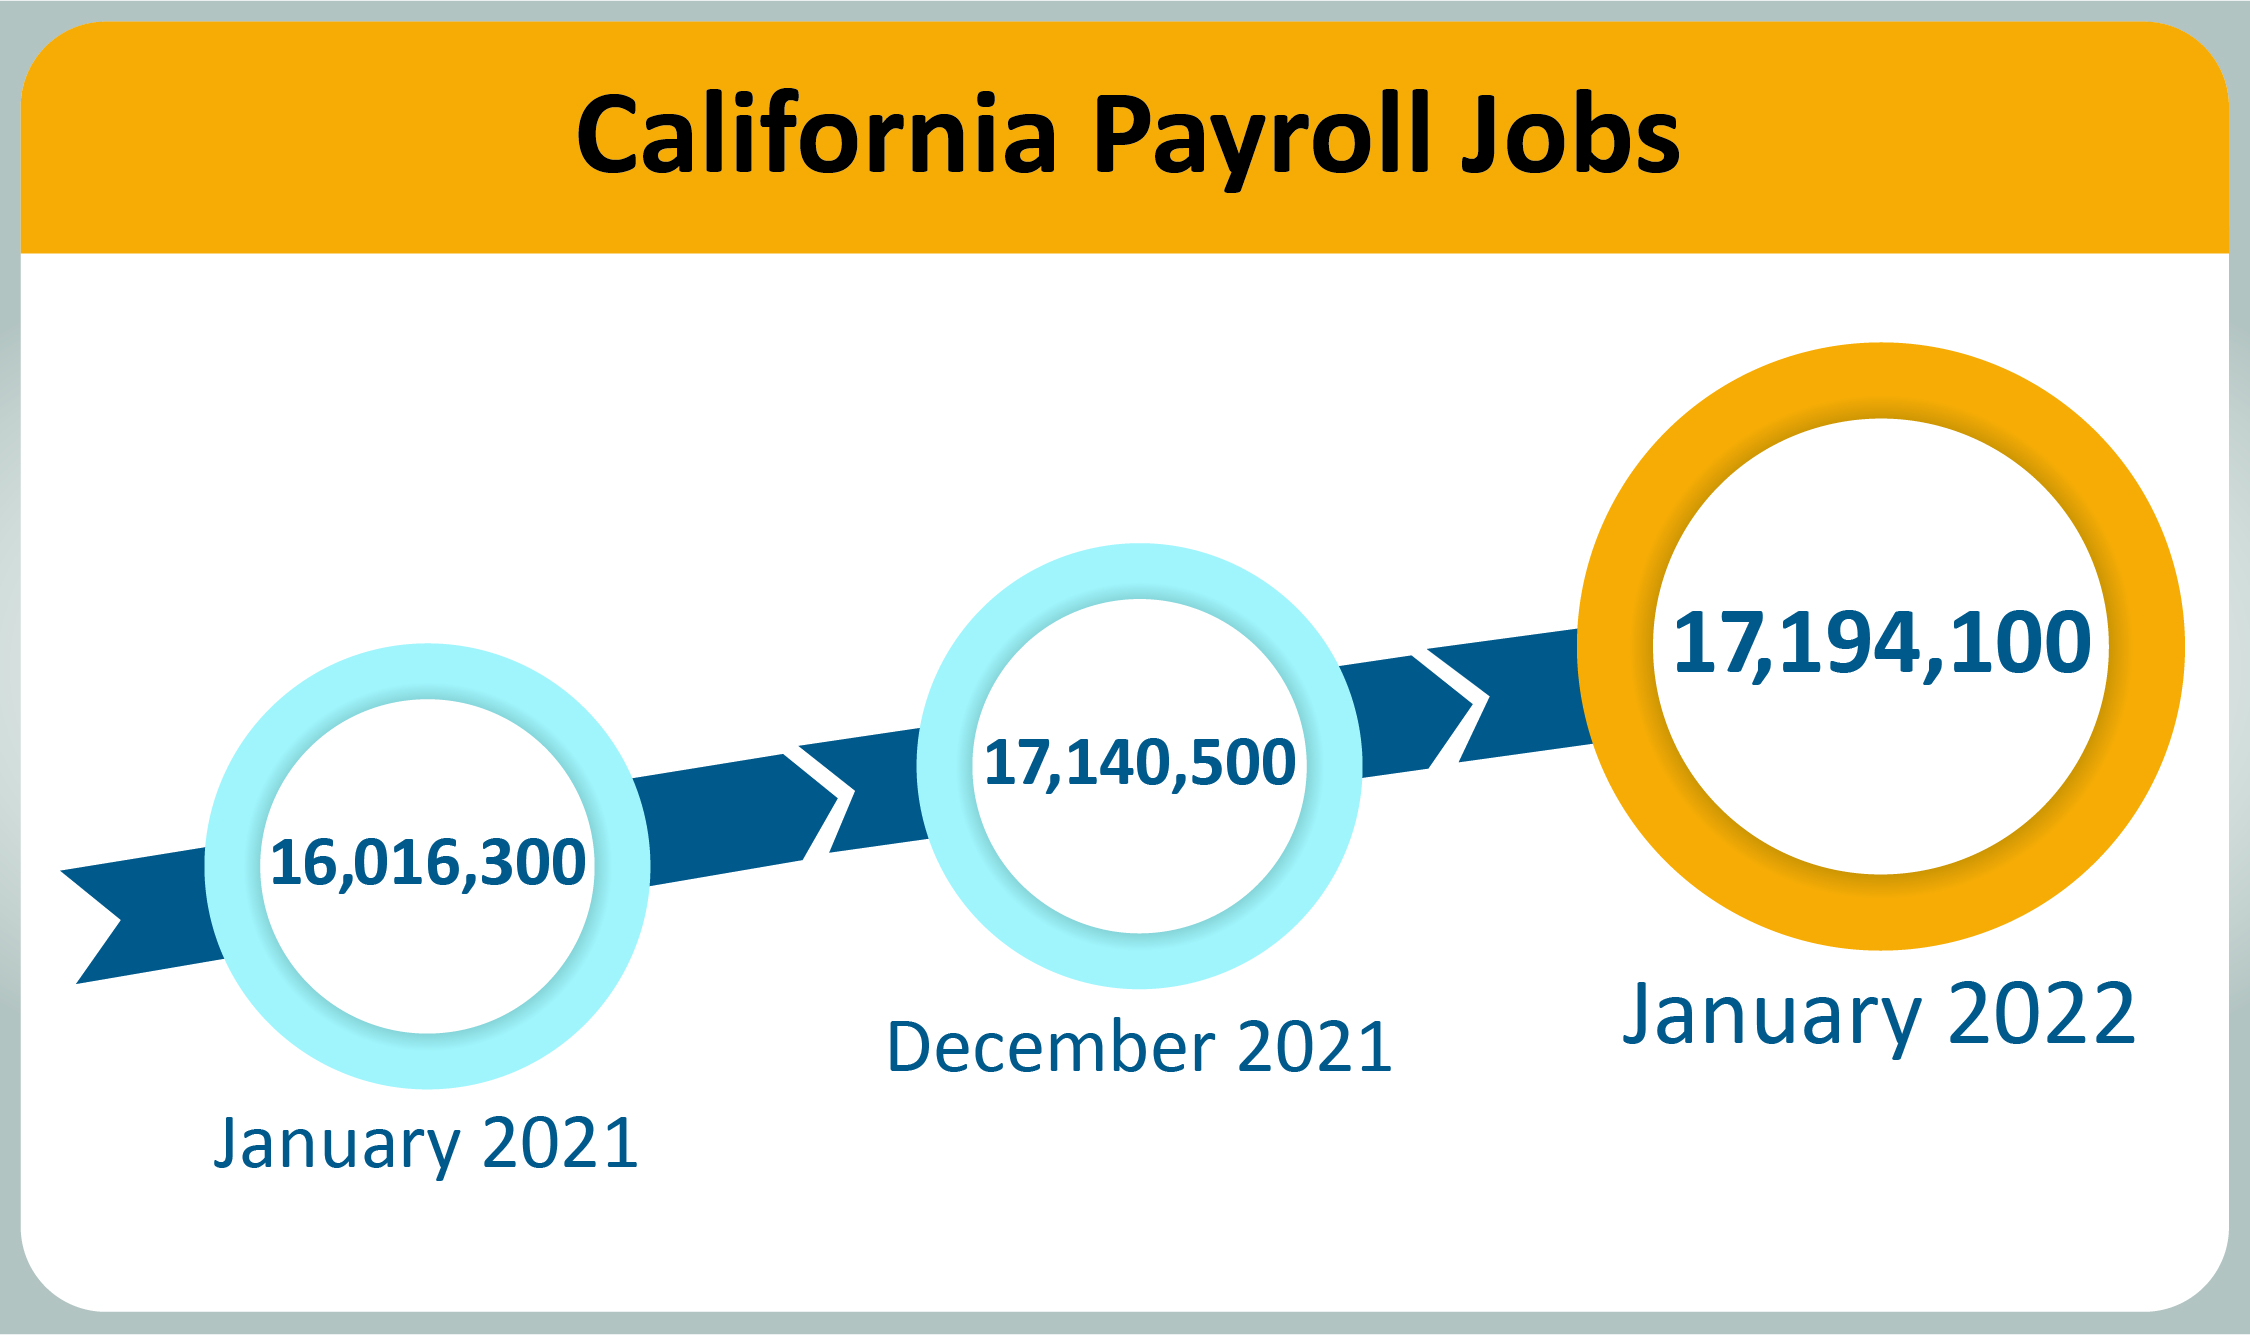
- Month-over – Total nonfarm jobs in California’s 11 major industries totaled 17,194,100 in January – a net gain of 53,600 jobs from December 2021. This followed an upward revised (+248,200) month-over gain of 62,900 jobs in December due to updated benchmarking figures.
- Year-over – Total nonfarm jobs increased by 1,177,800 (a 7.4 percent increase) from January 2021 to January 2022 compared to the U.S. annual gain of 6,612,000 jobs (a 4.6 percent increase).
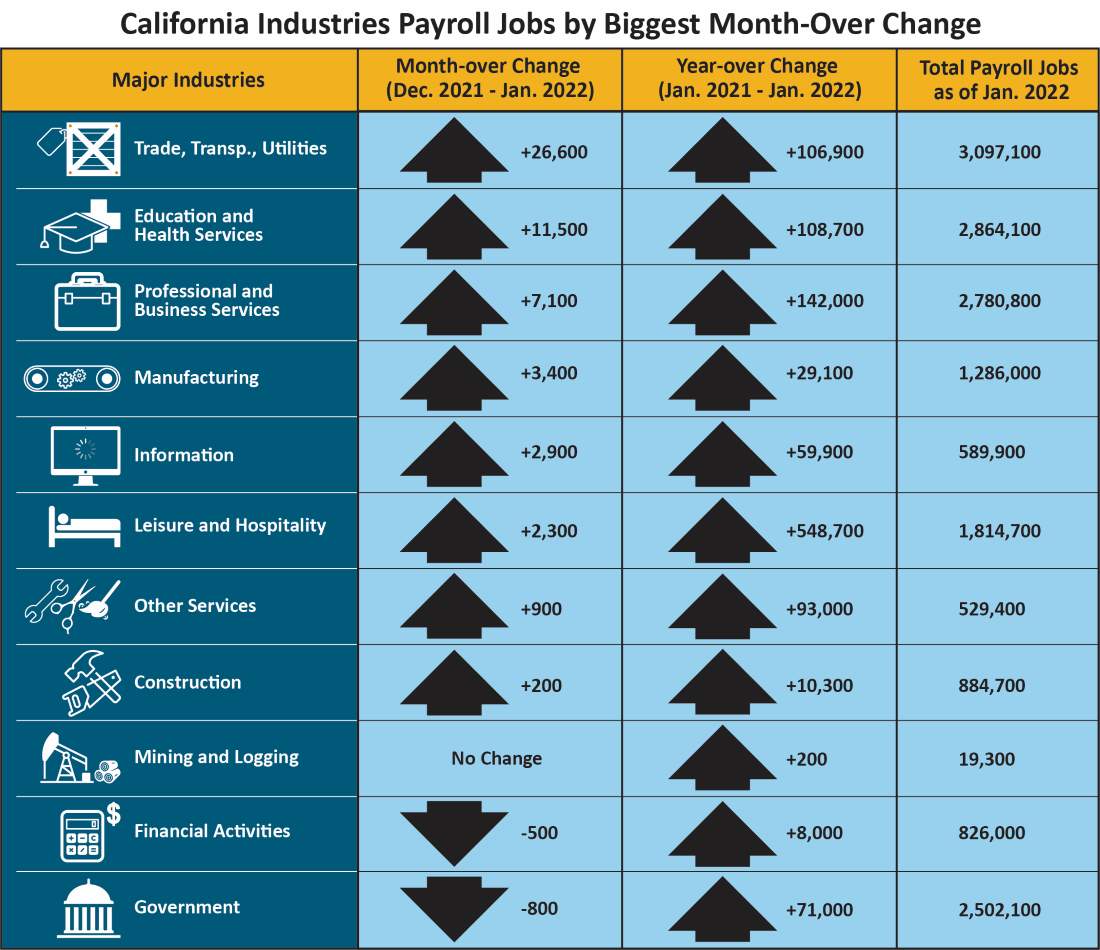
| Major Industries | Month-over Change (Dec. 2021–Jan. 2022) | Year-over Change (Jan. 2021–Jan. 2022) | Total Payroll Jobs as of Jan. 2022 |
|---|---|---|---|
| Trade, Transportation, Utilities | +26,600 | +106,900 | 3,097,100 |
| Education and Health Services | +11,500 | +108,700 | 2,864,100 |
| Professional and Business Services | +7,100 | +142,00 | 2,780,800 |
| Manufacturing | +3,400 | +29,100 | 1,286,000 |
| Information | +2,900 | +59,900 | 589,900 |
| Leisure and Hospitality | +2,300 | +548,700 | 1,814,700 |
| Other Services | +900 | +93,000 | 529,400 |
| Construction | +200 | +10,300 | 884,700 |
| Mining and Logging | No Change | +200 | 19,300 |
| Financial Activities | -500 | +8,000 | 826,000 |
| Government | -800 | +71,000 | 2,502,100 |
Total Farm jobs – The number of jobs in the agriculture industry decreased by 300 from December 2021 to 411,000 jobs in January. The agricultural industry has 2,600 fewer farm jobs in January 2022 than it did in January a year ago.
Data Trends about Workers in the Economy
Employment and Unemployment in California
This information is based on a monthly federal survey of 5,100 California households which focuses on workers in the economy.
- Employed – The number of Californians employed in January was 17,960,200, an increase of 109,200 persons from December’s total of 17,851,000, and up 939,700 from the employment total in January 2021.
- Unemployed – The number of unemployed Californians was 1,104,300 in January, an increase of 9,200 over the month, but down 533,100 in comparison to January 2021.
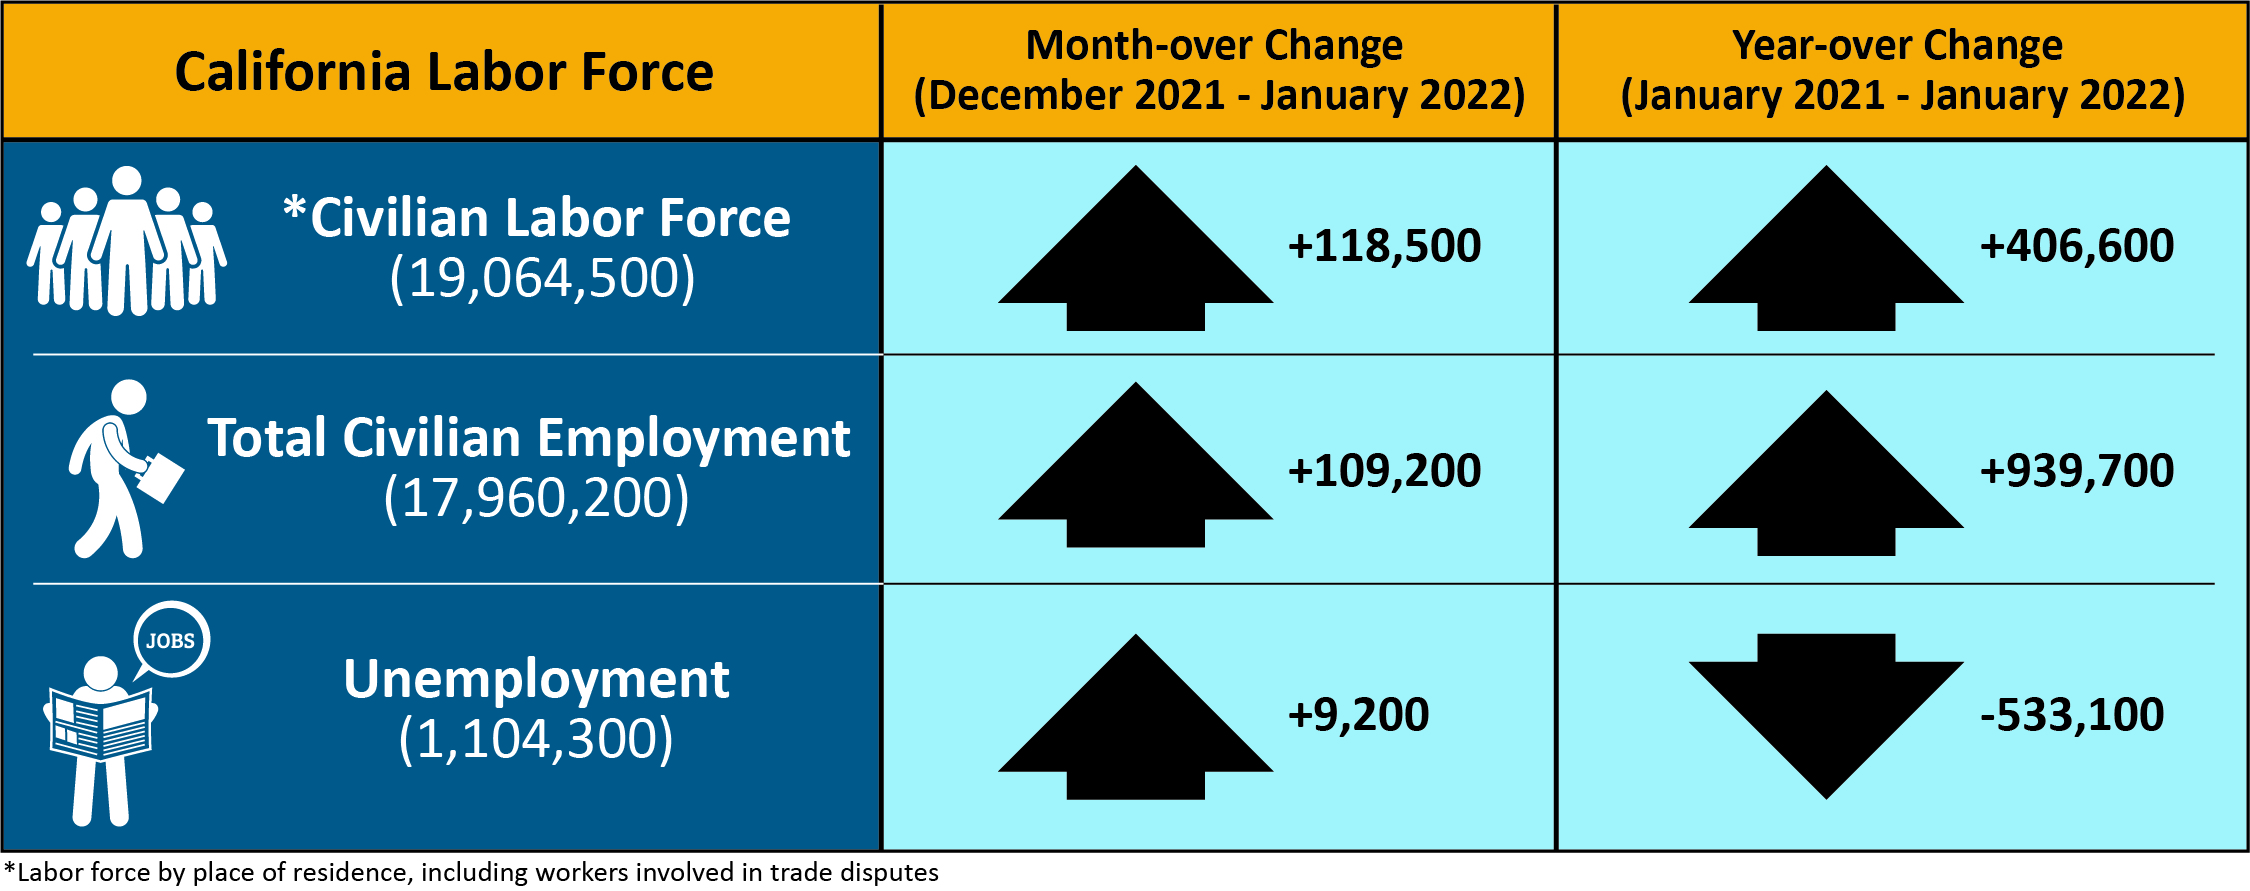
| California Labor Force | Month-over Change (December 2021–January 2022) | Year-over Change (January 2021–January 2022) |
|---|---|---|
| * Civilian Labor Force (19,064,500) | +118,500 | +406,600 |
| Total Civilian Employment (17,960,200) | +109,200 | +939,700 |
| Unemployment (1,104,300) | +9,200 | -533,100 |
* Labor force by place of residence, including workers involved in trade disputes.
Unemployment Insurance Claims (Not Seasonally Adjusted)
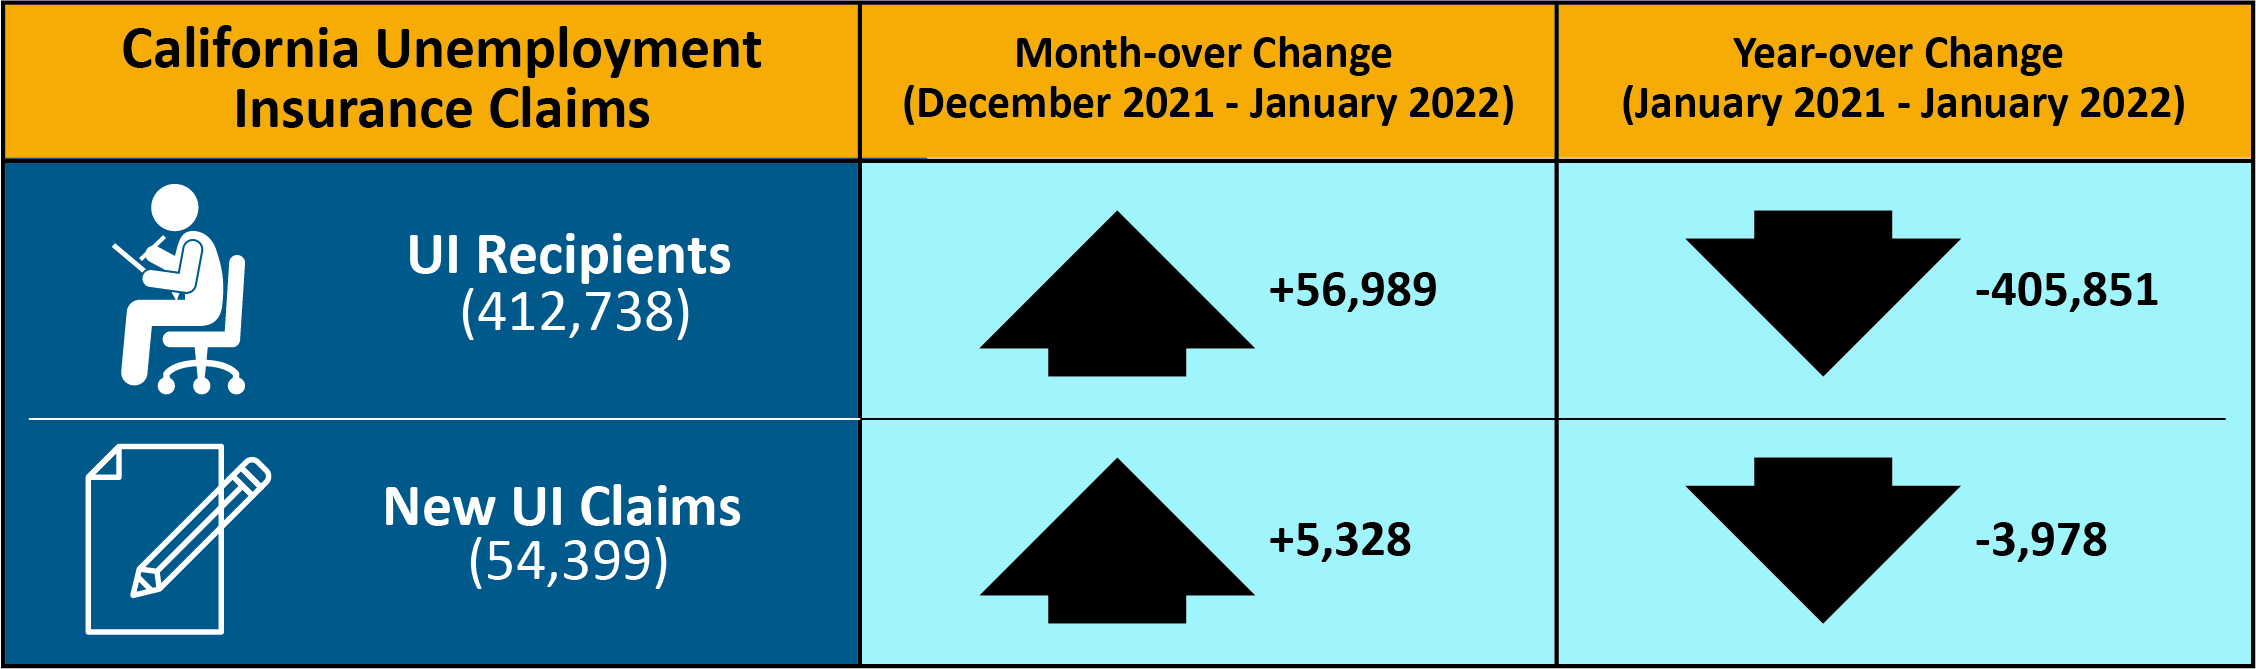
The following data is from a sample week that includes the 19th of each month: In related data that figures into the state’s unemployment rate, there were 412,738 people certifying for Unemployment Insurance benefits during the January 2022 sample week. That compares to 355,749 people in December and 818,589 people in January 2021. Concurrently, 54,399 initial claims were processed in the January 2022 sample week, which was a month-over increase of 5,328 claims from December, but a year-over decrease of 3,978 claims from January 2021.
| California Unemployment Insurance Claims | Month-over Change (December 2021–January 2022) | Year-over Change (January 2021–January 2022) |
|---|---|---|
| UI Recipients (412,738) | +56,989 | -405,851 |
| New UI Claims (54,399) | +5,328 | -3,978 |
| COUNTY | LABOR FORCE | EMPLOYMENT | UNEMPLOYMENT | RATE |
|---|---|---|---|---|
| STATE TOTAL | 19,150,000 | 18,104,900 | 1,045,100 | 5.5% |
| ALAMEDA | 820,400 | 784,700 | 35,700 | 4.3% |
| ALPINE | 580 | 540 | 40 | 6.4% |
| AMADOR | 14,280 | 13,440 | 840 | 5.9% |
| BUTTE | 92,000 | 86,800 | 5,200 | 5.7% |
| CALAVERAS | 21,360 | 20,360 | 1,010 | 4.7% |
| COLUSA | 10,580 | 9,010 | 1,570 | 14.8% |
| CONTRA COSTA | 549,000 | 523,300 | 25,700 | 4.7% |
| DEL NORTE | 9,240 | 8,670 | 570 | 6.1% |
| EL DORADO | 92,100 | 88,000 | 4,100 | 4.4% |
| FRESNO | 448,900 | 412,700 | 36,200 | 8.1% |
| GLENN | 12,450 | 11,640 | 810 | 6.5% |
| HUMBOLDT | 58,700 | 55,900 | 2,800 | 4.8% |
| IMPERIAL | 71,000 | 59,900 | 11,100 | 15.6% |
| INYO | 8,180 | 7,790 | 390 | 4.8% |
| KERN | 386,000 | 352,200 | 33,800 | 8.8% |
| KINGS | 56,800 | 51,700 | 5,100 | 8.9% |
| LAKE | 28,100 | 26,210 | 1,890 | 6.7% |
| LASSEN | 8,860 | 8,380 | 480 | 5.4% |
| LOS ANGELES | 5,040,000 | 4,732,000 | 308,000 | 6.1% |
| MADERA | 63,500 | 58,600 | 4,900 | 7.7% |
| MARIN | 130,000 | 125,900 | 4,100 | 3.1% |
| MARIPOSA | 6,260 | 5,790 | 470 | 7.5% |
| MENDOCINO | 36,940 | 35,050 | 1,890 | 5.1% |
| MERCED | 115,800 | 104,700 | 11,200 | 9.7% |
| MODOC | 3,110 | 2,880 | 230 | 7.4% |
| MONO | 9,540 | 9,100 | 440 | 4.6% |
| MONTEREY | 202,200 | 184,000 | 18,200 | 9.0% |
| NAPA | 68,000 | 64,900 | 3,100 | 4.5% |
| NEVADA | 47,600 | 45,520 | 2,080 | 4.4% |
| ORANGE | 1,572,100 | 1,505,900 | 66,200 | 4.2% |
| PLACER | 190,100 | 183,100 | 7,000 | 3.7% |
| PLUMAS | 6,700 | 5,990 | 710 | 10.6% |
| RIVERSIDE | 1,152,800 | 1,087,900 | 64,800 | 5.6% |
| SACRAMENTO | 719,500 | 680,600 | 38,900 | 5.4% |
| SAN BENITO | 32,400 | 30,300 | 2,100 | 6.5% |
| SAN BERNARDINO | 1,008,800 | 951,000 | 57,800 | 5.7% |
| SAN DIEGO | 1,572,900 | 1,499,600 | 73,300 | 4.7% |
| SAN FRANCISCO | 564,200 | 544,800 | 19,400 | 3.4% |
| SAN JOAQUIN | 335,500 | 311,200 | 24,300 | 7.3% |
| SAN LUIS OBISPO | 135,600 | 130,500 | 5,100 | 3.8% |
| SAN MATEO | 445,900 | 432,100 | 13,800 | 3.1% |
| SANTA BARBARA | 215,600 | 205,400 | 10,200 | 4.7% |
| SANTA CLARA | 1,034,100 | 1,000,400 | 33,700 | 3.3% |
| SANTA CRUZ | 132,400 | 124,200 | 8,200 | 6.2% |
| SHASTA | 73,500 | 69,100 | 4,300 | 5.9% |
| SIERRA | 1,280 | 1,210 | 70 | 5.4% |
| SISKIYOU | 16,010 | 14,730 | 1,280 | 8.0% |
| SOLANO | 200,100 | 188,100 | 12,000 | 6.0% |
| SONOMA | 245,200 | 235,400 | 9,800 | 4.0% |
| STANISLAUS | 239,100 | 222,100 | 17,000 | 7.1% |
| SUTTER | 45,000 | 41,200 | 3,800 | 8.5% |
| TEHAMA | 25,160 | 23,610 | 1,550 | 6.2% |
| TRINITY | 4,230 | 3,980 | 250 | 6.0% |
| TULARE | 204,600 | 185,100 | 19,500 | 9.5% |
| TUOLUMNE | 19,690 | 18,490 | 1,200 | 6.1% |
| VENTURA | 408,000 | 388,600 | 19,300 | 4.7% |
| YOLO | 107,000 | 101,800 | 5,300 | 4.9% |
| YUBA | 31,100 | 28,900 | 2,200 | 7.2% |