Unemployment Benefits Data
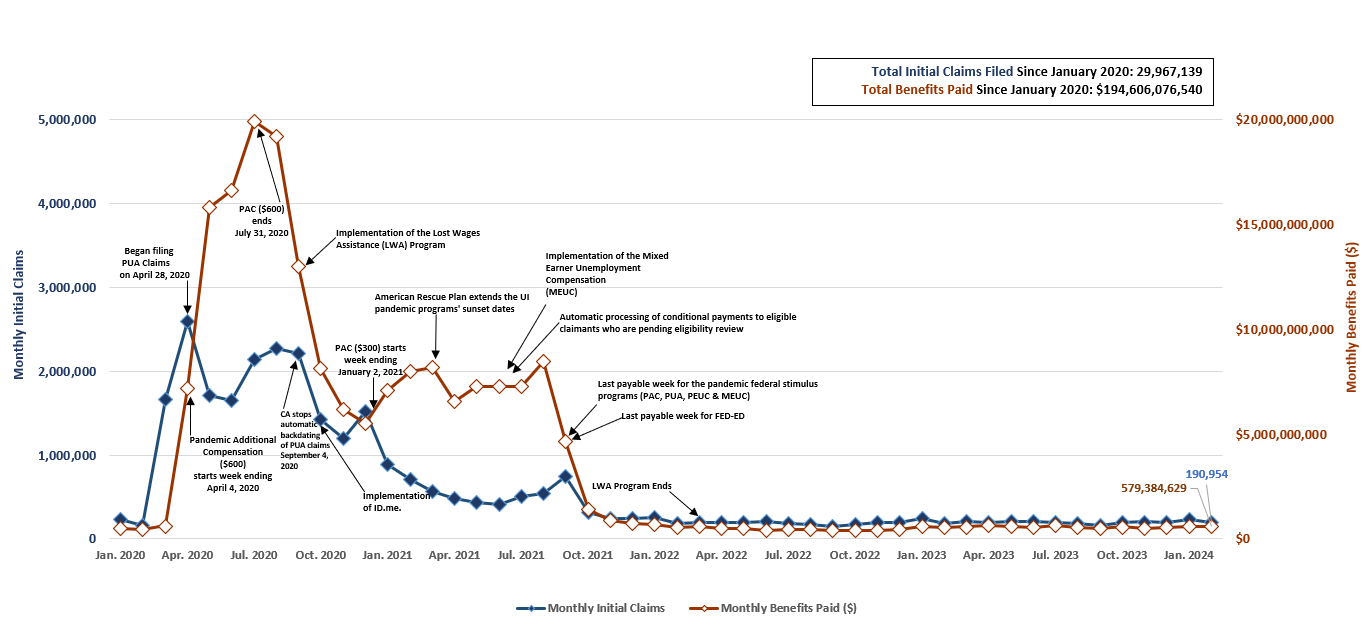
We are committed to delivering unemployment benefits to eligible Californians as quickly as possible and then transparently reporting this information to the public. This data dashboard generally shows information about the historic volume of unemployment claims and benefits paid since the start of the COVID-19 pandemic began in March 2020. It is updated weekly and offers these different data elements:
- Total Unemployment Claims – including claims paid, claims ineligible for benefits, and claims past 21 days pending EDD action.
- Claims Filed and Benefits Paid by Month – including data since January 2020 in California.
- County and State Breakout Data – including localized claim, industry, and demographic data.
- Phone Calls – including call attempts, unique callers, and calls answered.
Summary Stats
New and Reopened Claims Filed Since March 2020
Total Benefits Paid Since March 2020
Claims Paid Within One Week of First Certification Received
Claims Past 21 Days Pending EDD Action
Total Unemployment Claims
This dashboard features total claims filed and what happens to those claims. Depending on information provided by the claimant - claims can be paid, ineligible for benefits, pending EDD action that is taking more than three weeks to resolve, or waiting for the claimant to take the next step and certify their eligibility for payment.
If you are having trouble viewing the Tableau dashboard, download our unemployment insurance claims data (XLSX).
Claims Filed and Benefits Paid by Month

If you are having trouble viewing the chart, download our monthly data chart (XLSX).
County and State Breakout Data
This dashboard shows claims data broken out by county, as well as industry and various demographics at the county and state level.
If you are having trouble viewing the Tableau dashboard, download our latest statewide and county stats (XLSX).
Phone Calls
This chart shows total calls, unique callers, and calls answered by staff.
If you are having trouble viewing the Tableau dashboard, download our call center data stats (XLSX).
