NR No. 25-17
Contact: Loree Levy/Greg Lawson
916-654-9029
mediainquiries@edd.ca.gov
Important Note: The employment data for the month of March 2025 comes from the survey week that included March 12. Data for April is scheduled for release on May 16, 2025.
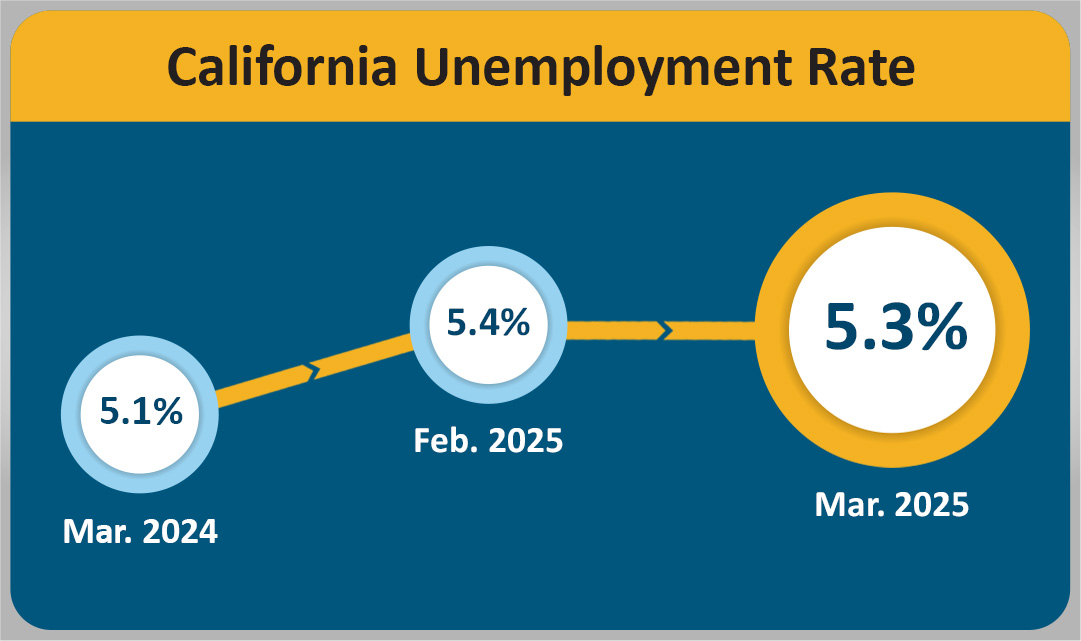
SACRAMENTO — California’s unemployment rate dropped to 5.3 percent1 despite California’s nonfarm payroll jobs2 decreasing by 11,600 jobs in March 2025, according to the latest Employment Development Department (EDD) data coming from two separate surveys. March’s job reduction follows a downward revised job loss of 21,800 for February 2025.
California's Labor Market, by the Numbers...
-
California’s unemployment rate decreased 0.1 percent, compared to a 0.1 percent month-over increase at the national level–the second U.S. increase in a row.
-
March 2025 marks the fifth consecutive month that unemployment decreased in California (-7,000), with the total number of unemployed persons dropping by 24,300 persons over that timeframe.
-
Although California lost 11,600 nonfarm jobs in March, it increased year-over by 46,500 jobs between March 2024 and March 2025. Since April 2020, California gained 3,057,800 jobs, averaging 51,827 jobs per month.
-
Three of California's 11 industry sectors gained jobs in March with Private Education and Health Services (+12,600) posting a gain for the 38th straight month, due to above-average gains in Nursing Care Facilities, Individual and Family Services, and Child Day Care Services.
-
Government (+4,800) also posted a month-over job gain with the largest increase coming from Local Government (+4,300). Both Federal (+200) and State (+300) Government posted small job gains as well.
-
Trade, Transportation and Utilities (-10,200) posted the State’s largest month-over loss with the majority of the losses coming from Transportation, Warehousing, and Utilities (-8,600), which continues to experience normal seasonal losses, particularly in Couriers and Messengers after the holiday season.
1. The unemployment rate comes from a separate federal survey of 4,400 California households.
2. The nonfarm payroll job numbers come from a federal survey of 80,000 California businesses.
Data Trends about Jobs in the Economy
Total Nonfarm Payroll Jobs (Comes from a monthly survey of approximately 80,000 California businesses that estimates jobs in the economy – seasonally adjusted)
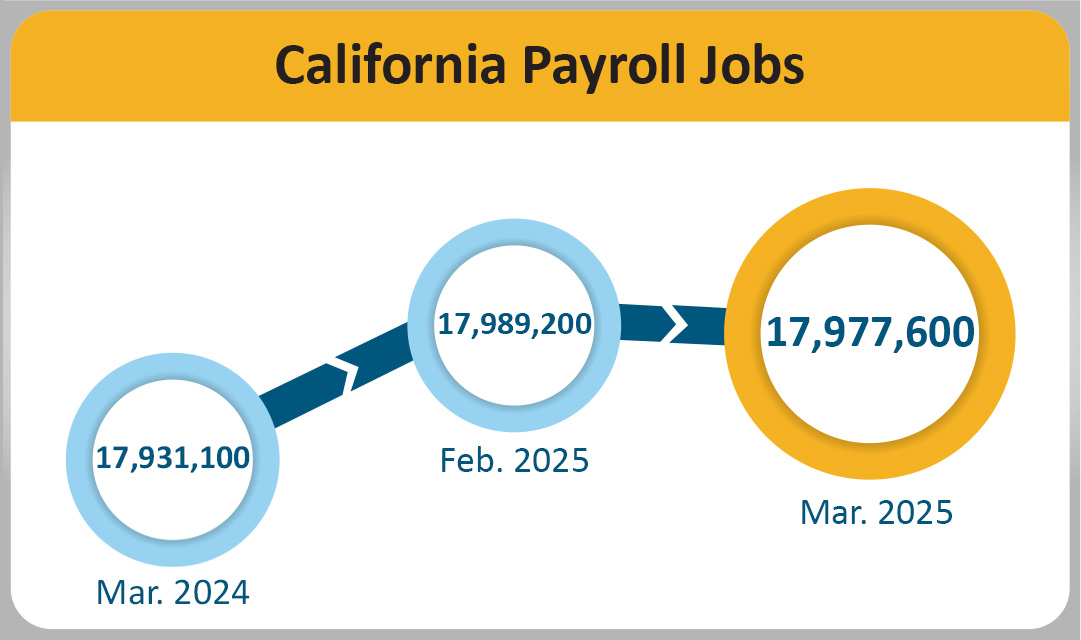
- Month-over – Total nonfarm jobs in California’s 11 major industries amounted to 17,977,600 in March – a loss of 11,600 from February. This followed February’s downward revision of 14,300 jobs, resulting in a month-over February loss of 21,800 jobs.
- Year-over – Total nonfarm jobs increased by 46,500 (a 0.3 percent increase) from March 2024 to March 2025 compared to the U.S. annual gain of 1,881,000 jobs (a 1.2 percent increase).
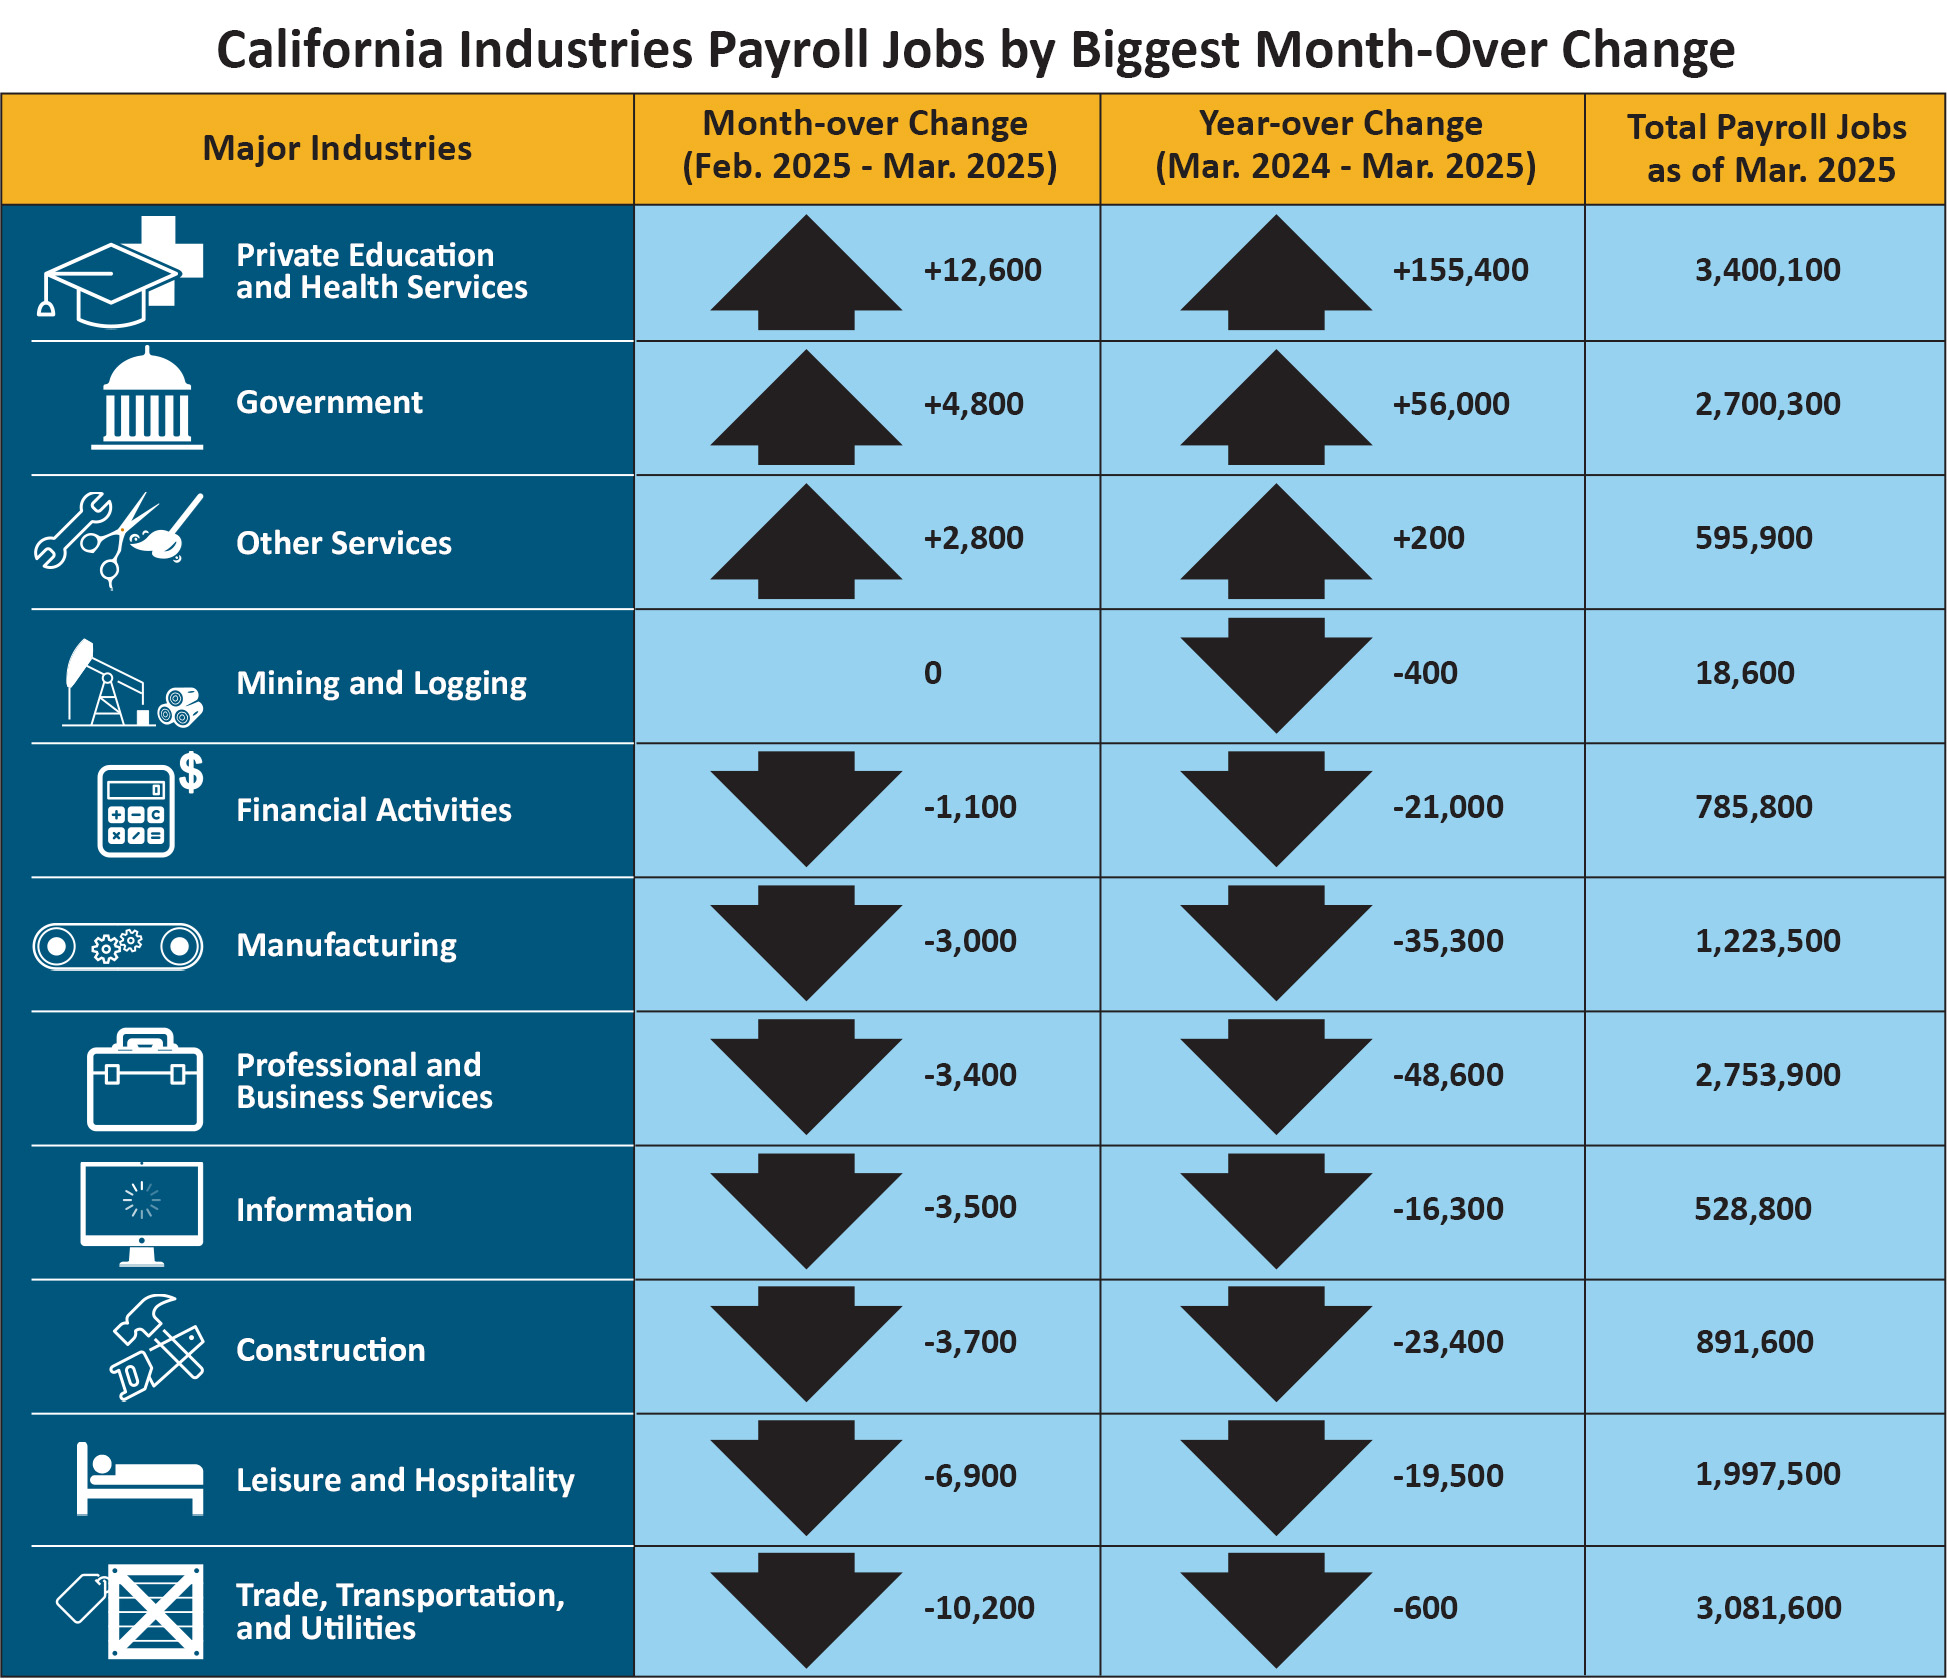
| Major Industries | Month-over Change (Feb. 2025–Mar. 2025) | Year-over Change (Mar. 2024–Mar. 2025) | Total Payroll Jobs as of Mar. 2025 |
|---|---|---|---|
| Private Education and Health Services | +12,600 | +155,400 | 3,400,100 |
| Government | +4,800 | +56,000 | 2,700,300 |
| Other Services | +2,800 | +200 | 595,900 |
| Mining and Logging | 0 | -400 | 18,600 |
| Financial Activities | -1,100 | -21,000 | 785,800 |
| Manufacturing | -3,000 | -35,300 | 1,223,500 |
| Professional and Business Services | -3,400 | -48,600 | 2,753,900 |
| Information | -3,500 | -16,300 | 528,800 |
| Construction | -3,700 | -23,400 | 891,600 |
| Leisure and Hospitality | -6,900 | -19,500 | 1,997,500 |
| Trade, Transportation, and Utilities | -10,200 | -600 | 3,081,600 |
Total Farm Jobs – The number of jobs in the agriculture industry increased from February by 1,800 to a total of 425,000 jobs in March. The agriculture industry had 10,600 more farm jobs in March 2025 than it did in March of last year.
Data Trends about Workers in the Economy
Employment and Unemployment in California (Based on a monthly federal survey of 4,400 California households which focuses on workers in the economy)
- Employed – The number of Californians employed in March was 18,659,600, an increase of 14,600 persons from February’s total of 18,645,000 and up 92,100 from the employment total in March 2024.
- Unemployed – The number of unemployed Californians was 1,054,200 in March, a decrease of 7,000 over the month, but up 50,100 in comparison to March 2024.
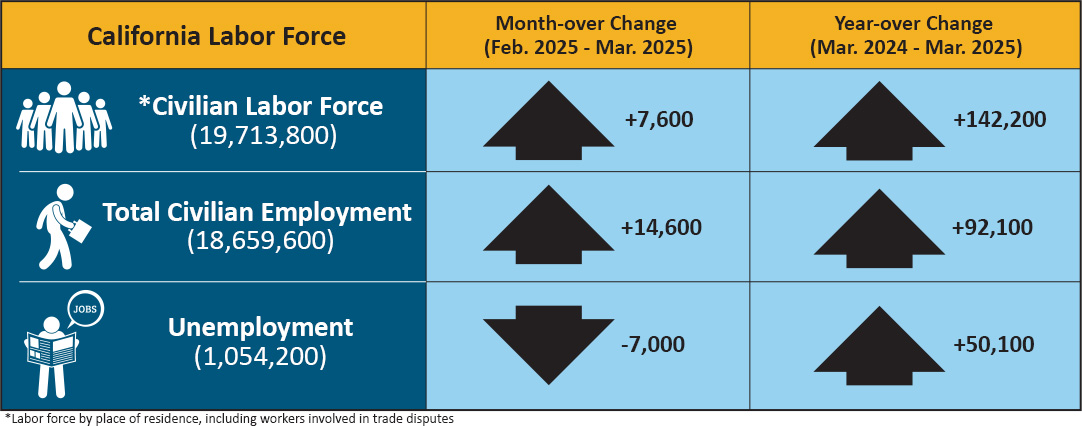
| California Labor Force | Month-over Change (Feb. 2025–Mar. 2025) | Year-over Change (Mar. 2024–Mar. 2025) |
|---|---|---|
| * Civilian Labor Force (19,713,800) | +7,600 | +142,200 |
| Total Civilian Employment (18,659,600) | +14,600 | +92,100 |
| Unemployment (1,054,200) | -7,000 | +50,100 |
* Labor force by place of residence, including workers involved in trade disputes.
Unemployment Insurance Claims (Not Seasonally Adjusted)
The following data is from a sample week that includes the 19th of each month:
In related data that figures into the State’s unemployment rate, there were 424,213 people certifying for Unemployment Insurance (UI) benefits during the March 2025 sample week. That compares to 407,881 people in February and 446,130 people in March 2024. Concurrently, 40,993 initial claims were processed in the March 2025 sample week, which was a month-over decrease of 1,662 claims from February and a year-over decrease of seven claims from March 2024.
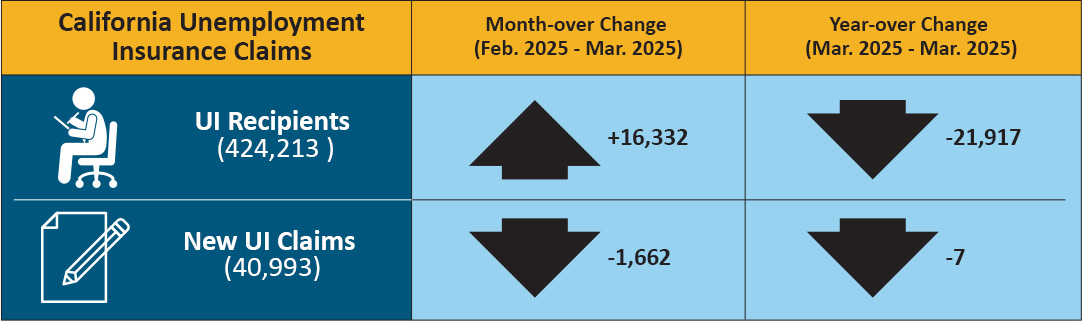
| California Unemployment Insurance Claims | Month-over Change (Feb. 2025–Mar. 2025) | Year-over Change (Mar. 2024–Mar. 2025) |
|---|---|---|
| UI Recipients (424,213) | +16,332 | -21,917 |
| New UI Claims (40,993) | -1,662 | -7 |
| COUNTY | LABOR FORCE | EMPLOYMENT | UNEMPLOYMENT | RATE |
|---|---|---|---|---|
| STATE TOTAL |
19,841,400 |
18,788,700 |
1,052,700 |
5.3% |
| ALAMEDA |
875,800 |
838,200 |
37,600 |
4.3% |
| ALPINE |
550 |
520 |
30 |
6.2% |
| AMADOR |
15,380 |
14,470 |
910 |
5.9% |
| BUTTE |
94,500 |
88,800 |
5,700 |
6.1% |
| CALAVERAS |
18,030 |
16,890 |
1,130 |
6.3% |
| COLUSA |
11,840 |
9,780 |
2,070 |
17.4% |
| CONTRA COSTA |
589,200 |
563,100 |
26,000 |
4.4% |
| DEL NORTE |
9,140 |
8,590 |
560 |
6.1% |
| EL DORADO |
92,500 |
88,000 |
4,500 |
4.9% |
| FRESNO |
483,600 |
440,200 |
43,400 |
9.0% |
| GLENN |
12,350 |
11,450 |
900 |
7.3% |
| HUMBOLDT |
61,800 |
58,600 |
3,200 |
5.1% |
| IMPERIAL |
73,000 |
61,000 |
12,000 |
16.4% |
| INYO |
8,500 |
8,120 |
370 |
4.4% |
| KERN |
412,000 |
373,000 |
39,000 |
9.5% |
| KINGS |
59,600 |
53,700 |
6,000 |
10.0% |
| LAKE |
26,860 |
24,920 |
1,940 |
7.2% |
| LASSEN |
8,260 |
7,690 |
570 |
6.9% |
| LOS ANGELES |
5,047,900 |
4,767,600 |
280,300 |
5.6% |
| MADERA |
70,800 |
64,700 |
6,000 |
8.5% |
| MARIN |
127,200 |
122,400 |
4,800 |
3.8% |
| MARIPOSA |
7,020 |
6,550 |
480 |
6.8% |
| MENDOCINO |
37,430 |
35,200 |
2,230 |
6.0% |
| MERCED |
124,900 |
110,800 |
14,100 |
11.3% |
| MODOC |
3,180 |
2,910 |
280 |
8.6% |
| MONO |
8,610 |
8,260 |
350 |
4.0% |
| MONTEREY |
223,300 |
201,100 |
22,200 |
9.9% |
| NAPA |
77,000 |
73,800 |
3,200 |
4.1% |
| NEVADA |
48,510 |
46,220 |
2,290 |
4.7% |
| ORANGE |
1,652,100 |
1,589,400 |
62,700 |
3.8% |
| PLACER |
209,300 |
200,800 |
8,500 |
4.1% |
| PLUMAS |
7,570 |
6,820 |
750 |
9.9% |
| RIVERSIDE |
1,201,500 |
1,140,600 |
60,900 |
5.1% |
| SACRAMENTO |
792,100 |
754,800 |
37,300 |
4.7% |
| SAN BENITO |
35,100 |
32,500 |
2,600 |
7.3% |
| SAN BERNARDINO |
1,046,100 |
994,200 |
52,000 |
5.0% |
| SAN DIEGO |
1,685,700 |
1,614,900 |
70,700 |
4.2% |
| SAN FRANCISCO |
515,900 |
496,500 |
19,300 |
3.7% |
| SAN JOAQUIN |
375,000 |
349,600 |
25,300 |
6.8% |
| SAN LUIS OBISPO |
135,400 |
129,900 |
5,500 |
4.1% |
| SAN MATEO |
422,100 |
407,100 |
15,000 |
3.5% |
| SANTA BARBARA |
223,900 |
213,000 |
10,900 |
4.9% |
| SANTA CLARA |
1,035,200 |
994,100 |
41,100 |
4.0% |
| SANTA CRUZ |
138,400 |
128,600 |
9,700 |
7.0% |
| SHASTA |
81,900 |
77,200 |
4,700 |
5.8% |
| SIERRA |
1,330 |
1,240 |
90 |
6.5% |
| SISKIYOU |
16,600 |
15,230 |
1,370 |
8.2% |
| SOLANO |
219,400 |
208,300 |
11,100 |
5.1% |
| SONOMA |
250,400 |
239,800 |
10,500 |
4.2% |
| STANISLAUS |
261,900 |
243,000 |
18,900 |
7.2% |
| SUTTER |
46,900 |
42,300 |
4,500 |
9.6% |
| TEHAMA |
27,580 |
25,740 |
1,850 |
6.7% |
| TRINITY |
5,560 |
5,180 |
380 |
6.9% |
| TULARE |
224,500 |
199,300 |
25,200 |
11.2% |
| TUOLUMNE |
22,330 |
21,120 |
1,210 |
5.4% |
| VENTURA |
429,700 |
410,400 |
19,300 |
4.5% |
| YOLO |
113,200 |
106,800 |
6,400 |
5.6% |
| YUBA |
36,600 |
33,900 |
2,600 |
7.2% |