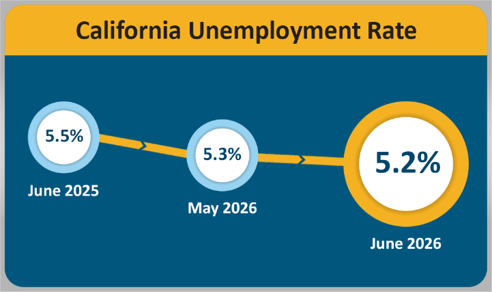
This month marks the lowest unemployment rate since May of 2024
Important Note: The employment data for the month of June 2026 comes from the survey week that included June 17. The release date for July 2026 data is scheduled for release on August 21.
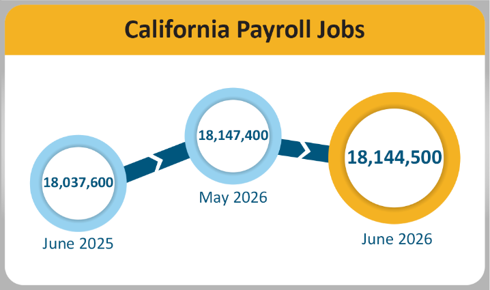
SACRAMENTO — California’s unemployment rate dropped to 5.2 percent1 in June, as the State lost 2,900 nonfarm payroll jobs2 over the month, according to the latest Employment Development Department (EDD) data, which comes from two separate surveys. The total nonfarm employment for May was revised down (-18,700), resulting in a loss of 15,600 jobs for that month.
California's Labor Market, by the Numbers...
- June’s 5.2% unemployment rate is the state’s lowest since May 2024. Over the past year, California’s unemployment rate declined 0.3% while the nation’s unemployment rate increased by 0.1% since June 2025.
- Although the state has recorded two straight months of small job losses, California has contributed 14.9% of the nation’s total job growth since the start of 2026. This is still well above California’s usual 11.4% monthly share of U.S. total nonfarm jobs.
- June marks the State’s seventh consecutive monthly decline in the number of unemployed Californians totaling 70,000 fewer people over that timeframe.
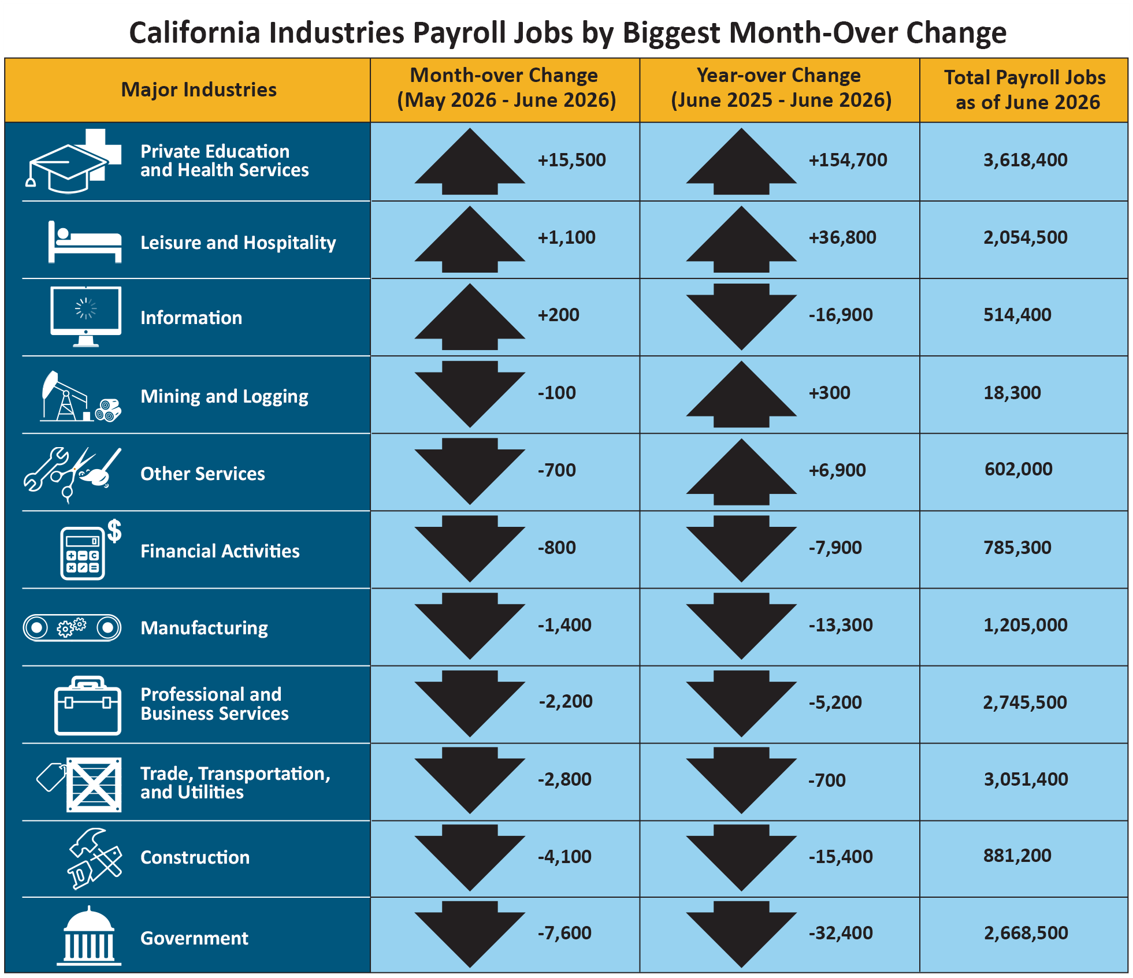
- Three of California's 11 industry sectors added jobs in June, led once again by gains in Private Education & Health Services (+15,500). A good share of the job gains came from Other Private Schools and Instruction, along with Offices of Other Health Practitioners, which reversed their seasonal trends to add jobs. Individual and Family Services had a stronger-than-average gain, posting its sixth straight month of growth.
- Leisure & Hospitality (+1,100) also posted a month-over job increase, driven by job gains in Arts, Entertainment, and Recreation although weaker than usual during this time, while the Accommodation and Food Services industry went against its seasonal trend and posted losses in Limited-Service Restaurants and Other Eating Places, and Special Food Services.
- Government (-7,600) posted the State’s largest month-over job loss, posting larger-than-usual losses in State Government Educational Services, Local Government Educational Services, and County Government. A portion of the losses can be attributed to seasonal reductions as schools pause for the summer.
1. The unemployment rate comes from a separate federal survey of 4,400 California households.
2. The nonfarm payroll job numbers come from a federal survey of 80,000 California businesses.
Data Trends about Jobs in the Economy
Total Nonfarm Payroll Jobs (Comes from a monthly survey of approximately 80,000 California businesses – seasonally adjusted)
- Month-over – Total nonfarm jobs in California’s 11 major industries amounted to 18,144,500 in June – a loss of 2,900 from May. This followed May’s downward revision of 18,700 jobs, resulting in a month-over loss of 15,600 jobs.
- Year-over – Total nonfarm jobs increased by 106,900 (0.59 percent increase) from June 2025 to June 2026 compared to the U.S. year-over gain of 506,000 jobs (0.32 percent increase).
| Industrias principales |
Cambio mensual
Abril 2026 – Mayo 2026 |
Cambio anual
Mayo 2025 – Mayo 2026 |
Total de empleos de nómina desde abril 2026 |
| Educación privada y servicios de salud |
+6,200 |
+141,000 |
3,600,600 |
| Recreación y hotelería |
+5,900 |
+36,000 |
2,055,800 |
| Información |
+2,400 |
-15,100 |
516,100 |
| Gobierno |
+2,100 |
-26,200 |
2,679,900 |
| Manufactura |
+1,200 |
-13,100 |
1,208,800 |
| Minería y tala |
+300 |
+400 |
18,600 |
| Construcción |
-100 |
-13,100 |
887,900 |
| Actividades financieras |
-600 |
-7,200 |
788,000 |
| Comercio, transporte y servicios públicos |
-2,400 |
-1,000 |
3,056,400 |
| Otros servicios |
-5,000 |
+6,300 |
602,000 |
| Servicios profesionales y empresariales |
-6,900 |
-5,100 |
2,752,000 |
Total de empleos agrícolas – El número de empleos en la industria agrícola disminuyó en 8,300 desde abril para un total de 409,600 empleos en mayo. La industria agrícola tuvo 12,300 empleos más en mayo de 2026 que en mayo de 2025.
Tendencias de los datos sobre los trabajadores en la economía
Empleo y desempleo en California (basado en una encuesta federal mensual a 4,400 hogares de California, la cual se enfoca en trabajadores en la economía)
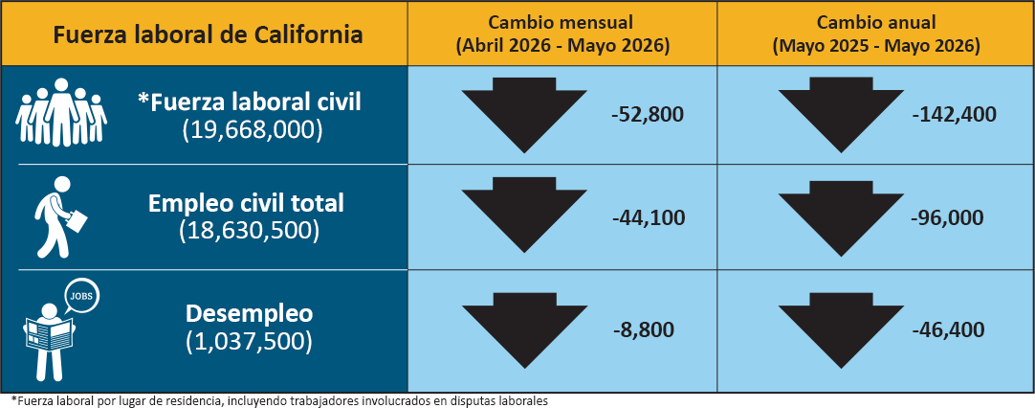
- Empleados – El número de californianos empleados en abril fue de 18,630,500, un descenso de 44,100 personas desde abril y un descenso de 96,000 respecto a mayo de 2025.
- Desempleados – El número de californianos desempleados fue de 1,037,500 en mayo, un descenso de 8,800 desde abril, y un declive de 46,400 comparado a mayo de 2025.
| Fuerza laboral de California |
Cambio mensual (Abril 2026 – Mayo 2026) |
Cambio anual (Mayo 2025 – Mayo 2026) |
| * Fuerza laboral civil (19,668,000) |
-52,800 |
-142,400 |
| Empleo civil total (18,630,500) |
-44,100 |
-96,000 |
| Desempleo (1,037,500) |
-8,800 |
-46,400 |
* Fuerza laboral por lugar de residencia, incluyendo a los trabajadores involucrados en disputas laborales.
Unemployment Insurance Claims (Not Seasonally Adjusted)
The following data is from a sample week that includes the 19th of each month:
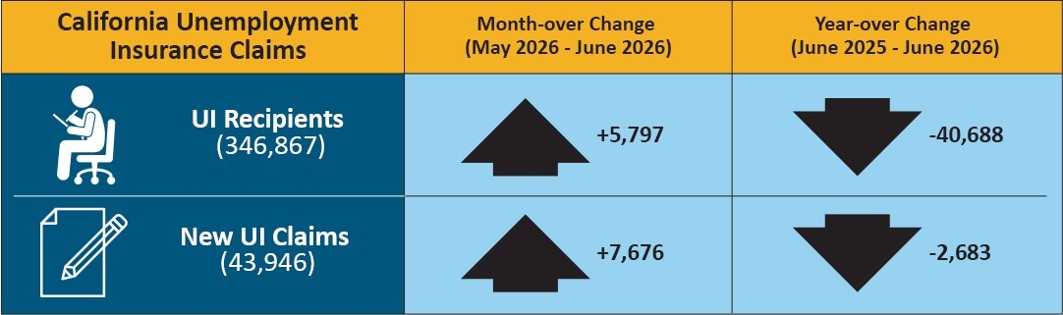
In related data that figures into the State’s unemployment rate, there were 346,867 people certifying for Unemployment Insurance (UI) benefits during the June 2026 sample week. That compares to 341,070 people in May and 387,555 people in June 2025. Concurrently, 43,946 initial claims were processed in the June 2026 sample week, which was a month-over increase of 7,676 claims from May and a year-over decrease of 2,683 claims from June 2025.
| Solicitudes del seguro de desempleo en California (UI) |
Cambio mensual (Abril 2026 – Mayo 2026) |
Cambio anual (Mayo 2025 – Mayo 2026) |
| Beneficiarios de UI (341,070) |
-23,025 |
-43,679 |
| Nuevas solicitudes de UI (36,270) |
-1,674 |
-4,966 |
DATOS MENSUALES DE LA FUERZA LABORAL POR CONDADO
Mayo 2026 (Preliminary); 2025 Punto de referencia
SIN AJUSTE TEMPORAL
| CONDADO |
FUERZA LABORAL |
EMPLEO |
DESEMPLEO |
TASA |
| Total Estatal |
19,475,800 |
18,554,800 |
921,100 |
4.7% |
| Alameda |
851,400 |
818,800 |
32,600 |
3.8% |
| Alpine |
440 |
400 |
40 |
9.8% |
| Amador |
15,040 |
14,300 |
740 |
4.9% |
| Butte |
89,900 |
85,200 |
4,700 |
5.2% |
| Calaveras |
17,350 |
16,420 |
930 |
5.4% |
| Colusa |
11,550 |
10,220 |
1,320 |
11.4% |
| Contra Costa |
571,800 |
549,100 |
22,700 |
4.0% |
| Del Norte |
9,240 |
8,730 |
510 |
5.6% |
| El Dorado |
89,300 |
85,500 |
3,800 |
4.2% |
| Fresno |
478,100 |
442,600 |
35,500 |
7.4% |
| Glenn |
11,690 |
10,950 |
740 |
6.3% |
| Humboldt |
59,800 |
57,200 |
2,600 |
4.3% |
| Imperial |
73,500 |
61,100 |
12,400 |
16.9% |
| Inyo |
8,290 |
7,980 |
310 |
3.7% |
| Kern |
409,400 |
375,600 |
33,800 |
8.3% |
| Kings |
60,000 |
55,200 |
4,800 |
8.0% |
| Lake |
26,410 |
24,820 |
1,590 |
6.0% |
| Lassen |
8,080 |
7,630 |
450 |
5.6% |
| Los Angeles |
5,018,200 |
4,755,700 |
262,500 |
5.2% |
| Madera |
71,400 |
66,400 |
5,000 |
7.0% |
| Marin |
122,500 |
118,300 |
4,200 |
3.4% |
| Mariposa |
7,430 |
7,060 |
380 |
5.1% |
| Mendocino |
36,540 |
34,860 |
1,690 |
4.6% |
| Merced |
123,600 |
112,800 |
10,800 |
8.8% |
| Modoc |
3,070 |
2,900 |
170 |
5.7% |
| Mono |
8,520 |
8,230 |
290 |
3.5% |
| Monterey |
225,900 |
212,600 |
13,300 |
5.9% |
| Napa |
75,100 |
72,500 |
2,700 |
3.6% |
| Nevada |
46,450 |
44,520 |
1,930 |
4.2% |
| Orange |
1,598,200 |
1,543,000 |
55,100 |
3.5% |
| Placer |
206,600 |
199,200 |
7,500 |
3.6% |
| Plumas |
7,760 |
7,320 |
440 |
5.6% |
| Riverside |
1,175,600 |
1,120,300 |
55,300 |
4.7% |
| Sacramento |
777,100 |
744,200 |
32,900 |
4.2% |
| San Benito |
34,100 |
32,200 |
2,000 |
5.7% |
| San Bernardino |
1,016,100 |
969,900 |
46,200 |
4.6% |
| San Diego |
1,644,700 |
1,581,000 |
63,700 |
3.9% |
| San Francisco |
494,300 |
477,800 |
16,500 |
3.3% |
| San Joaquin |
373,500 |
352,700 |
20,800 |
5.6% |
| San Luis Obispo |
132,200 |
127,500 |
4,800 |
3.6% |
| San Mateo |
404,500 |
391,800 |
12,700 |
3.1% |
| Santa Barbara |
224,600 |
216,400 |
8,300 |
3.7% |
| Santa Clara |
1,021,400 |
986,400 |
35,000 |
3.4% |
| Santa Cruz |
136,400 |
129,500 |
6,900 |
5.1% |
| Shasta |
80,800 |
77,100 |
3,700 |
4.5% |
| Sierra |
1,420 |
1,360 |
60 |
4.2% |
| Siskiyou |
16,170 |
15,130 |
1,050 |
6.5% |
| Solano |
215,600 |
206,000 |
9,600 |
4.4% |
| Sonoma |
244,700 |
235,700 |
9,000 |
3.7% |
| Stanislaus |
252,100 |
236,100 |
16,000 |
6.4% |
| Sutter |
46,000 |
42,400 |
3,600 |
7.9% |
| Tehama |
27,220 |
25,790 |
1,430 |
5.2% |
| Trinity |
5,570 |
5,310 |
260 |
4.7% |
| Tulare |
221,800 |
200,700 |
21,100 |
9.5% |
| Tuolumne |
21,760 |
20,730 |
1,040 |
4.8% |
| Ventura |
417,900 |
401,700 |
16,200 |
3.9% |
| Yolo |
111,500 |
106,200 |
5,300 |
4.8% |
| Yuba |
35,800 |
33,700 |
2,100 |
5.9% |