Important Note: September 2026 employment data is based on the survey week that included September 12. The release date for October 2026 data is scheduled for November 20.
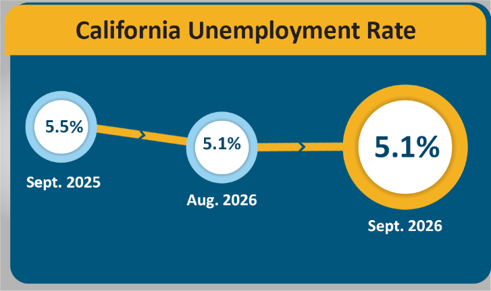
SACRAMENTO — California’s unemployment rate held steady at 5.1 percent1 in September 2026, unchanged from August, according to the latest data from the Employment Development Department (EDD). The state lost 9,300 nonfarm payroll jobs2 during the month. August’s total nonfarm job gain was revised down 16,300 to a total gain of 23,100 jobs for the month.
California's Labor Market, by the Numbers...
- California lost 9,300 nonfarm jobs in September but gained 129,300 jobs (0.72 percent) over the past year. Nationally, nonfarm jobs grew 496,000 (0.31 percent) over the same period.
- The number of unemployed Californians fell by 5,400 in September, marking the 10th consecutive monthly decline. Over that period, unemployment fell by 106,500.
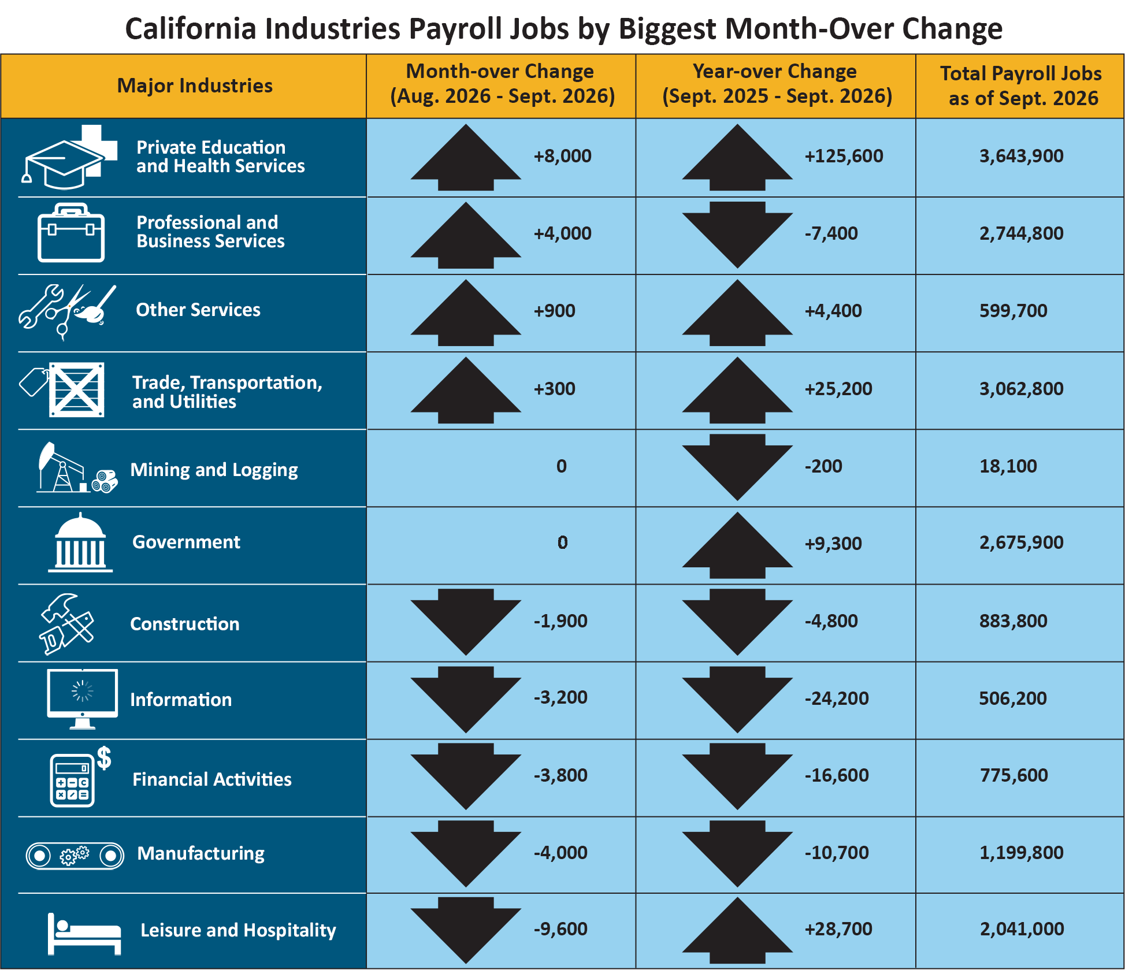
- Four of California's 11 industry sectors added jobs in September. Private Education & Health Services led the way adding 8,000 jobs, including gains in Private Colleges, Universities, and Professional Schools.
- Professional and Business Services added 4,000 jobs, driven by growth in Employment Services. The industry added about 30 percent more jobs than is typical for September.
- Leisure and Hospitality had the largest month-over job losses of 9,600 jobs in September. Losses in Amusement, Gambling, and Recreation, as well as in the Restaurants and Other Eating Places were greater than typically seen for the month. This deviation potentially reflects caution among consumers in discretionary spending.
1. The unemployment rate comes from a separate federal survey of 4,400 California households.
2. The nonfarm payroll job numbers come from a federal survey of 80,000 California businesses.
Data Trends about Jobs in the Economy
Total Nonfarm Payroll Jobs (Comes from a monthly survey of approximately 80,000 California businesses – seasonally adjusted)
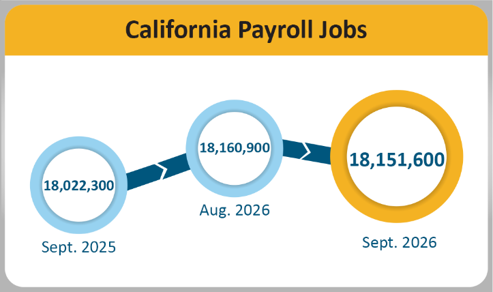
- Month-over – Total nonfarm jobs in California’s 11 major industries amounted to 18,151,600 in September – a loss of 9,300 from August. This followed August’s downward revision of 16,300 jobs, resulting in a month-over August gain of 23,100 jobs.
- Year-over – Total nonfarm jobs increased by 129,300 (0.72 percent increase) from September 2025 to September 2026 compared to the U.S. year-over gain of 496,000 jobs (0.31 percent increase).
| Major Industries |
Month-over Change
(Aug. 2026 - Sept. 2026) |
Year-over Change
(Sept. 2025 - Sept. 2026) |
Total Payroll Jobs
as of Sept. 2026 |
| Private Education and Health Services |
+8,000 |
+125,600 |
3,643,900 |
| Professional and Business Services |
+4,000 |
-7,400 |
2,744,800 |
| Other Services |
+900 |
+4,400 |
599,700 |
| Trade, Transportation, and Utilities |
+300 |
+25,200 |
3,062,800 |
| Mining and Logging |
0 |
-200 |
18,100 |
| Government |
0 |
+9,300 |
2,675,900 |
| Construction |
-1,900 |
-4,800 |
883,800 |
| Information |
-3,200 |
-24,200 |
506,200 |
| Financial Activities |
-3,800 |
-16,600 |
775,600 |
| Manufacturing |
-4,000 |
-10,700 |
1,199,800 |
| Leisure and Hospitality |
-9,600 |
+28,700 |
2,041,000 |
Total Farm Jobs – The number of jobs in the agriculture industry increased by 1,100 in September to a total of 409,600 jobs. The agriculture industry had 14,500 more farm jobs in September 2026 than it did in September 2025.
Data Trends about Workers in the Economy
Employment and Unemployment in California (Based on a monthly federal survey of 4,400 California households which focuses on workers in the economy)
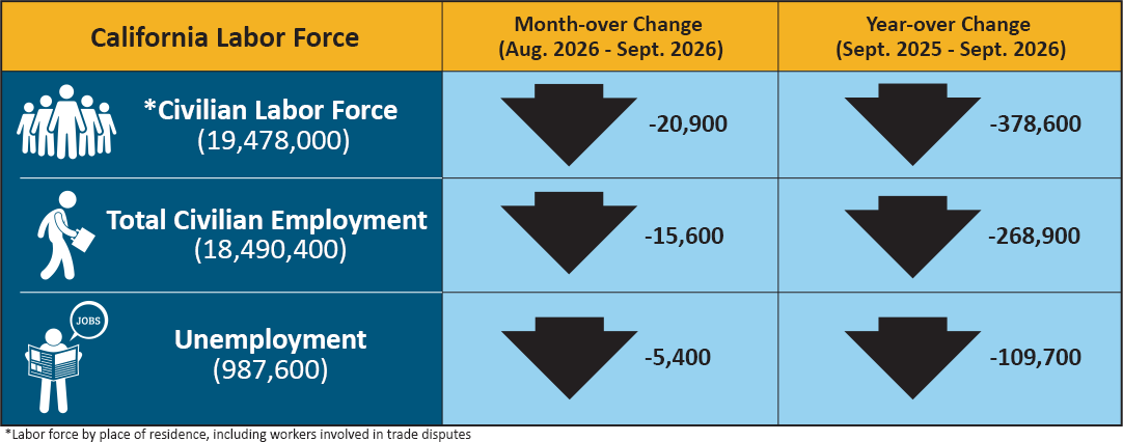
- Employed – The number of Californians employed in September was 18,490,400, a decrease of 15,600 from August and down 268,900 compared to September of last year.
- Unemployed – The number of unemployed Californians was 987,600 in September, down 5,400 from August and down 109,700 from September 2025.
| California Labor Force |
Month-over Change (Aug. 2026 – Sept. 2026) |
Year-over Change (Sept. 2025 – Sept. 2026) |
| * Civilian Labor Force (19,478,000) |
-20,900 |
-378,600 |
| Total Civilian Employment (18,490,400) |
-15,600 |
-268,900 |
| Unemployment (987,600) |
-5,400 |
-109,700 |
* Labor force by place of residence, including workers involved in trade disputes.
Unemployment Insurance Claims (Not Seasonally Adjusted)
The following data is from a sample week that includes the 19th of each month:
In related data that figures into the State’s unemployment rate, there were 310,167 people certifying for Unemployment Insurance benefits during the September 2026 sample week. That compares to 332,382 people in August and 359,565 people in September 2025. Concurrently, 35,070 initial claims were processed in the September 2026 sample week, which was a month-over decrease of 262 claims from August and a year-over decrease of 2,390 claims from September 2025.
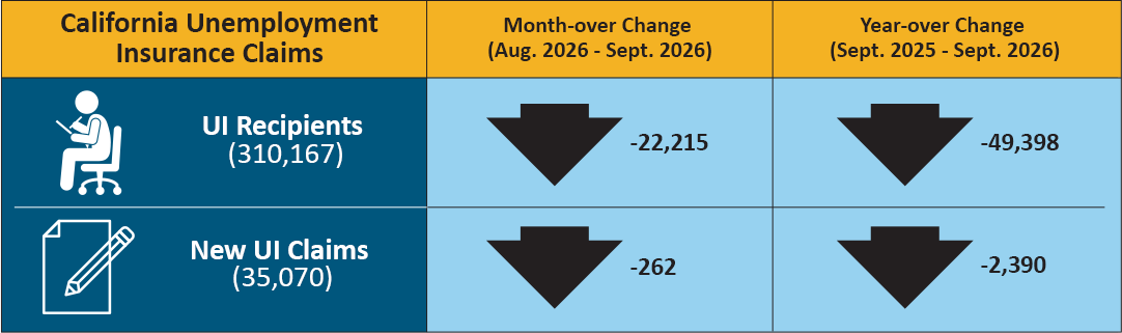
| California Unemployment Insurance Claims |
Month-over Change (Aug. 2026 – Sept. 2026) |
Year-over Change (Sept. 2025 – Sept. 2026) |
| UI Recipients (310,167) |
-22,215 |
-49,398 |
| New UI Claims (35,070) |
-262 |
-2,390 |
Monthly Labor Force Data for Counties
September 2026; 2025 Benchmark
Not Seasonally Adjusted
| County |
Labor Force |
Employment |
Unemployment |
Rate |
| STATE TOTAL |
19,643,800 |
18,647,600 |
996,200 |
5.1% |
| ALAMEDA |
860,500 |
820,300 |
40,200 |
4.7% |
| ALPINE |
420 |
380 |
40 |
10.0% |
| AMADOR |
15,160 |
14,280 |
870 |
5.8% |
| BUTTE |
90,600 |
85,200 |
5,400 |
5.9% |
| CALAVERAS |
17,590 |
16,490 |
1,100 |
6.2% |
| COLUSA |
11,780 |
10,760 |
1,020 |
8.6% |
| CONTRA COSTA |
577,500 |
549,700 |
27,800 |
4.8% |
| DEL NORTE |
9,400 |
8,840 |
560 |
6.0% |
| EL DORADO |
89,900 |
85,500 |
4,500 |
5.0% |
| FRESNO |
478,400 |
443,200 |
35,200 |
7.4% |
| GLENN |
11,930 |
11,160 |
780 |
6.5% |
| HUMBOLDT |
60,300 |
57,200 |
3,100 |
5.2% |
| IMPERIAL |
76,200 |
60,400 |
15,800 |
20.8% |
| INYO |
8,360 |
7,980 |
390 |
4.6% |
| KERN |
417,000 |
384,200 |
32,900 |
7.9% |
| KINGS |
59,600 |
54,700 |
4,800 |
8.1% |
| LAKE |
26,900 |
24,990 |
1,910 |
7.1% |
| LASSEN |
8,570 |
8,040 |
530 |
6.2% |
| LOS ANGELES |
5,031,000 |
4,806,500 |
224,500 |
4.5% |
| MADERA |
71,100 |
66,200 |
5,000 |
7.0% |
| MARIN |
123,400 |
118,100 |
5,300 |
4.3% |
| MARIPOSA |
7,850 |
7,410 |
430 |
5.5% |
| MENDOCINO |
37,130 |
35,190 |
1,950 |
5.2% |
| MERCED |
125,100 |
115,000 |
10,200 |
8.1% |
| MODOC |
3,090 |
2,900 |
190 |
6.1% |
| MONO |
8,500 |
8,130 |
370 |
4.4% |
| MONTEREY |
227,600 |
215,100 |
12,400 |
5.5% |
| NAPA |
74,300 |
71,200 |
3,100 |
4.2% |
| NEVADA |
47,500 |
45,190 |
2,300 |
4.8% |
| ORANGE |
1,615,900 |
1,546,400 |
69,500 |
4.3% |
| PLACER |
208,500 |
199,300 |
9,200 |
4.4% |
| PLUMAS |
7,870 |
7,430 |
440 |
5.6% |
| RIVERSIDE |
1,193,400 |
1,123,000 |
70,400 |
5.9% |
| SACRAMENTO |
784,900 |
744,800 |
40,100 |
5.1% |
| SAN BENITO |
35,200 |
33,200 |
2,000 |
5.7% |
| SAN BERNARDINO |
1,029,300 |
973,200 |
56,100 |
5.5% |
| SAN DIEGO |
1,656,700 |
1,578,500 |
78,200 |
4.7% |
| SAN FRANCISCO |
501,400 |
481,300 |
20,100 |
4.0% |
| SAN JOAQUIN |
377,200 |
353,700 |
23,500 |
6.2% |
| SAN LUIS OBISPO |
133,300 |
127,200 |
6,100 |
4.6% |
| SAN MATEO |
410,700 |
394,700 |
16,000 |
3.9% |
| SANTA BARBARA |
226,300 |
216,100 |
10,100 |
4.5% |
| SANTA CLARA |
1,040,700 |
997,400 |
43,300 |
4.2% |
| SANTA CRUZ |
138,700 |
131,600 |
7,100 |
5.1% |
| SHASTA |
81,500 |
77,300 |
4,200 |
5.2% |
| SIERRA |
1,540 |
1,480 |
60 |
4.1% |
| SISKIYOU |
16,770 |
15,640 |
1,120 |
6.7% |
| SOLANO |
218,900 |
207,300 |
11,500 |
5.3% |
| SONOMA |
247,200 |
236,500 |
10,700 |
4.3% |
| STANISLAUS |
255,300 |
238,400 |
16,900 |
6.6% |
| SUTTER |
46,200 |
42,900 |
3,300 |
7.1% |
| TEHAMA |
27,800 |
26,170 |
1,630 |
5.9% |
| TRINITY |
5,640 |
5,340 |
310 |
5.4% |
| TULARE |
217,400 |
196,100 |
21,300 |
9.8% |
| TUOLUMNE |
22,010 |
20,800 |
1,210 |
5.5% |
| VENTURA |
418,000 |
397,400 |
20,600 |
4.9% |
| YOLO |
112,600 |
106,400 |
6,200 |
5.5% |
| YUBA |
36,200 |
33,800 |
2,300 |
6.5% |