新聞發布號: 24-11
聯絡: Loree Levy/Aubrey Henry
916-654-9029
mediainquiries@edd.ca.gov
重要説明: 2024 年 2 月就業資料取自包括 2 月 12 日在內的調查週。 3 月資料計劃於 2024 年 4 月 19 日發布。
雇主失去 3,400 個非農工作崗位
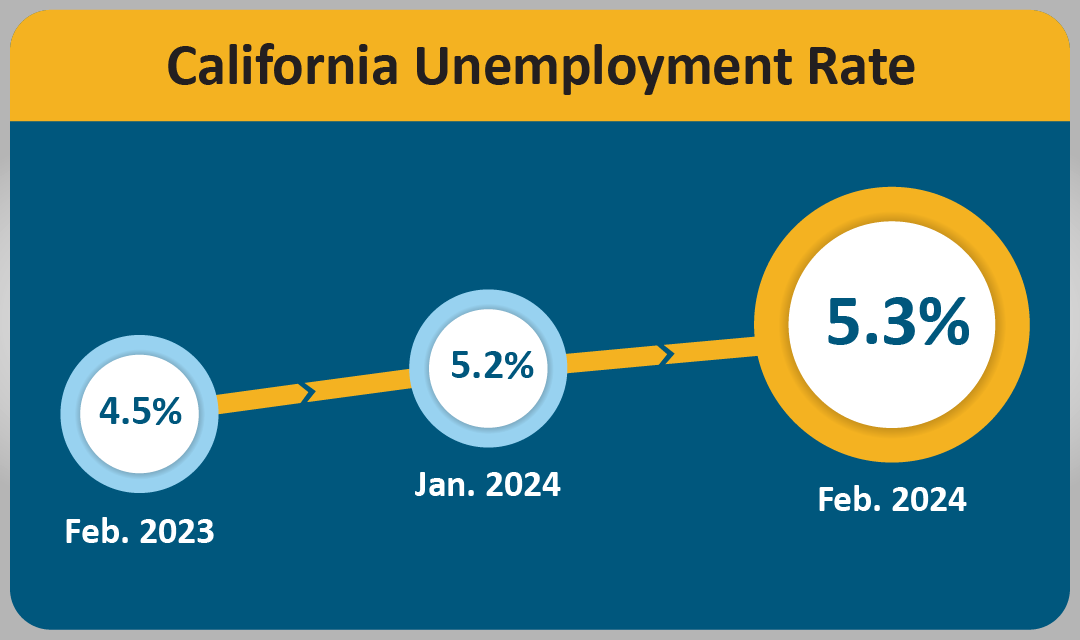
薩克拉門托—2024 年 2 月,加州失業率從 1 月份的 5.2% 升至 5.3%1 ,非農工作崗位減少 3,400 個2。 此外,加州 1 月份非農就業崗位預估在調整後減少32,500 個,該月總增量為 25,600 個。 這是根據就業發展部(EDD)今天發布的兩項調查數據得出的。
從數字看加州的勞動力市場…
- 2024 年 2 月加州就業市場擴張活動已進入第46 個月。自 2020 年 2 月疫情前高峰以來,加州已增加 3,037,600 個就業崗位,平均每月增加 66,035 個就業崗位。
- 加利福尼亞州向下修正的 2024 年 1 月非農就業總數反映了全國的情況,聯邦政府也大幅向下修正了約 124,000 個就業崗位。 美國失業率上升2%至3.9%,為2022年1月以來最高。
- 加州 11 個行業中有 4 個行業在 2 月份增加了工作崗位,其中私立教育和健康服務 (+15,400) 憑藉其他醫療健康行業的從業者(如針灸師和營養師),家庭醫療保健服務以及個人和家庭服務再次實現月度最大增幅。
- 建築業出現明顯的月度損失(-9,600),部分原因是加州該月多次受到“大氣河”風暴襲擊,造成多個行業就業減少。
- 貿易、運輸和公用事業 (-7,300) 領域也有所下降。 這是由於機械、設備和用品批發商等子行業出現了下滑,而全國整體消費者可自由支配支出和需求的下降又起到了推波助瀾的作用。
- 失業率來自對 5,100 戶加州家庭的單獨聯邦調查。
- 非農就業人數來自對 80,000 家加州企業的聯邦調查。
經濟活動中的就業數據趨勢
非農就業崗位總數 (數據來自對大約 80,000 家加州企業的月度調查,該調查評估經濟活動中的就業崗位——經過季節性調整) 。
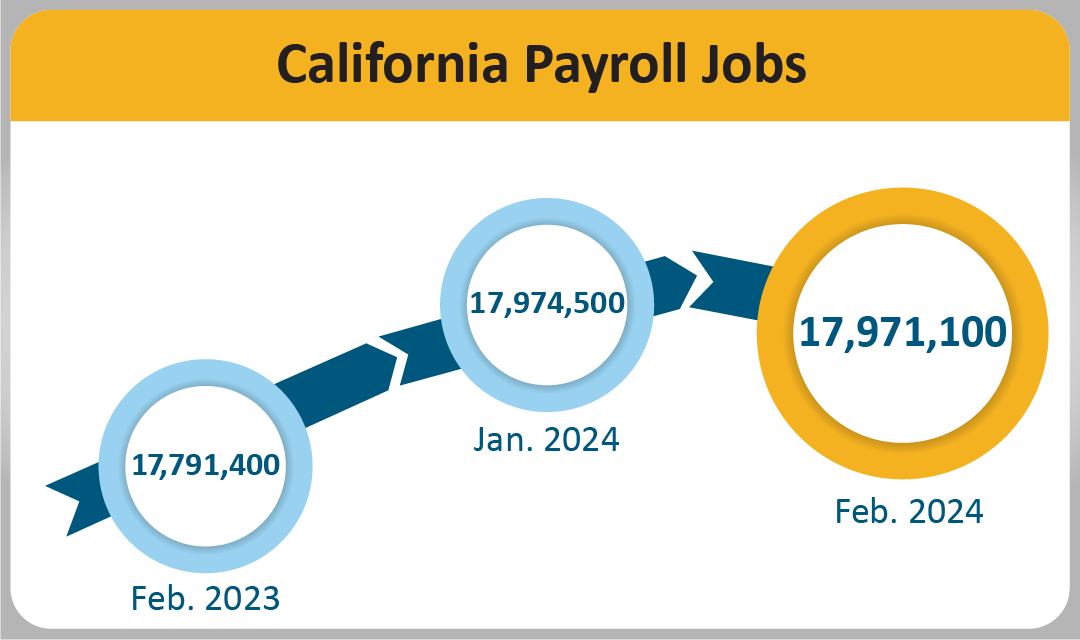
月環比— 2 月份加州 11 個主要行業的非農就業崗位總數為 17,971,100 個,較 1 月份淨減少 3,400 個。在此之前,1 月份就業崗位環比增加 25,600 個,向下修正(-32,500)。
年同比— 從 2023 年 2 月到 2024 年 2 月,非農就業崗位總數增加了 179,700 個(成長 1.0%),而美國的年度成長為 2,748,000 個就業崗位(成長 1.8%)。
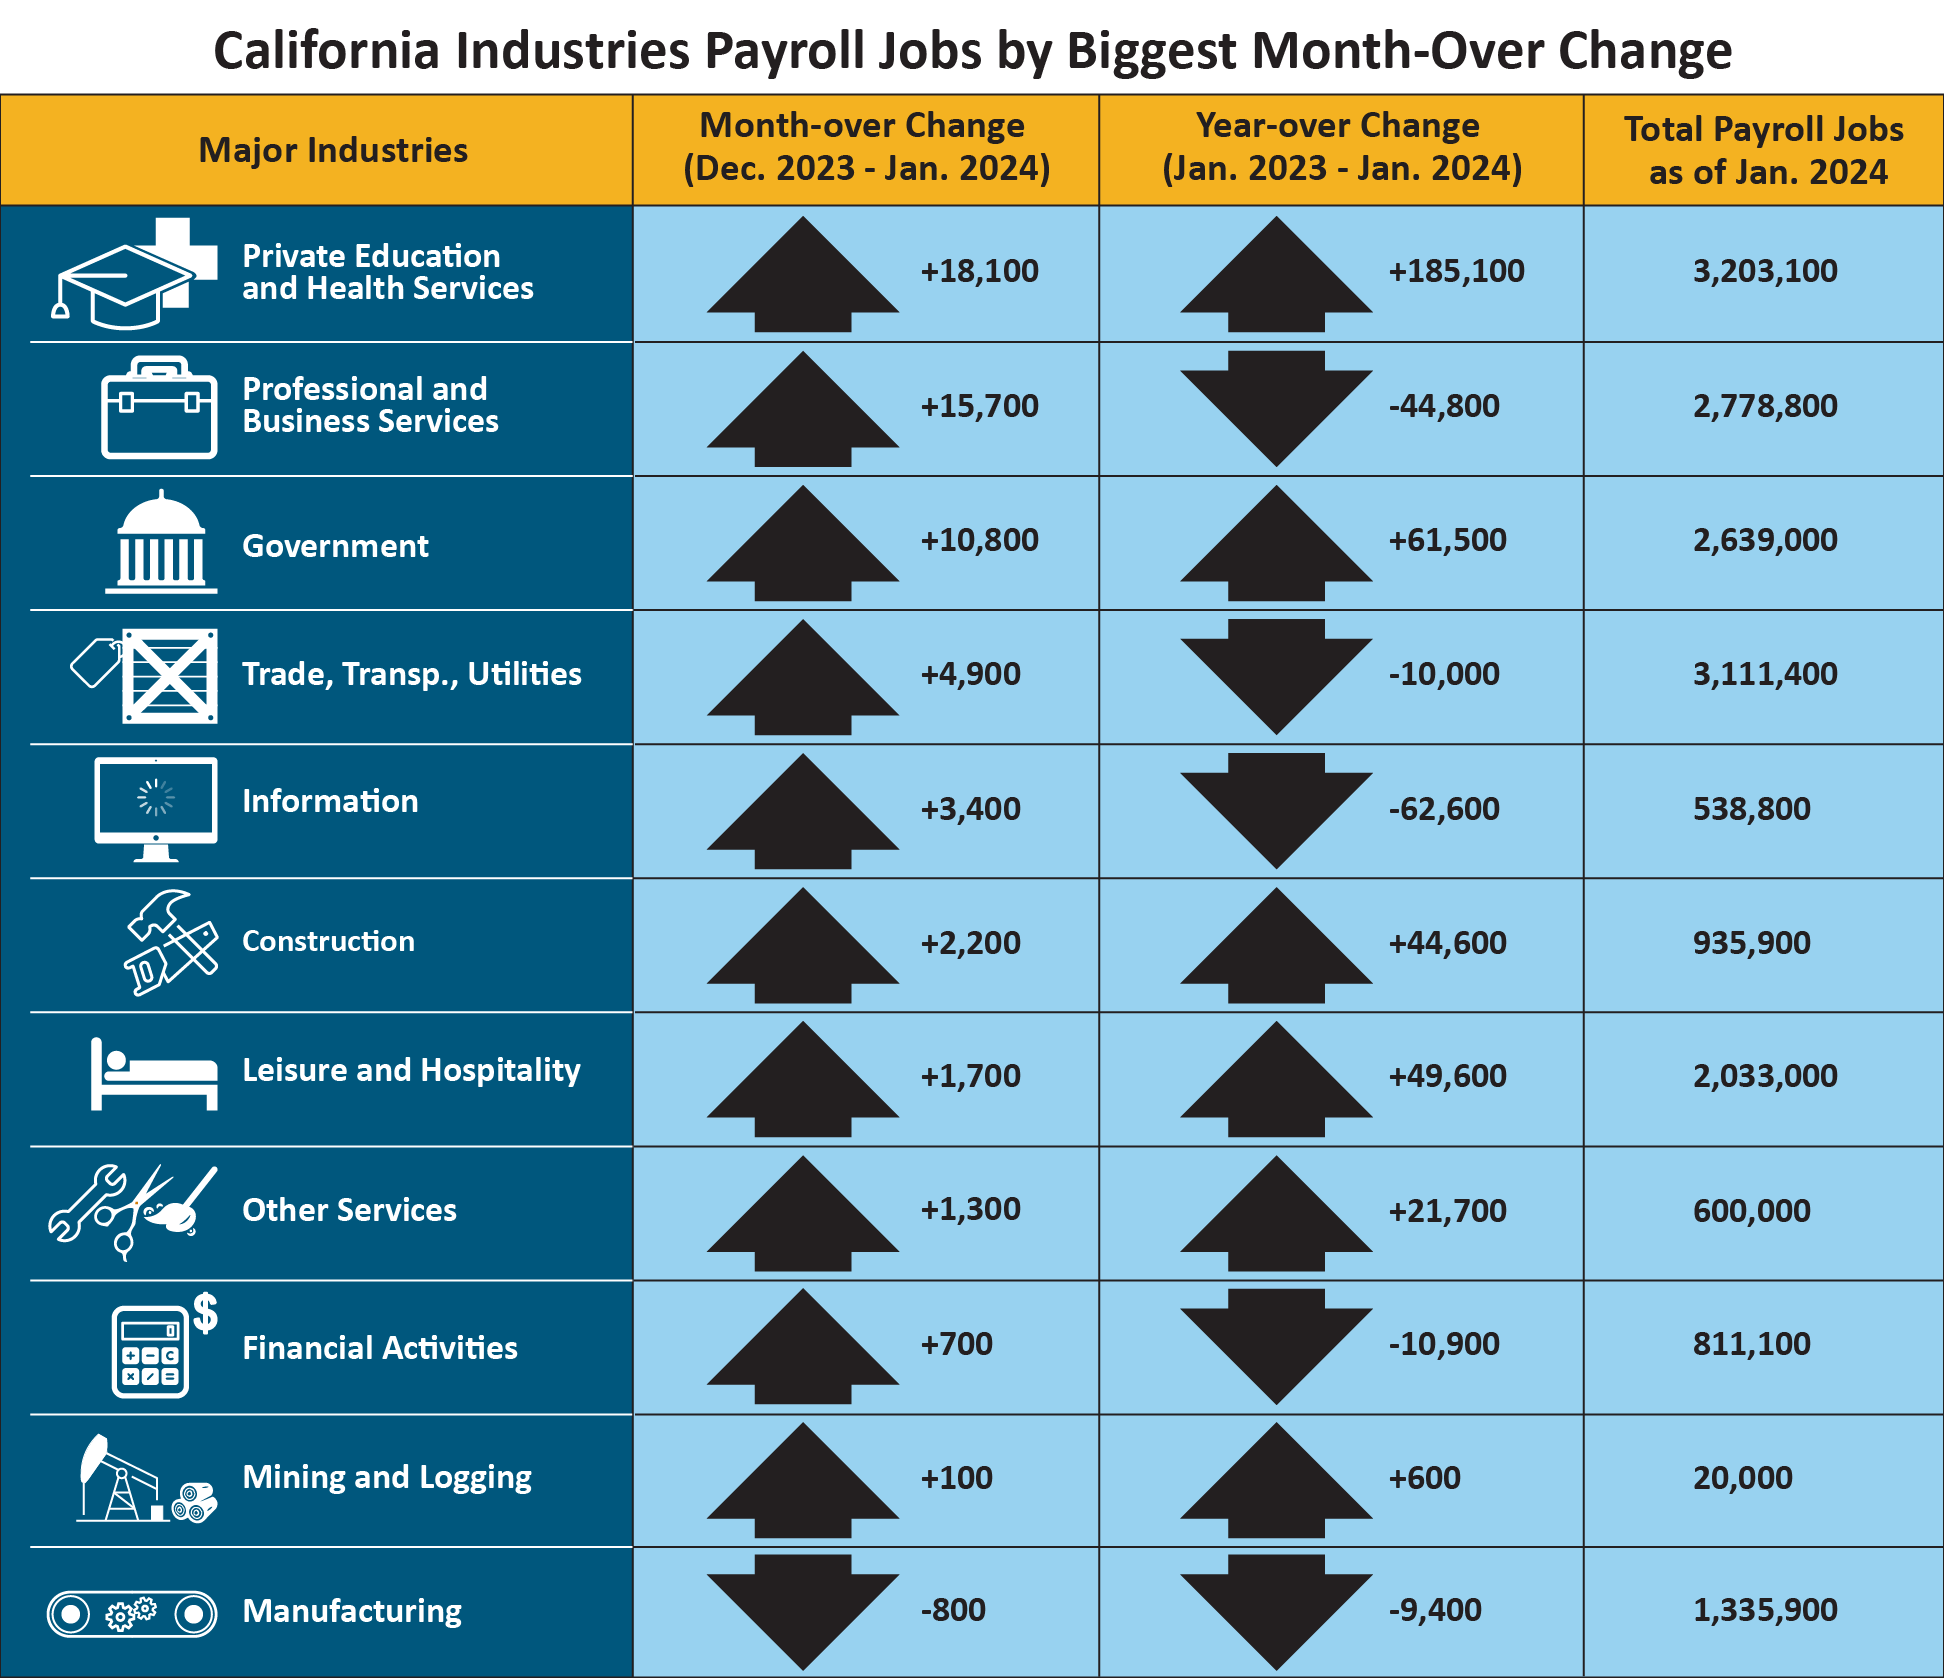
| Major Industries |
Month-over Change (December 2023–January 2024) |
Year-over Change (January 2023–January 2024) |
Total Payroll Jobs as of January 2024 |
|
Private Education and Health Services
|
+18,100 |
+185,100 |
3,203,100 |
|
Professional and Business Services
|
+15,700 |
-44,800 |
2,778,800 |
| Government |
+10,800 |
+61,500 |
2,639,000 |
|
Trade, Transp., Utilities
|
+4,900 |
-10,000 |
3,111,400 |
|
Information
|
+3,400 |
-62,600 |
538,800 |
| Construction |
+2,200 |
+44,600 |
935,900 |
|
Leisure and Hospitality
|
+1,700 |
+49,600 |
2,033,000 |
|
Other Services
|
+1,300 |
+21,700 |
600,000 |
|
Financial Activities
|
+700 |
-10,900 |
811,100 |
|
Mining and Logging
|
+100 |
+600 |
20,000 |
|
Manufacturing
|
-800 |
-9,400 |
1,335,900 |
農業就業崗位總數— 1月份農業就業崗位總數為427,100個,較去年12月減少了21,300個。 2024 年 1 月農業產業的農場工作崗位比一年前 1 月增加了 36,300 個。
經濟活動中的人力資源數據趨勢
加州的就業和失業 加州的就業和失業情況(基於每月對 5,100 個加州家庭的聯邦調查,其重點放在參與經濟活動的工人數據)
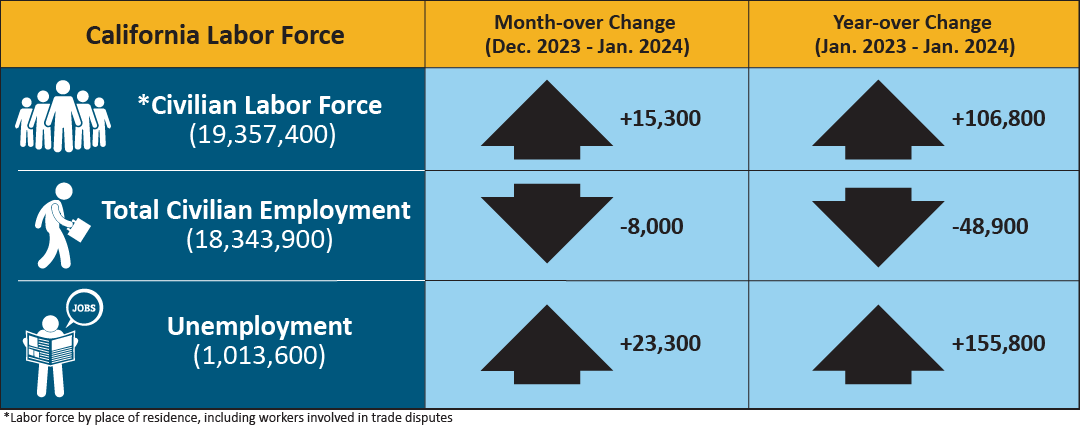
- 就業人數—1月份加州就業人數為18,343,900人,比12月份的18,351,900人減少8,000人,比1月份就業總數減少48,900人。
- 失業人數—1 月份加州失業人數為 1,013,600 人,環比增加 23,300 人,較 2023 年 1 月增加155,800 人。
| California Labor Force |
Month-over Change (December 2023–January 2024) |
Year-over Change (January 2023-January 2024) |
| * Civilian Labor Force (19,357,400) |
+15,300 |
+106,800 |
| Total Civilian Employment (18,343,900) |
-8,000 |
-48,900 |
| Unemployment (1,013,600) |
+23,300 |
+155,800 |
* Labor force by place of residence, including workers involved in trade disputes.
申領失業保險金的人數(未經季節性調整 )
以下數據來自包括每月 19 日在內的樣本週:
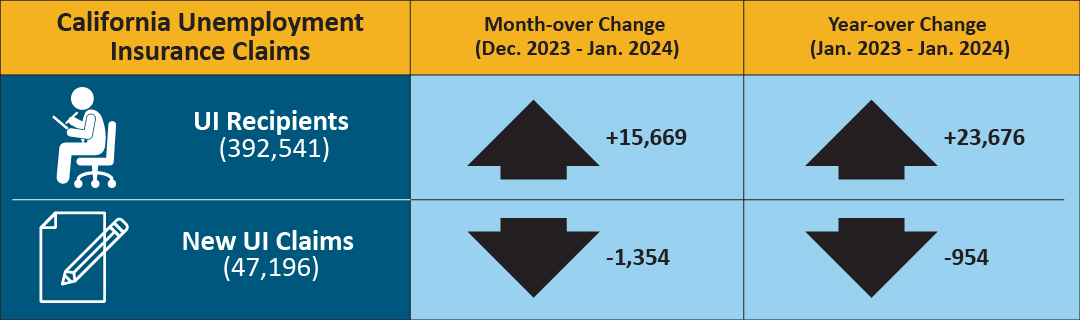
在計算加州失業率的相關數據中,2024 年 1 月樣本週期間有 392,541 人領取失業保險 (UI) 福利。 相較之下,12 月有 376,872 人,2023 年 1 月有368,865 人。同時,2024 年 1 月樣本週處理了 47,196 份首次申領,較 12 月環比減少 1,354 份,比2023 年 1 月同比減少 954 份。
| California Unemployment Insurance Claims |
Month-over Change (December 2023–January 2024) |
Year-over Change (January 2023-January 2024) |
| UI Recipients (392,541) |
+15,669 |
+26,676 |
| New UI Claims (47,196) |
-1,354 |
-954 |
MONTHLY LABOR FORCE DATA FOR COUNTIES
January 2024 (Preliminary); 2023 Benchmark
NOT SEASONALLY ADJUSTED
| COUNTY |
LABOR FORCE |
EMPLOYMENT |
UNEMPLOYMENT |
RATE |
| STATE TOTAL |
19,344,200 |
18,239,000 |
1,105,200 |
5.7% |
| ALAMEDA |
825,700 |
784,500 |
41,200 |
5.0% |
| ALPINE |
650 |
610 |
40 |
6.6% |
| AMADOR |
14,380 |
13,480 |
890 |
6.2% |
| BUTTE |
92,900 |
86,700 |
6,100 |
6.6% |
| CALAVERAS |
21,960 |
20,780 |
1,180 |
5.4% |
| COLUSA |
10,570 |
8,530 |
2,040 |
19.3% |
| CONTRA COSTA |
550,700 |
523,000 |
27,700 |
5.0% |
| DEL NORTE |
9,250 |
8,580 |
660 |
7.2% |
| EL DORADO |
94,700 |
90,000 |
4,700 |
5.0% |
| FRESNO |
464,500 |
423,600 |
41,000 |
8.8% |
| GLENN |
12,520 |
11,510 |
1,010 |
8.0% |
| HUMBOLDT |
60,000 |
56,400 |
3,500 |
5.9% |
| IMPERIAL |
75,000 |
61,600 |
13,300 |
17.8% |
| INYO |
8,240 |
7,850 |
390 |
4.8% |
| KERN |
398,900 |
361,000 |
37,900 |
9.5% |
| KINGS |
59,800 |
53,900 |
5,900 |
9.9% |
| LAKE |
29,310 |
27,150 |
2,160 |
7.4% |
| LASSEN |
8,510 |
7,900 |
610 |
7.1% |
| LOS ANGELES |
5,018,800 |
4,722,100 |
296,600 |
5.9% |
| MADERA |
67,100 |
61,300 |
5,900 |
8.7% |
| MARIN |
132,300 |
126,900 |
5,400 |
4.1% |
| MARIPOSA |
7,400 |
6,890 |
520 |
7.0% |
| MENDOCINO |
37,270 |
34,980 |
2,290 |
6.1% |
| MERCED |
121,000 |
107,800 |
13,200 |
10.9% |
| MODOC |
3,190 |
2,860 |
320 |
10.2% |
| MONO |
9,730 |
9,320 |
420 |
4.3% |
| MONTEREY |
210,300 |
188,200 |
22,100 |
10.5% |
| NAPA |
71,800 |
68,400 |
3,300 |
4.6% |
| NEVADA |
49,780 |
47,410 |
2,370 |
4.8% |
| ORANGE |
1,590,900 |
1,523,900 |
66,900 |
4.2% |
| PLACER |
196,400 |
187,600 |
8,900 |
4.5% |
| PLUMAS |
7,060 |
6,280 |
780 |
11.0% |
| RIVERSIDE |
1,164,200 |
1,099,800 |
64,300 |
5.5% |
| SACRAMENTO |
737,800 |
698,800 |
39,000 |
5.3% |
| SAN BENITO |
32,200 |
29,800 |
2,400 |
7.5% |
| SAN BERNARDINO |
1,018,900 |
964,000 |
54,900 |
5.4% |
| SAN DIEGO |
1,597,700 |
1,521,800 |
75,800 |
4.7% |
| SAN FRANCISCO |
561,000 |
538,700 |
22,400 |
4.0% |
| SAN JOAQUIN |
349,100 |
323,000 |
26,100 |
7.5% |
| SAN LUIS OBISPO |
135,000 |
129,200 |
5,700 |
4.2% |
| SAN MATEO |
443,400 |
427,000 |
16,400 |
3.7% |
| SANTA BARBARA |
214,100 |
202,100 |
12,000 |
5.6% |
| SANTA CLARA |
1,034,000 |
989,200 |
44,800 |
4.3% |
| SANTA CRUZ |
131,600 |
121,800 |
9,800 |
7.4% |
| SHASTA |
75,000 |
70,200 |
4,800 |
6.4% |
| SIERRA |
1,300 |
1,220 |
80 |
6.2% |
| SISKIYOU |
16,870 |
15,400 |
1,470 |
8.7% |
| SOLANO |
205,000 |
193,400 |
11,600 |
5.7% |
| SONOMA |
249,400 |
238,200 |
11,200 |
4.5% |
| STANISLAUS |
248,300 |
229,400 |
18,900 |
7.6% |
| SUTTER |
46,900 |
42,300 |
4,600 |
9.8% |
| TEHAMA |
26,240 |
24,400 |
1,830 |
7.0% |
| TRINITY |
4,510 |
4,170 |
340 |
7.5% |
| TULARE |
214,400 |
189,100 |
25,400 |
11.8% |
| TUOLUMNE |
19,970 |
18,740 |
1,230 |
6.2% |
| VENTURA |
413,600 |
392,200 |
21,400 |
5.2% |
| YOLO |
110,700 |
104,000 |
6,700 |
6.1% |
| YUBA |
32,500 |
29,800 |
2,700 |
8.3% |