NR No. 24-15
Contact: Loree Levy/Aubrey Henry
916-654-9029
mediainquiries@edd.ca.gov
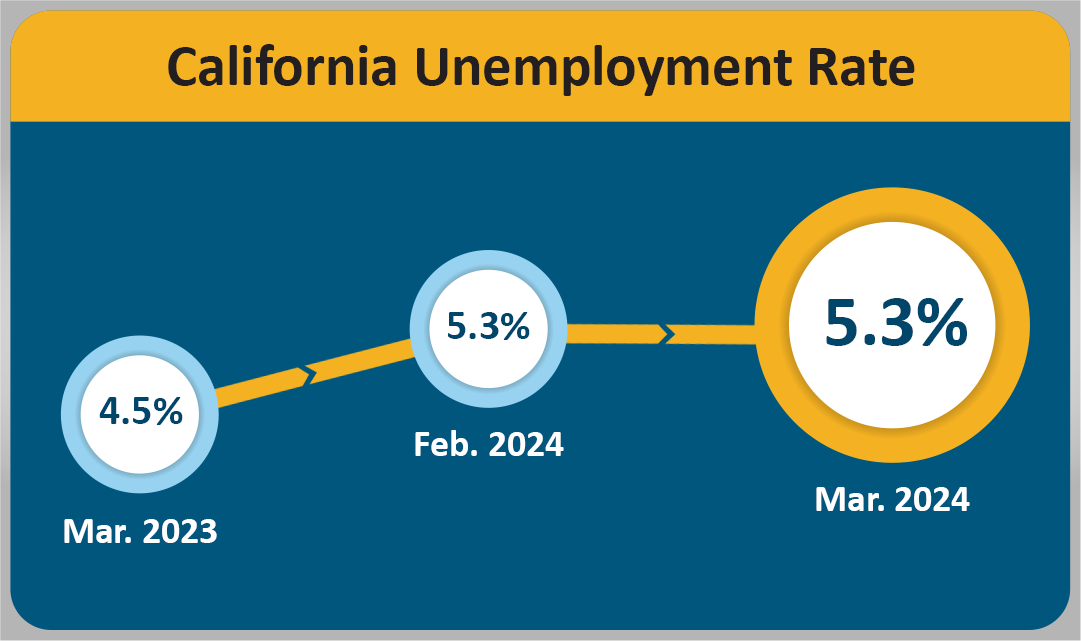
Unemployment Rate Holds Steady at 5.3 Percent
IMPORTANT NOTE: The employment data for the month of March 2024 is taken from the survey week including Mar. 12. Data for April is scheduled for release on May 17, 2024.
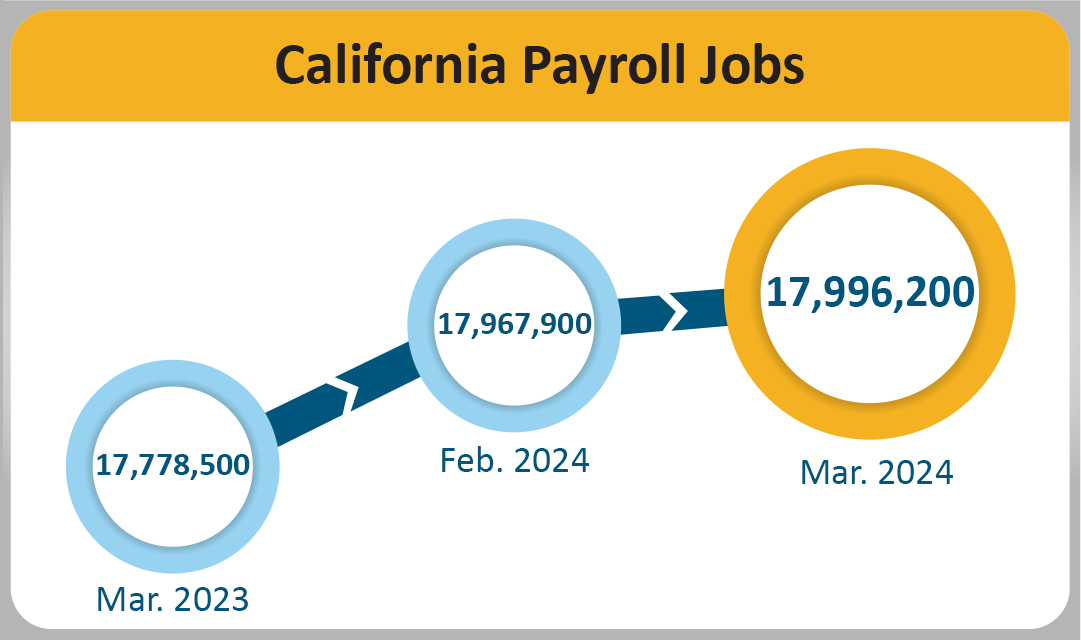
SACRAMENTO – California’s employers added 28,300 nonfarm payroll jobs1 in March 2024 and the unemployment rate held steady at 5.3 percent2, according to data released today by the Employment Development Department (EDD) from two surveys. Despite the mostly weather-related job loss of 6,600 in February (revised down by 3,200), March continued a job growth trend over the last eight months that totals 205,200 jobs – a monthly average increase of 25,700 jobs.
California's Labor Market, by the Numbers...
- The State’s job market expansion is now 47 months long. Since April 2020, California has gained 3,062,700 jobs, or about 65,200 per month on average.
- Seven of California's 11 industry sectors gained jobs in March with Private Education & Health Services (+13,600) posting the largest month-over gain for the third month in a row. This was due in part to payroll additions in Social Assistance, which saw noticeable growth with in-home support service workers.
- Construction bounced back after a weather-related decrease last month with a gain of 4,600 jobs. The industry is up 33,900 jobs over the year.
- Manufacturing (-5,300) experienced the largest month-over job reduction with losses in sectors including Machinery Manufacturing and Food Manufacturing.
- California’s latest unemployment rate is in line with the 5% average rate over five years leading into the pandemic – during one of the longest economic expansions in state history.
1. The unemployment rate comes from a separate federal survey of 5,100 California households.
2. The nonfarm payroll job numbers come from a federal survey of 80,000 California businesses.
Data Trends about Jobs in the Economy
Total Nonfarm Payroll Jobs
Total Nonfarm Payroll Jobs (Comes from a monthly survey of approximately 80,000 California businesses that estimates jobs in the economy – seasonally adjusted)
- Month-over – Total nonfarm jobs in California’s 11 major industries amounted to 17,996,200 in March – a net gain of 28,300 from February. This followed a downward revised (-3,200) month-over loss of 6,600 jobs in February.
- Year-over – Total nonfarm jobs increased by 217,700 (a 1.2 percent increase) from March 2023 to March 2024 compared to the U.S. annual gain of 2,927,000 jobs (a 1.9 percent increase).

| Major Industries | Month-over Change (February 2024–March 2024) | Year-over Change (March 2023–March 2024) | Total Payroll Jobs as of March 2024 |
|---|---|---|---|
|
Private Education and Health Services |
+13,600 | +181,700 | 3,226,400 |
|
Government |
+6,400 | +64,900 | 2,651,900 |
|
Professional and Business Services |
+5,100 | -17,100 | 2,781,000 |
|
Construction |
+4,600 | +33,900 | 929,800 |
|
Other Services |
+2,400 | +17,800 | 599,800 |
|
Trade, Transp., Utilities |
+2,000 | -12,000 | 3,098,800 |
|
Leisure and Hospitality |
+600 | +33,400 | 2,031,200 |
|
Financial Activities |
-100 | -13,800 | 804,800 |
|
Mining and Logging |
-300 | +500 | 19,800 |
|
Information |
-700 | -53,600 | 531,300 |
|
Manufacturing |
-5,300 | -18,000 | 1,321,400 |
Total de empleos agrícolas – Aunque el número de empleos en la industria agrícola disminuyó 2,000 desde febrero para alcanzar un total de 423,000 empleos en marzo, esta industria cuenta con 31,300 empleos de campo más en marzo de 2024 que en marzo del año pasado.
Tendencias de los datos sobre trabajadores en la economía
El empleo y desempleo en California (basado en una encuesta federal de 5,100 hogares de California, la cual se enfoca en trabajadores en la economía)
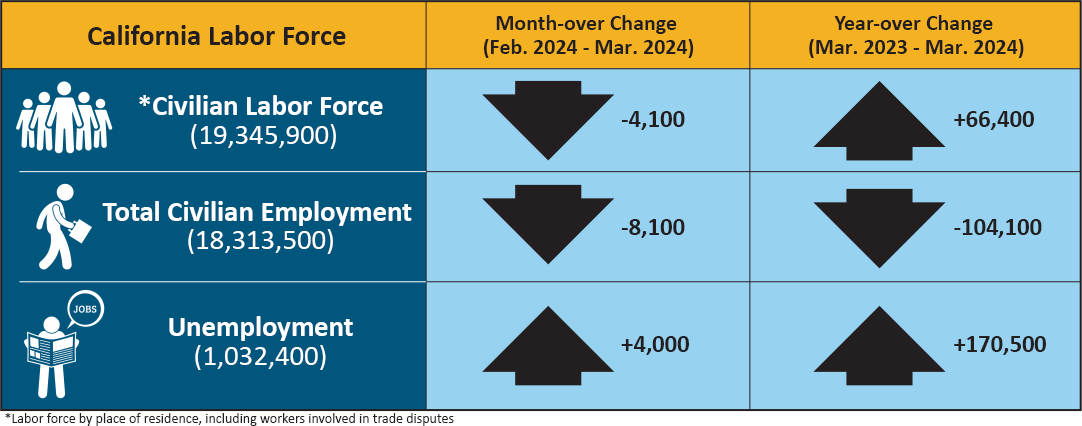
- Empleados – El número de californianos con empleo en marzo fue de 18,313,500, una disminución de 8,100 personas del total de 18,321,600 en febrero, y 104,100 menos que el total de empleos en marzo de 2023.
- Desempleados – El número de californianos sin empleo en marzo fue de 1,032,400, un aumento de 4,000 en todo el mes, y 170,500 más comparado con marzo de 2023.
| California Labor Force | Month-over Change (February 2024–March 2024) | Year-over Change (March 2023–March 2024) |
|---|---|---|
| * Civilian Labor Force (19,345,900) | -4,100 | +66,400 |
| Total Civilian Employment (18,313,500) | -8,100 | -104,100 |
| Unemployment (1,032,400) | +4,000 | +170,500 |
* Labor force by place of residence, including workers involved in trade disputes.
Solicitudes del Seguro de Desempleo (sin ajustes por temporada)
Los siguientes datos provienen de una semana muestra que incluye el 19 de cada mes:
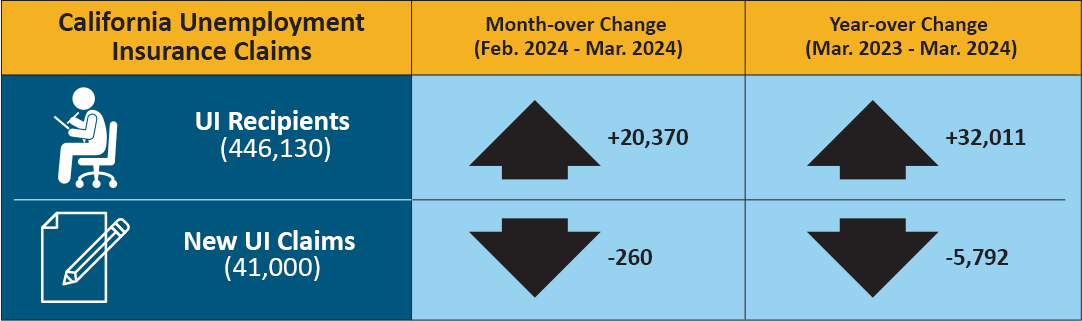
Se tramitaron un total de 41,000 solicitudes iniciales para desempleo durante la semana muestra de marzo de 2024, una disminución en todo el mes de 260 solicitudes desde febrero y una disminución en todo el año de 5,792 desde marzo de 2023. En datos relacionados que figuran en la tasa de desempleo del estado, 446,130 personas certificaron para los beneficios del Seguro de Desempleo (UI) durante la semana muestra de marzo de 2024. Esto en comparación con 425,760 personas que certificaron en febrero y 414,119 personas en marzo de 2023
| California Unemployment Insurance Claims | Month-over Change (February 2024–March 2024) | Year-over Change (March 2023–March 2024) |
|---|---|---|
| UI Recipients (446,130) | +20,370 | +32,011 |
| New UI Claims (41,000) | -260 | -5,792 |
| COUNTY | LABOR FORCE | EMPLOYMENT | UNEMPLOYMENT | RATE |
|---|---|---|---|---|
| STATE TOTAL | 19,409,300 | 18,372,600 | 1,036,700 | 5.3% |
| ALAMEDA | 828,200 | 789,800 | 38,400 | 4.6% |
| ALPINE | 640 | 600 | 40 | 6.0% |
| AMADOR | 14,730 | 13,900 | 830 | 5.6% |
| BUTTE | 93,700 | 87,700 | 6,000 | 6.4% |
| CALAVERAS | 22,310 | 21,160 | 1,150 | 5.2% |
| COLUSA | 11,030 | 8,920 | 2,120 | 19.2% |
| CONTRA COSTA | 553,200 | 527,200 | 26,000 | 4.7% |
| DEL NORTE | 9,320 | 8,740 | 590 | 6.3% |
| EL DORADO | 95,700 | 91,200 | 4,500 | 4.7% |
| FRESNO | 467,000 | 424,300 | 42,600 | 9.1% |
| GLENN | 12,770 | 11,800 | 970 | 7.6% |
| HUMBOLDT | 61,300 | 58,000 | 3,300 | 5.4% |
| IMPERIAL | 72,900 | 61,200 | 11,800 | 16.1% |
| INYO | 8,540 | 8,180 | 370 | 4.3% |
| KERN | 391,700 | 352,000 | 39,700 | 10.1% |
| KINGS | 59,700 | 53,700 | 6,000 | 10.0% |
| LAKE | 29,170 | 27,240 | 1,930 | 6.6% |
| LASSEN | 8,610 | 8,000 | 610 | 7.1% |
| LOS ANGELES | 5,029,800 | 4,767,300 | 262,500 | 5.2% |
| MADERA | 66,300 | 60,400 | 5,900 | 8.9% |
| MARIN | 133,300 | 128,400 | 4,900 | 3.7% |
| MARIPOSA | 7,420 | 6,940 | 470 | 6.4% |
| MENDOCINO | 38,150 | 35,970 | 2,180 | 5.7% |
| MERCED | 121,700 | 107,700 | 14,100 | 11.5% |
| MODOC | 3,220 | 2,940 | 290 | 8.9% |
| MONO | 9,370 | 8,990 | 380 | 4.0% |
| MONTEREY | 215,300 | 192,800 | 22,500 | 10.5% |
| NAPA | 72,600 | 69,600 | 3,000 | 4.2% |
| NEVADA | 49,730 | 47,470 | 2,260 | 4.5% |
| ORANGE | 1,599,900 | 1,537,100 | 62,800 | 3.9% |
| PLACER | 198,100 | 189,600 | 8,500 | 4.3% |
| PLUMAS | 7,300 | 6,450 | 850 | 11.6% |
| RIVERSIDE | 1,164,300 | 1,104,200 | 60,100 | 5.2% |
| SACRAMENTO | 742,500 | 706,000 | 36,500 | 4.9% |
| SAN BENITO | 32,600 | 30,200 | 2,500 | 7.5% |
| SAN BERNARDINO | 1,018,800 | 967,100 | 51,700 | 5.1% |
| SAN DIEGO | 1,603,100 | 1,532,300 | 70,800 | 4.4% |
| SAN FRANCISCO | 559,400 | 538,800 | 20,600 | 3.7% |
| SAN JOAQUIN | 350,100 | 325,100 | 25,000 | 7.1% |
| SAN LUIS OBISPO | 137,200 | 131,800 | 5,400 | 4.0% |
| SAN MATEO | 442,900 | 427,600 | 15,300 | 3.5% |
| SANTA BARBARA | 218,900 | 207,900 | 11,100 | 5.1% |
| SANTA CLARA | 1,037,600 | 995,400 | 42,200 | 4.1% |
| SANTA CRUZ | 133,800 | 123,800 | 10,000 | 7.4% |
| SHASTA | 75,100 | 70,400 | 4,700 | 6.3% |
| SIERRA | 1,330 | 1,230 | 100 | 7.5% |
| SISKIYOU | 16,660 | 15,280 | 1,380 | 8.3% |
| SOLANO | 205,300 | 194,400 | 10,900 | 5.3% |
| SONOMA | 251,200 | 240,800 | 10,400 | 4.2% |
| STANISLAUS | 250,300 | 231,700 | 18,600 | 7.4% |
| SUTTER | 47,800 | 43,100 | 4,700 | 9.8% |
| TEHAMA | 26,450 | 24,630 | 1,820 | 6.9% |
| TRINITY | 4,620 | 4,290 | 330 | 7.1% |
| TULARE | 213,700 | 188,100 | 25,500 | 12.0% |
| TUOLUMNE | 20,360 | 19,200 | 1,170 | 5.7% |
| VENTURA | 417,900 | 398,600 | 19,300 | 4.6% |
| YOLO | 111,800 | 105,300 | 6,500 | 5.8% |
| YUBA | 32,900 | 30,200 | 2,700 | 8.1% |