NR No. 24-10
Contact: Loree Levy/Aubrey Henry
916-654-9029
mediainquiries@edd.ca.gov
Important Note: The employment data for the month of January 2024 is taken from the survey week including January 12. Data for February is scheduled for release on March 22, 2024. These statistics reflect updates to initial 2023 monthly estimates as part of EDD’s annual benchmark revision process.
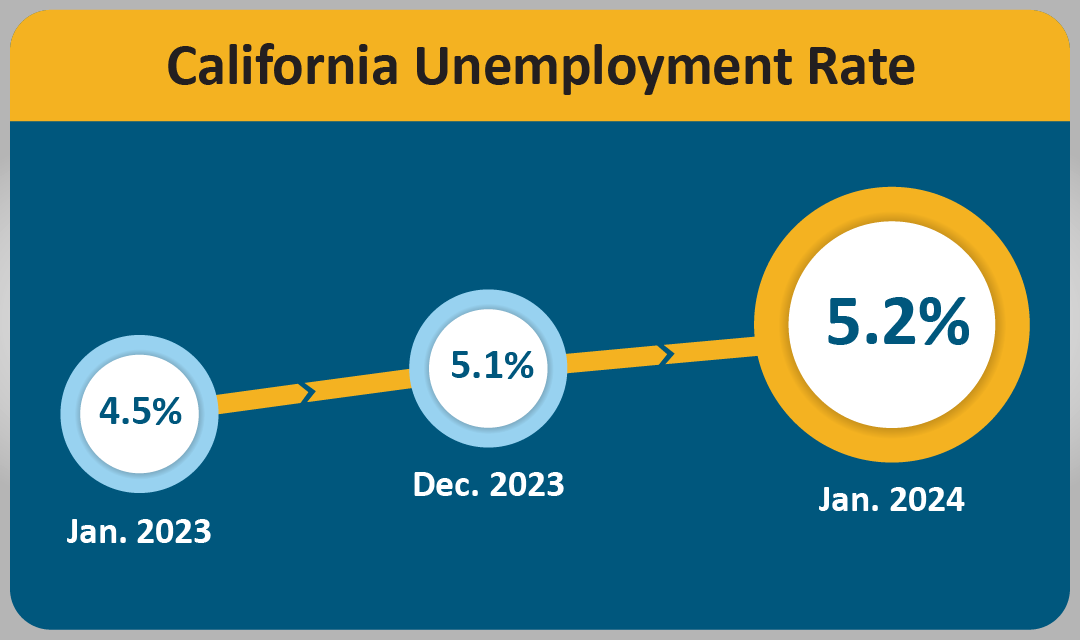
California’s unemployment rate slightly increases
SACRAMENTO – California’s employers added 58,100 nonfarm payroll jobs in January 2024 while the State’s unemployment rate increased to 5.2 percent1 in January 2024 from 5.1% in December, according to data released today by the Employment Development Department (EDD) from two surveys.
California's Labor Market, by the Numbers...
- California’s job market expansion turned 45 months old in January with the month’s job growth accounting for 16.5 percent of the nation’s 353,000 overall job gain.
- Ten of California's 11 industry sectors gained jobs in January with Private Education & Health Services (+18,100) topping the gains thanks to strength in Nursing Care Facilities and Individual and Family Services.
- Professional & Business Services (+15,700) also showed strong month-over growth thanks in part to gains in Specialized Design Services, Investigation and Security Services, and Services to Buildings and Dwellings.
- Manufacturing (-800) was the only industry sector to lose jobs within the State for January 2024. This was due, in part, to above-average losses in the Semiconductor and Other Electronic Component Manufacturing industry group.
- As part of annual revisions to prior estimates that factor in more comprehensive employment data that becomes available, job growth was slower than estimated in the year following August 2022 with gains picking up over the last several months. Revisions reflect some lingering impacts of the unprecedented pandemic that are still working their way out of estimation models.
1. The unemployment rate comes from a separate federal survey of 5,100 California households.
2. The nonfarm payroll job numbers come from a federal survey of 80,000 California businesses.
Data Trends about Jobs in the Economy
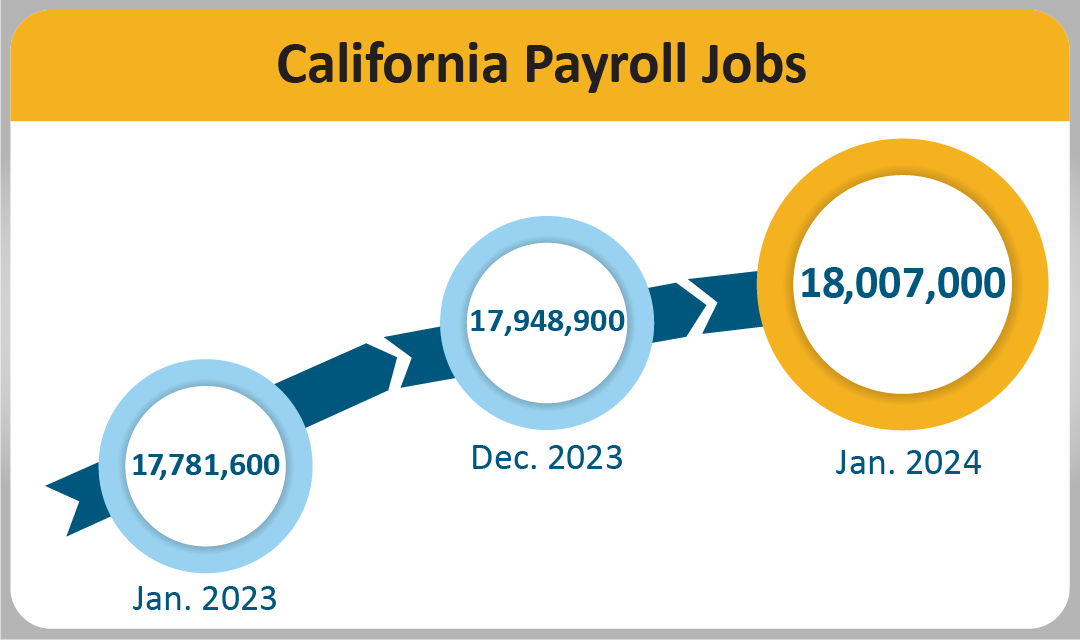
Total Nonfarm Payroll Jobs (Comes from a monthly survey of approximately 80,000 California businesses that estimates jobs in the economy – seasonally adjusted)
- Month-over – Total nonfarm jobs in California’s 11 major industries totaled, 18,007,000 in January – a net gain of 58,100 from December. This followed a downward revised (-231,800) month-over gain of 41,500 jobs in December.
- Year-over – Total nonfarm jobs increased by 225,400 (a 1.3 percent increase) from January 2023 to January 2024 compared to the U.S. annual gain of 2,927,000 jobs (a 1.9 percent increase).
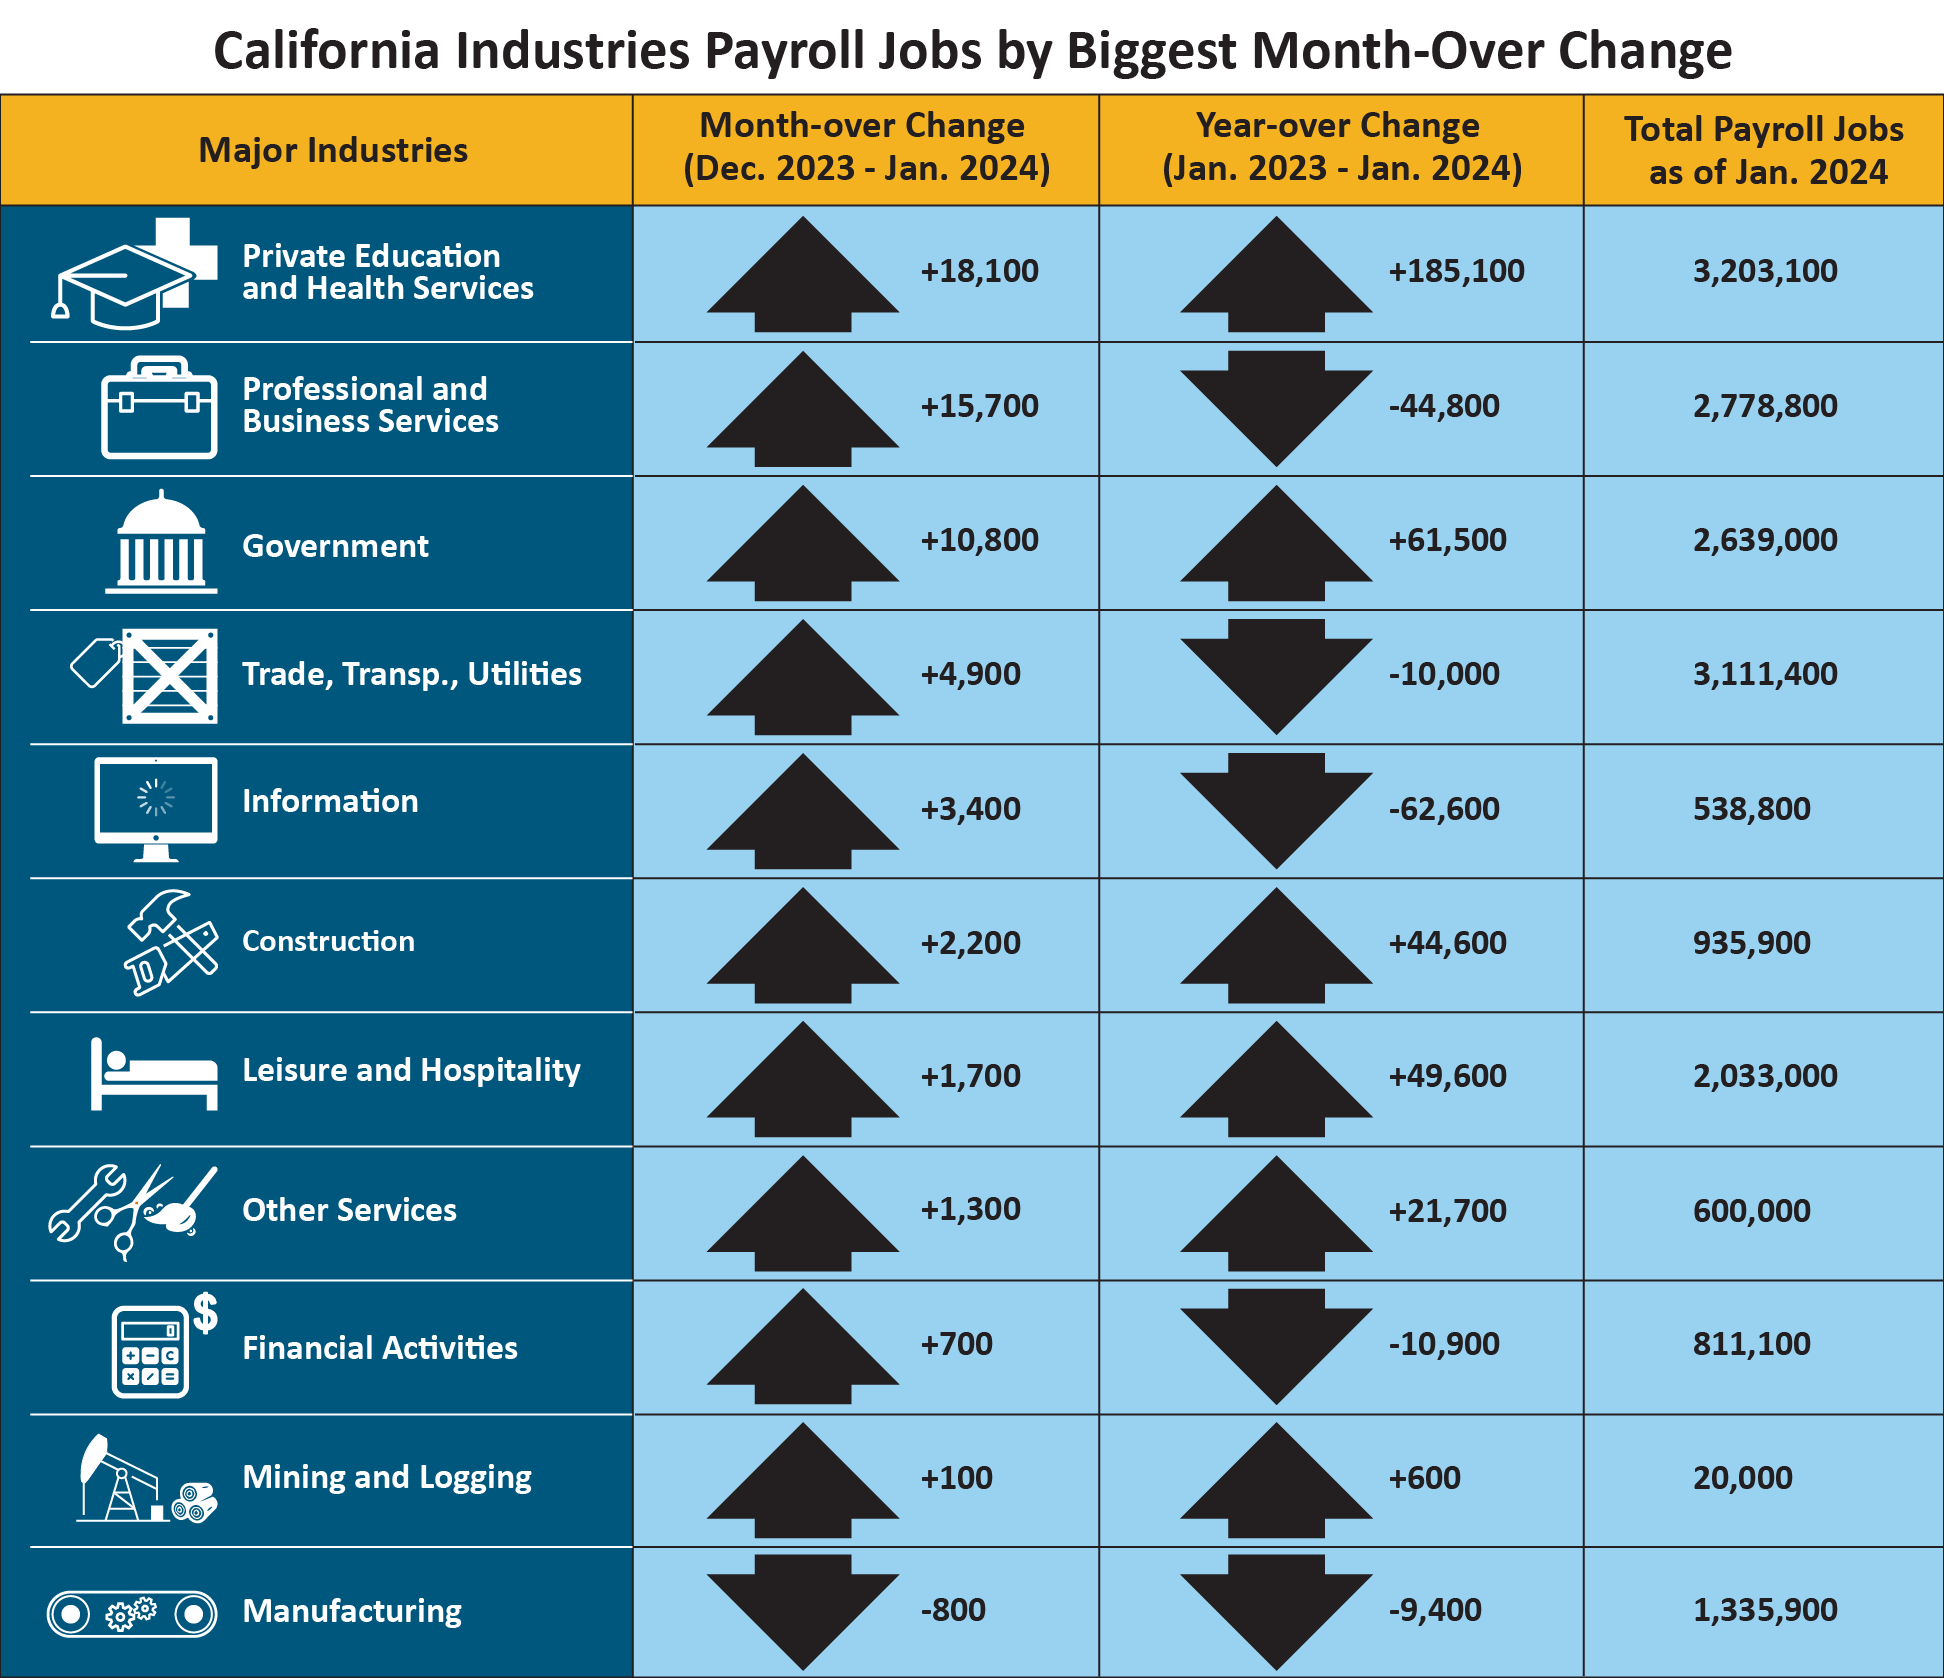
| Major Industries | Month-over Change (December 2023–January 2024) | Year-over Change (January 2023–January 2024) | Total Payroll Jobs as of January 2024 |
|---|---|---|---|
|
Private Education and Health Services |
+18,100 | +185,100 | 3,203,100 |
|
Professional and Business Services |
+15,700 | -44,800 | 2,778,800 |
| Government | +10,800 | +61,500 | 2,639,000 |
|
Trade, Transp., Utilities |
+4,900 | -10,000 | 3,111,400 |
|
Information |
+3,400 | -62,600 | 538,800 |
| Construction | +2,200 | +44,600 | 935,900 |
|
Leisure and Hospitality |
+1,700 | +49,600 | 2,033,000 |
|
Other Services |
+1,300 | +21,700 | 600,000 |
|
Financial Activities |
+700 | -10,900 | 811,100 |
|
Mining and Logging |
+100 | +600 | 20,000 |
|
Manufacturing |
-800 | -9,400 | 1,335,900 |
Total de empleos agrícolas – El número de empleos en la industria agrícola disminuyó 21,300 desde diciembre para alcanzar un total de 427,100 empleos en enero. La industria agrícola cuenta con 36,300 empleos de campo más en enero de 2024 que en enero del año pasado.
Tendencias de los datos sobre trabajadores en la economía
El empleo y desempleo en California (basado en una encuesta federal de 5,100 hogares de California, la cual se enfoca en trabajadores en la economía)
- Empleados – El número de californianos con empleo en enero fue de 18,343,900, una disminución de 8,000 personas del total de 18,351,900 en diciembre, y 48,900 menos que el total de empleos en enero de 2023.
- Desempleados – El número de californianos sin empleo en enero fue de 1,013,600, un aumento de 23,300 en todo el mes, y 155,800 más comparado con enero de 2023.
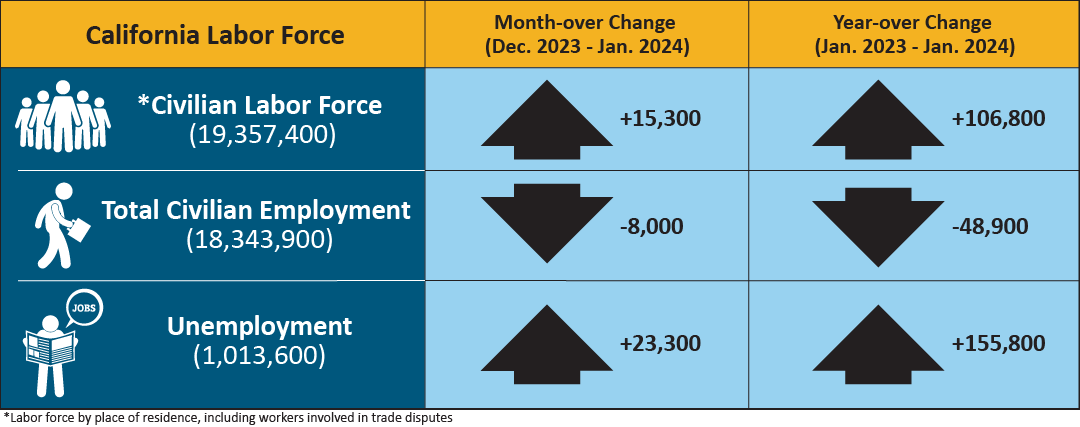
| California Labor Force | Month-over Change (December 2023–January 2024) | Year-over Change (January 2023-January 2024) |
|---|---|---|
| * Civilian Labor Force (19,357,400) | +15,300 | +106,800 |
| Total Civilian Employment (18,343,900) | -8,000 | -48,900 |
| Unemployment (1,013,600) | +23,300 | +155,800 |
* Labor force by place of residence, including workers involved in trade disputes.
Solicitudes del Seguro de Desempleo (sin ajustes por temporada)
Los siguientes datos provienen de una semana muestra que incluye el 19 de cada mes:
En datos relacionados que figuran en la tasa de desempleo del estado, 323,975 personas certificaron para los beneficios del Seguro de Desempleo durante la semana muestra de enero de 2024. Esto en comparación con 376,872 personas que certificaron en diciembre y 368,865 personas en enero de 2024. Al mismo tiempo, se tramitaron 47,196 solicitudes iniciales en la semana muestra de enero de 2024, una disminución en todo el mes de 1,354 solicitudes desde diciembre, y una disminución en todo el año de 954 solicitudes desde enero de 2023.
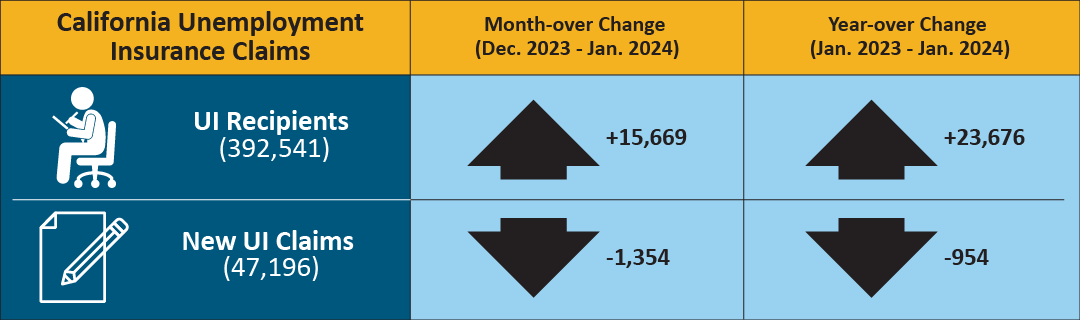
| California Unemployment Insurance Claims | Month-over Change (December 2023–January 2024) | Year-over Change (January 2023-January 2024) |
|---|---|---|
| UI Recipients (392,541) | +15,669 | +26,676 |
| New UI Claims (47,196) | -1,354 | -954 |
| COUNTY | LABOR FORCE | EMPLOYMENT | UNEMPLOYMENT | RATE |
|---|---|---|---|---|
| STATE TOTAL | 19,344,200 | 18,239,000 | 1,105,200 | 5.7% |
| ALAMEDA | 825,700 | 784,500 | 41,200 | 5.0% |
| ALPINE | 650 | 610 | 40 | 6.6% |
| AMADOR | 14,380 | 13,480 | 890 | 6.2% |
| BUTTE | 92,900 | 86,700 | 6,100 | 6.6% |
| CALAVERAS | 21,960 | 20,780 | 1,180 | 5.4% |
| COLUSA | 10,570 | 8,530 | 2,040 | 19.3% |
| CONTRA COSTA | 550,700 | 523,000 | 27,700 | 5.0% |
| DEL NORTE | 9,250 | 8,580 | 660 | 7.2% |
| EL DORADO | 94,700 | 90,000 | 4,700 | 5.0% |
| FRESNO | 464,500 | 423,600 | 41,000 | 8.8% |
| GLENN | 12,520 | 11,510 | 1,010 | 8.0% |
| HUMBOLDT | 60,000 | 56,400 | 3,500 | 5.9% |
| IMPERIAL | 75,000 | 61,600 | 13,300 | 17.8% |
| INYO | 8,240 | 7,850 | 390 | 4.8% |
| KERN | 398,900 | 361,000 | 37,900 | 9.5% |
| KINGS | 59,800 | 53,900 | 5,900 | 9.9% |
| LAKE | 29,310 | 27,150 | 2,160 | 7.4% |
| LASSEN | 8,510 | 7,900 | 610 | 7.1% |
| LOS ANGELES | 5,018,800 | 4,722,100 | 296,600 | 5.9% |
| MADERA | 67,100 | 61,300 | 5,900 | 8.7% |
| MARIN | 132,300 | 126,900 | 5,400 | 4.1% |
| MARIPOSA | 7,400 | 6,890 | 520 | 7.0% |
| MENDOCINO | 37,270 | 34,980 | 2,290 | 6.1% |
| MERCED | 121,000 | 107,800 | 13,200 | 10.9% |
| MODOC | 3,190 | 2,860 | 320 | 10.2% |
| MONO | 9,730 | 9,320 | 420 | 4.3% |
| MONTEREY | 210,300 | 188,200 | 22,100 | 10.5% |
| NAPA | 71,800 | 68,400 | 3,300 | 4.6% |
| NEVADA | 49,780 | 47,410 | 2,370 | 4.8% |
| ORANGE | 1,590,900 | 1,523,900 | 66,900 | 4.2% |
| PLACER | 196,400 | 187,600 | 8,900 | 4.5% |
| PLUMAS | 7,060 | 6,280 | 780 | 11.0% |
| RIVERSIDE | 1,164,200 | 1,099,800 | 64,300 | 5.5% |
| SACRAMENTO | 737,800 | 698,800 | 39,000 | 5.3% |
| SAN BENITO | 32,200 | 29,800 | 2,400 | 7.5% |
| SAN BERNARDINO | 1,018,900 | 964,000 | 54,900 | 5.4% |
| SAN DIEGO | 1,597,700 | 1,521,800 | 75,800 | 4.7% |
| SAN FRANCISCO | 561,000 | 538,700 | 22,400 | 4.0% |
| SAN JOAQUIN | 349,100 | 323,000 | 26,100 | 7.5% |
| SAN LUIS OBISPO | 135,000 | 129,200 | 5,700 | 4.2% |
| SAN MATEO | 443,400 | 427,000 | 16,400 | 3.7% |
| SANTA BARBARA | 214,100 | 202,100 | 12,000 | 5.6% |
| SANTA CLARA | 1,034,000 | 989,200 | 44,800 | 4.3% |
| SANTA CRUZ | 131,600 | 121,800 | 9,800 | 7.4% |
| SHASTA | 75,000 | 70,200 | 4,800 | 6.4% |
| SIERRA | 1,300 | 1,220 | 80 | 6.2% |
| SISKIYOU | 16,870 | 15,400 | 1,470 | 8.7% |
| SOLANO | 205,000 | 193,400 | 11,600 | 5.7% |
| SONOMA | 249,400 | 238,200 | 11,200 | 4.5% |
| STANISLAUS | 248,300 | 229,400 | 18,900 | 7.6% |
| SUTTER | 46,900 | 42,300 | 4,600 | 9.8% |
| TEHAMA | 26,240 | 24,400 | 1,830 | 7.0% |
| TRINITY | 4,510 | 4,170 | 340 | 7.5% |
| TULARE | 214,400 | 189,100 | 25,400 | 11.8% |
| TUOLUMNE | 19,970 | 18,740 | 1,230 | 6.2% |
| VENTURA | 413,600 | 392,200 | 21,400 | 5.2% |
| YOLO | 110,700 | 104,000 | 6,700 | 6.1% |
| YUBA | 32,500 | 29,800 | 2,700 | 8.3% |