NR No. 24-11
Contact: Loree Levy/Aubrey Henry
916-654-9029
mediainquiries@edd.ca.gov
IMPORTANT NOTE:The employment data for the month of February 2024 is taken from the survey week including Feb. 12. Data for March is scheduled for release on April 19, 2024.
Employers lost 3,400 nonfarm payroll jobs
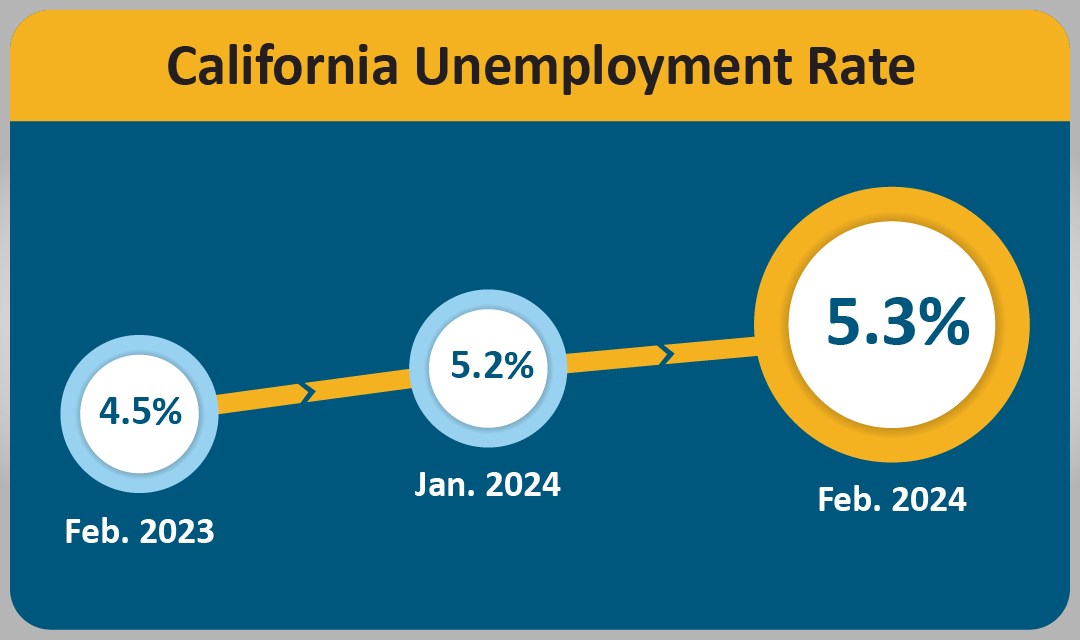
SACRAMENTO – California’s unemployment rate increased to 5.3 percent1 in February 2024, up from 5.2 percent in January, with a loss of 3,400 nonfarm payroll jobs2. Also, the State’s January nonfarm jobs estimate was revised down by 32,500 jobs to a total gain of 25,600 for that month. This is according to data released today by the Employment Development Department (EDD) from two surveys.
California's Labor Market, by the Numbers...
- The State's jobs market expansion turned 46 months old in February 2024. California has gained 3,037,600 jobs since the pre-pandemic peak in February 2020, which averages out to 66,035 per month.
- California's downward-revised January 2024 nonfarm jobs total mirrors the nation, which also saw a large downward revision of approximately 124,000 jobs. The U.S. unemployment rate rose 0.2 percent to 3.9 percent, the highest since January 2022.
- Four of California's 11 industry sectors gained jobs in February with Private Education & Health Services (+15,400) once again having the largest month-over gain thanks to strength in Other Health Practitioners (such as acupuncturists and dieticians) as well as Home Healthcare Services and Individual and Family Services.
- Noticeable month-over losses were seen in Construction (-9,600) thanks to employment reductions in several industry subsectors due, in part, to disruptions from the multiple “atmospheric river” storms that hit the state throughout the month.
- Trade, Transportation, and Utilities (-7,300) also saw a dip. Declines in sub-sectors like Machinery, Equipment and Supplies Merchant Wholesalers contributed as the nation overall saw lower consumer discretionary spending and demand.
1. The unemployment rate comes from a separate federal survey of 5,100 California households.
2. The nonfarm payroll job numbers come from a federal survey of 80,000 California businesses.
Data Trends about Jobs in the Economy
Total Nonfarm Payroll Jobs (Comes from a monthly survey of approximately 80,000 California businesses that estimates jobs in the economy – seasonally adjusted)
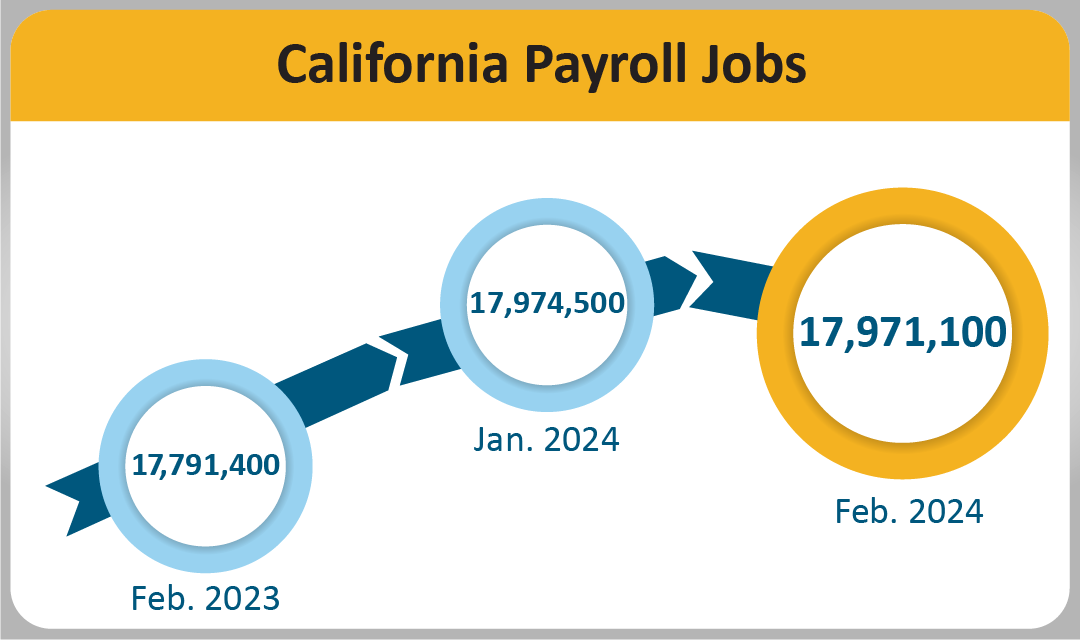
- Month-over – Total nonfarm jobs in California’s 11 major industries amounted to 17,971,100 in February – a net loss of 3,400 from January. This followed a downward revised (-32,500) month-over gain of 25,600 jobs in January.
- Year-over – Total nonfarm jobs increased by 179,700 (a 1.0 percent increase) from February 2023 to February 2024 compared to the U.S. annual gain of 2,748,000 jobs (a 1.8 percent increase).
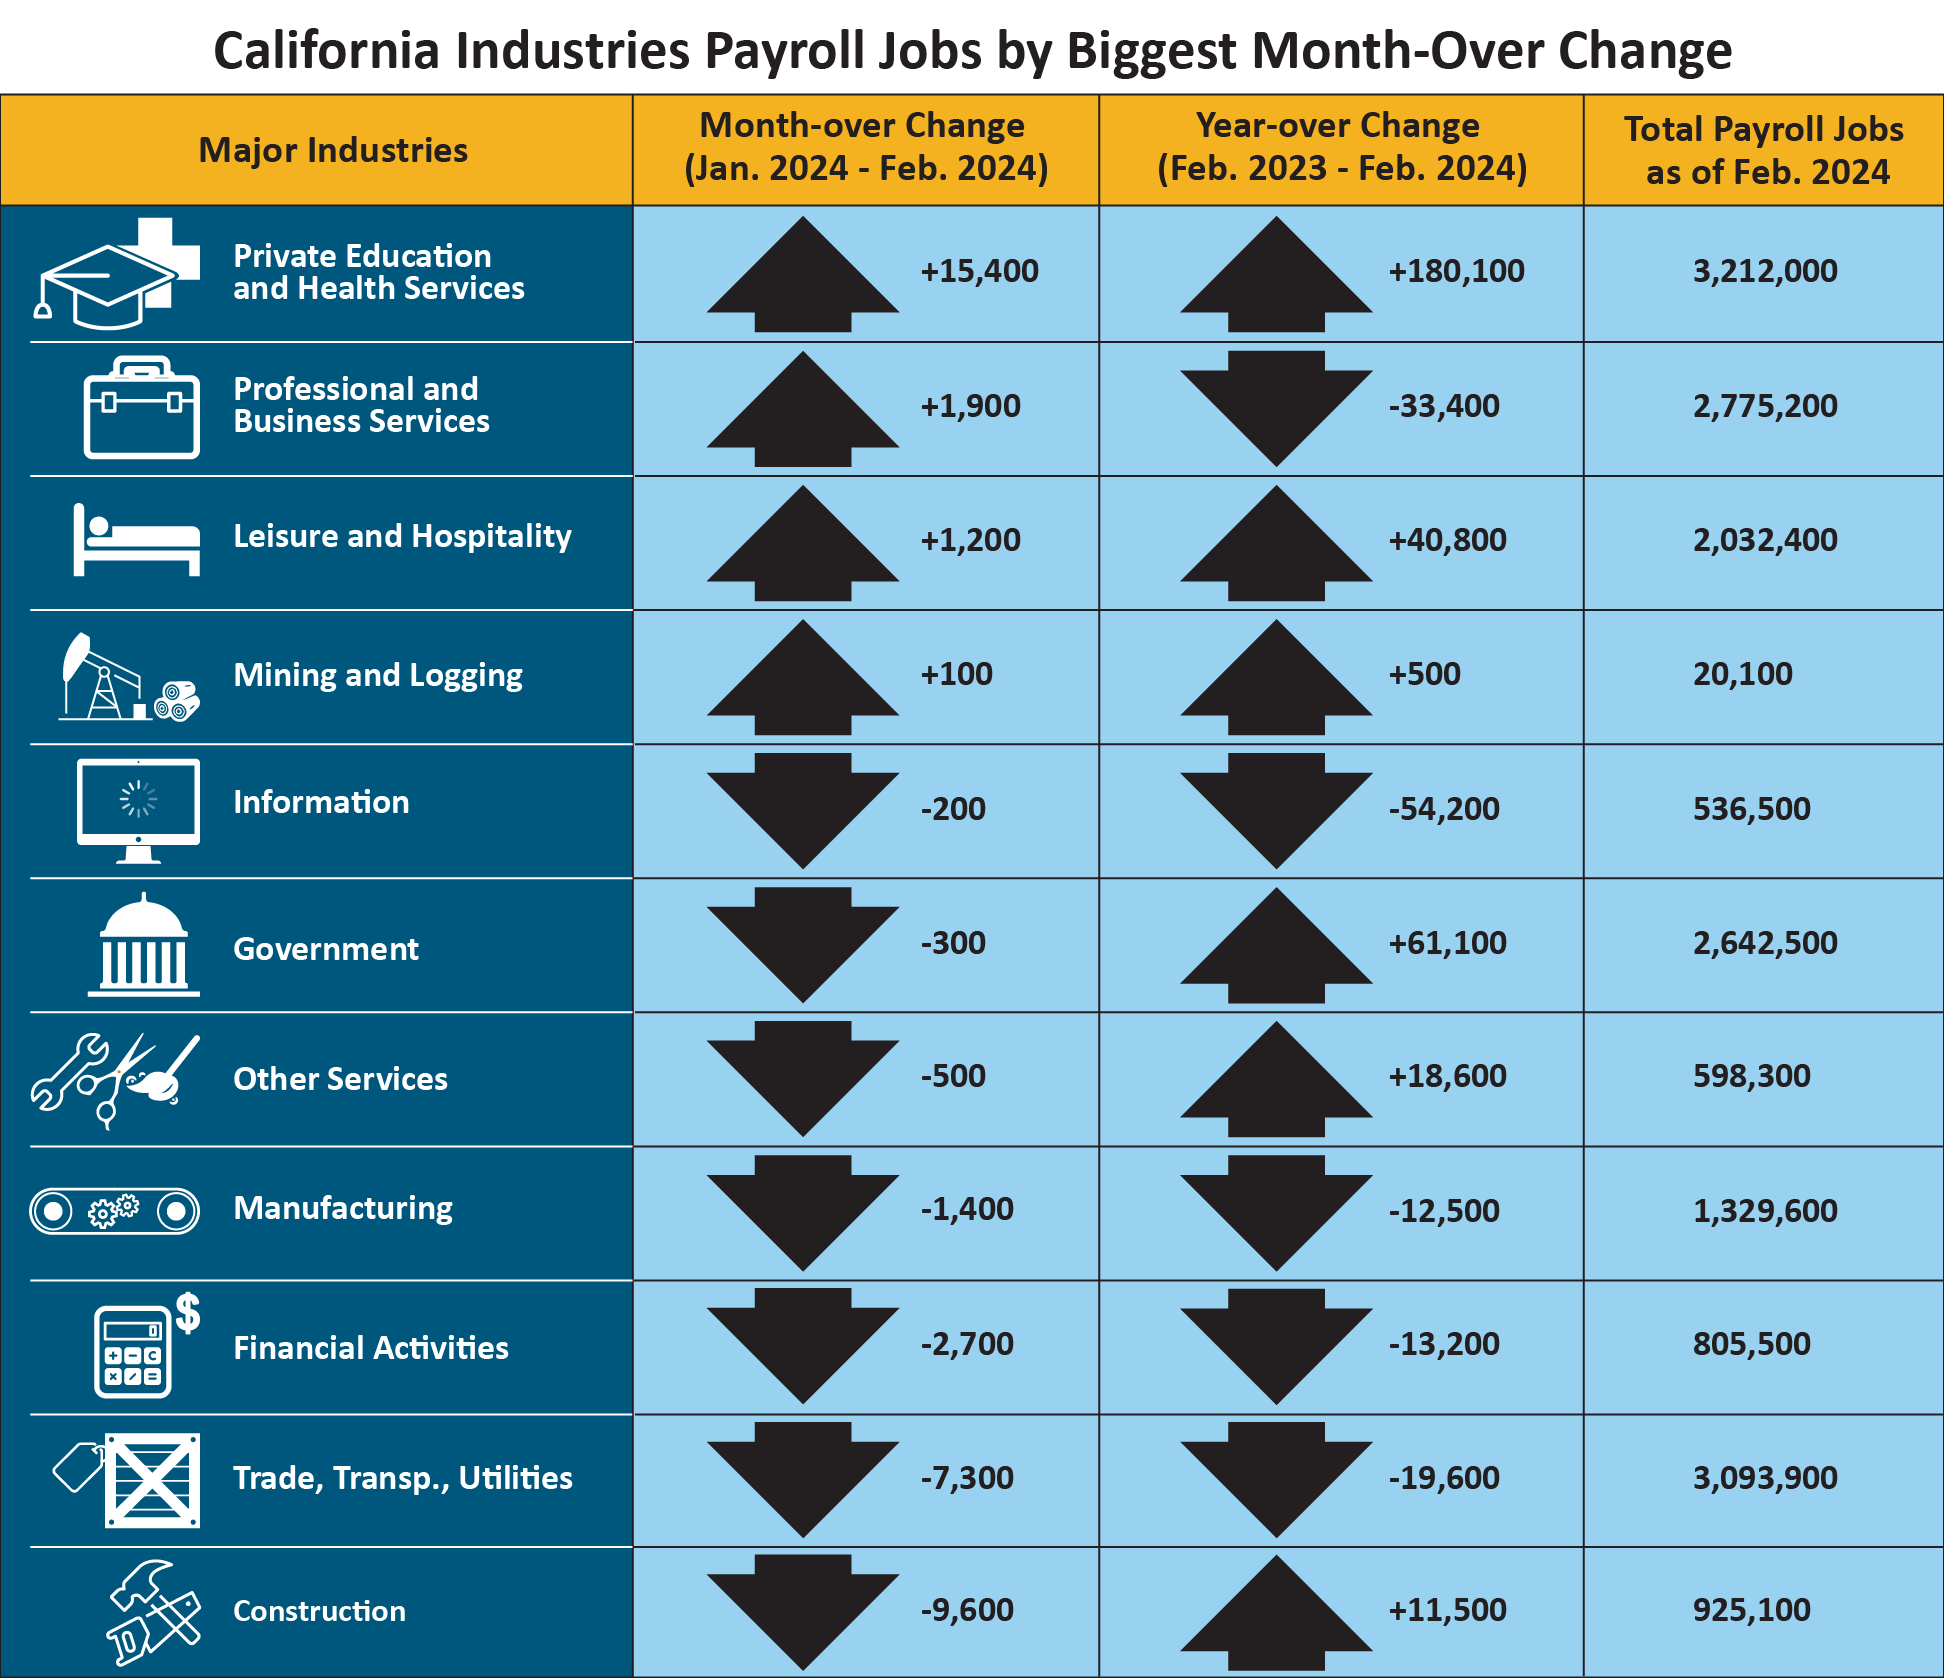
| Major Industries | Month-over Change (January 2024-February 2024) | Year-over Change (February 2023-February 2024 | Total Payroll Jobs as of February 2024 |
|---|---|---|---|
|
Private Education and Health Services |
+15,400 | +180,100 | 3,212,000 |
|
Professional and Business Services |
+1,900 | -33,400 | 2,775,200 |
| Leisure and Hospitality | +1,200 | +40,800 | 2,032,400 |
|
Mining and Logging |
+100 | +500 | 20,100 |
|
Information |
-200 | -54,200 | 536,500 |
|
Government |
-300 | +61,100 | 2,642,500 |
|
Other Services |
-500 | +18,600 | 598,300 |
|
Manufacturing |
-1,400 | -12,500 | 1,329,600 |
| Financial Activities | -2,700 | -13,200 | 805,500 |
|
Trade, Transp., Utilities |
-7,300 | -19,600 | 3,093,900 |
|
Construction |
-9,600 | +11,500 | 925,100 |
Total de empleos agrícolas – El número de empleos en la industria agrícola disminuyó 2,100 desde enero para alcanzar un total de 425,000 empleos en febrero. La industria agrícola cuenta con 26,100 empleos de campo más en febrero de 2024 que en febrero del año pasado.
Tendencias de los datos sobre trabajadores en la economía
El empleo y desempleo en California (basado en una encuesta federal de 5,100 hogares de California, la cual se enfoca en trabajadores en la economía)
- Employed – The number of Californians employed in February was 18,321,900, a decrease of 20,100 persons from January’s total of 18,342,000 and down 82,600 from the employment total in February 2023.
- Unemployed – The number of unemployed Californians was 1,027,000 in February, an increase of 13,100 over the month and up 165,400 in comparison to February 2023.
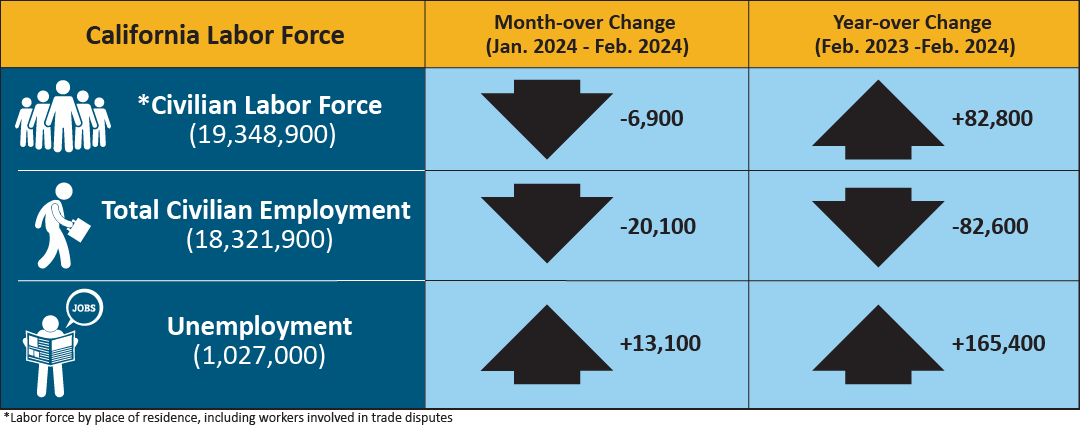
| California Labor Force | Month-over Change (January 2024-February 2024) | Year-over Change (February 2023-February 2024) |
|---|---|---|
| *Civilian Labor Force (19,348,900) | -6,900 | +82,800 |
| Total Civilian Employment (18,321,900) | -20,100 | -82,600 |
| Unemployment (1,027,000) | +13,100 | +165,400 |
*Labor force by place of residence, including workers involved in trade disputes.
Solicitudes del Seguro de Desempleo (sin ajustes por temporada)
Los siguientes datos provienen de una semana muestra que incluye el 19 de cada mes:
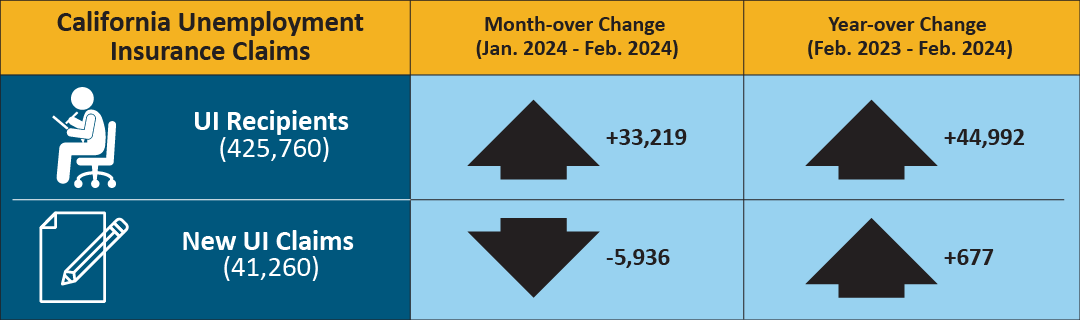
En datos relacionados que figuran en la tasa de desempleo del estado, 425,760 personas certificaron para los beneficios del Seguro de Desempleo (UI) durante la semana muestra de febrero de 2024. Esto en comparación con 392,541 personas que certificaron en enero y 380,768 personas en febrero de 2023. Al mismo tiempo, se tramitaron 41,260 solicitudes iniciales en la semana muestra de febrero de 2024, una disminución en todo el mes de 5,936 solicitudes desde enero, pero un aumento en todo el año de 677 solicitudes desde febrero de 2023.
| California Unemployment Insurance Claims | Month-over Change (January 2024-February 2024) | Year-over Change (February 2023-February 2024) |
|---|---|---|
| UI Recipients (425,760) | +33,219 | +44,992 |
| New UI Claims (41,260) | -5,936 | +677 |
| COUNTY | LABOR FORCE | EMPLOYMENT | UNEMPLOYMENT | RATE |
|---|---|---|---|---|
| STATE TOTAL | 19,394,300 | 18,316,000 | 1,078,300 | 5.6% |
| ALAMEDA | 826,100 | 785,500 | 40,600 | 4.9% |
| ALPINE | 650 | 610 | 40 | 6.2% |
| AMADOR | 14,650 | 13,750 | 900 | 6.1% |
| BUTTE | 93,600 | 87,200 | 6,400 | 6.8% |
| CALAVERAS | 22,260 | 21,030 | 1,230 | 5.5% |
| COLUSA | 11,170 | 8,880 | 2,280 | 20.4% |
| CONTRA COSTA | 552,100 | 524,300 | 27,800 | 5.0% |
| DEL NORTE | 9,240 | 8,630 | 610 | 6.6% |
| EL DORADO | 95,600 | 90,800 | 4,800 | 5.0% |
| FRESNO | 469,400 | 424,700 | 44,600 | 9.5% |
| GLENN | 12,740 | 11,710 | 1,030 | 8.1% |
| HUMBOLDT | 61,100 | 57,500 | 3,600 | 5.9% |
| IMPERIAL | 74,400 | 61,600 | 12,800 | 17.2% |
| INYO | 8,500 | 8,110 | 390 | 4.6% |
| KERN | 400,800 | 359,800 | 41,000 | 10.2% |
| KINGS | 60,200 | 53,900 | 6,300 | 10.5% |
| LAKE | 29,700 | 27,620 | 2,090 | 7.0% |
| LASSEN | 8,600 | 7,930 | 670 | 7.8% |
| LOS ANGELES | 5,014,600 | 4,761,700 | 252,900 | 5.0% |
| MADERA | 67,800 | 61,700 | 6,100 | 9.0% |
| MARIN | 133,300 | 128,000 | 5,300 | 4.0% |
| MARIPOSA | 7,520 | 7,010 | 520 | 6.9% |
| MENDOCINO | 37,990 | 35,640 | 2,340 | 6.2% |
| MERCED | 121,900 | 107,300 | 14,500 | 11.9% |
| MODOC | 3,200 | 2,880 | 320 | 10.1% |
| MONO | 9,840 | 9,440 | 400 | 4.1% |
| MONTEREY | 215,900 | 191,300 | 24,600 | 11.4% |
| NAPA | 72,500 | 69,300 | 3,200 | 4.5% |
| NEVADA | 50,160 | 47,770 | 2,390 | 4.8% |
| ORANGE | 1,597,400 | 1,530,100 | 67,200 | 4.2% |
| PLACER | 197,900 | 188,900 | 9,100 | 4.6% |
| PLUMAS | 7,330 | 6,440 | 890 | 12.2% |
| RIVERSIDE | 1,165,200 | 1,100,200 | 65,000 | 5.6% |
| SACRAMENTO | 742,100 | 703,000 | 39,100 | 5.3% |
| SAN BENITO | 32,400 | 29,800 | 2,600 | 7.9% |
| SAN BERNARDINO | 1,018,900 | 963,400 | 55,500 | 5.4% |
| SAN DIEGO | 1,602,200 | 1,526,100 | 76,100 | 4.7% |
| SAN FRANCISCO | 558,100 | 536,700 | 21,400 | 3.8% |
| SAN JOAQUIN | 351,000 | 324,400 | 26,600 | 7.6% |
| SAN LUIS OBISPO | 136,900 | 131,000 | 5,900 | 4.3% |
| SAN MATEO | 442,200 | 425,900 | 16,300 | 3.7% |
| SANTA BARBARA | 216,800 | 204,300 | 12,400 | 5.7% |
| SANTA CLARA | 1,034,000 | 989,300 | 44,700 | 4.3% |
| SANTA CRUZ | 133,300 | 122,600 | 10,600 | 8.0% |
| SHASTA | 75,100 | 69,900 | 5,200 | 6.9% |
| SIERRA | 1,320 | 1,230 | 100 | 7.3% |
| SISKIYOU | 17,060 | 15,550 | 1,510 | 8.9% |
| SOLANO | 205,400 | 193,700 | 11,700 | 5.7% |
| SONOMA | 250,800 | 239,700 | 11,100 | 4.4% |
| STANISLAUS | 248,500 | 229,100 | 19,400 | 7.8% |
| SUTTER | 47,500 | 42,600 | 4,800 | 10.2% |
| TEHAMA | 26,430 | 24,500 | 1,940 | 7.3% |
| TRINITY | 4,600 | 4,250 | 360 | 7.7% |
| TULARE | 216,800 | 190,100 | 26,800 | 12.3% |
| TUOLUMNE | 20,290 | 19,010 | 1,280 | 6.3% |
| VENTURA | 414,800 | 393,800 | 21,000 | 5.1% |
| YOLO | 111,700 | 104,700 | 7,000 | 6.3% |
| YUBA | 32,800 | 29,900 | 2,800 | 8.6% |