NR No. 24-18
Contact: Loree Levy/Aubrey Henry
916-654-9029
mediainquiries@edd.ca.gov
Important Note: The employment data for the month of April 2024 is taken from the survey week including April 12. Data for May is scheduled for release on June 21, 2024.
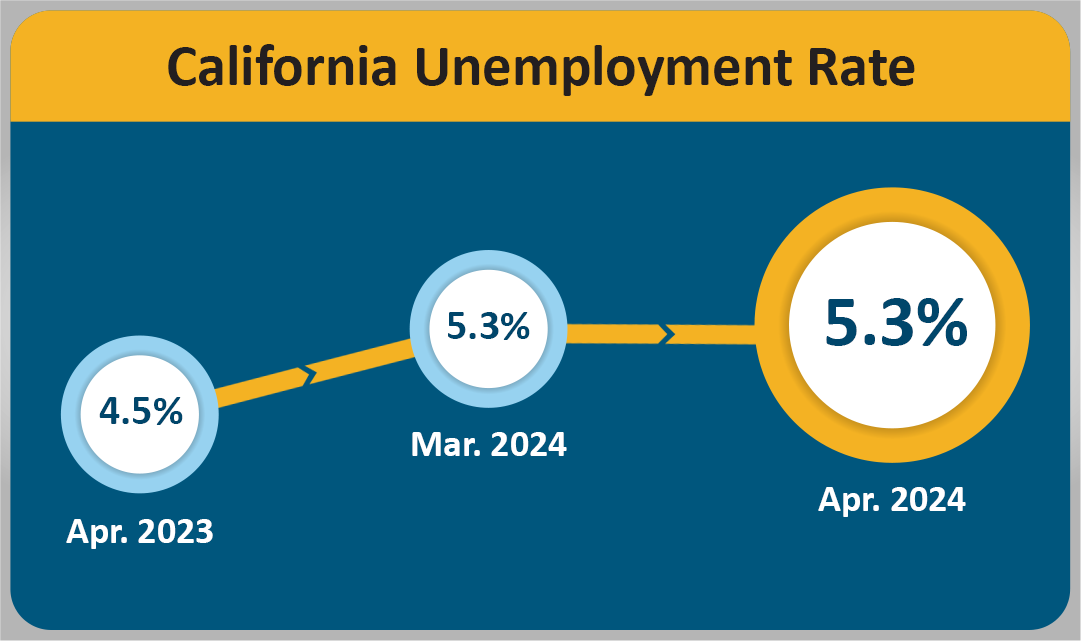
Unemployment Rate Remains Unchanged for Third Consecutive Month
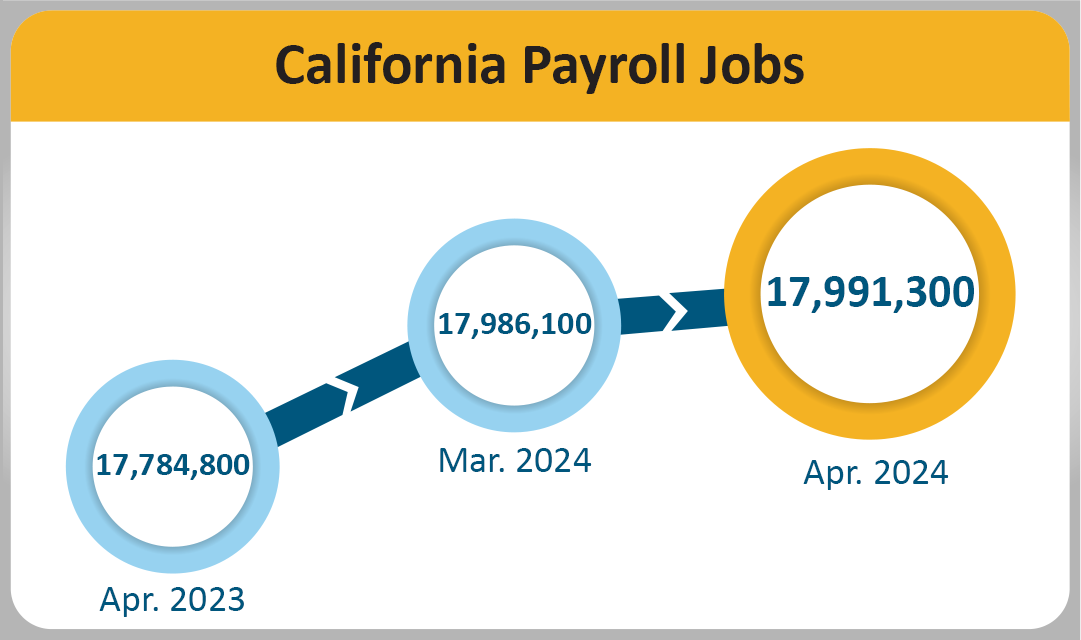
SACRAMENTO – California’s employers added 5,200 nonfarm payroll jobs1 in April 2024 and the unemployment rate remained unchanged for a third consecutive month holding steady at 5.3 percent2, according to data released by the Employment Development Department (EDD). April’s job gain follows a revised job gain of 18,200 for March 2024.
California's Labor Market, by the Numbers...
- The State’s jobs market expansion entered its 48th month in April 2024. Since April 2020, California has gained 3,057,800 jobs, which averages out to 63,704 per month.
- The state’s current job growth started in August 2023 and has amounted to a total gain of 200,300 jobs. This reflects a rebound from the slowdown during the prior 10 months as the state economy settled following its dramatic post-pandemic recovery.
- Five of California's 11 industry sectors gained jobs in April with Private Education & Health Services (+11,900) posting the largest month-over gain for the fourth consecutive month.
- Trade, Transportation, and Utilities (+5,100) also showed noticeable growth as above-average gains were seen in the Truck Transportation and the Couriers and Messengers industry groups.
- Construction (-6,000) saw a small reduction in jobs due to lingering stormy weather conditions affecting construction projects across the state. The industry remains up 15,100 jobs over the year.
1. The unemployment rate comes from a separate federal survey of 5,100 California households.
2. The nonfarm payroll job numbers come from a federal survey of 80,000 California businesses.
Data Trends about Jobs in the Economy
Total Nonfarm Payroll Jobs (Comes from a monthly survey of approximately 80,000 California businesses that estimates jobs in the economy – seasonally adjusted)
- Month-over – Total nonfarm jobs in California’s 11 major industries amounted to 17,991,300 in April – a net gain of 5,200 from March. This followed a downward revised (-10,100) month-over gain of 18,200 jobs in March.
- Year-over – Total nonfarm jobs increased by 206,500 (a 1.2 percent increase) from April 2023 to April 2024 compared to the U.S. annual gain of 2,802,000 jobs (a 1.8 percent increase)
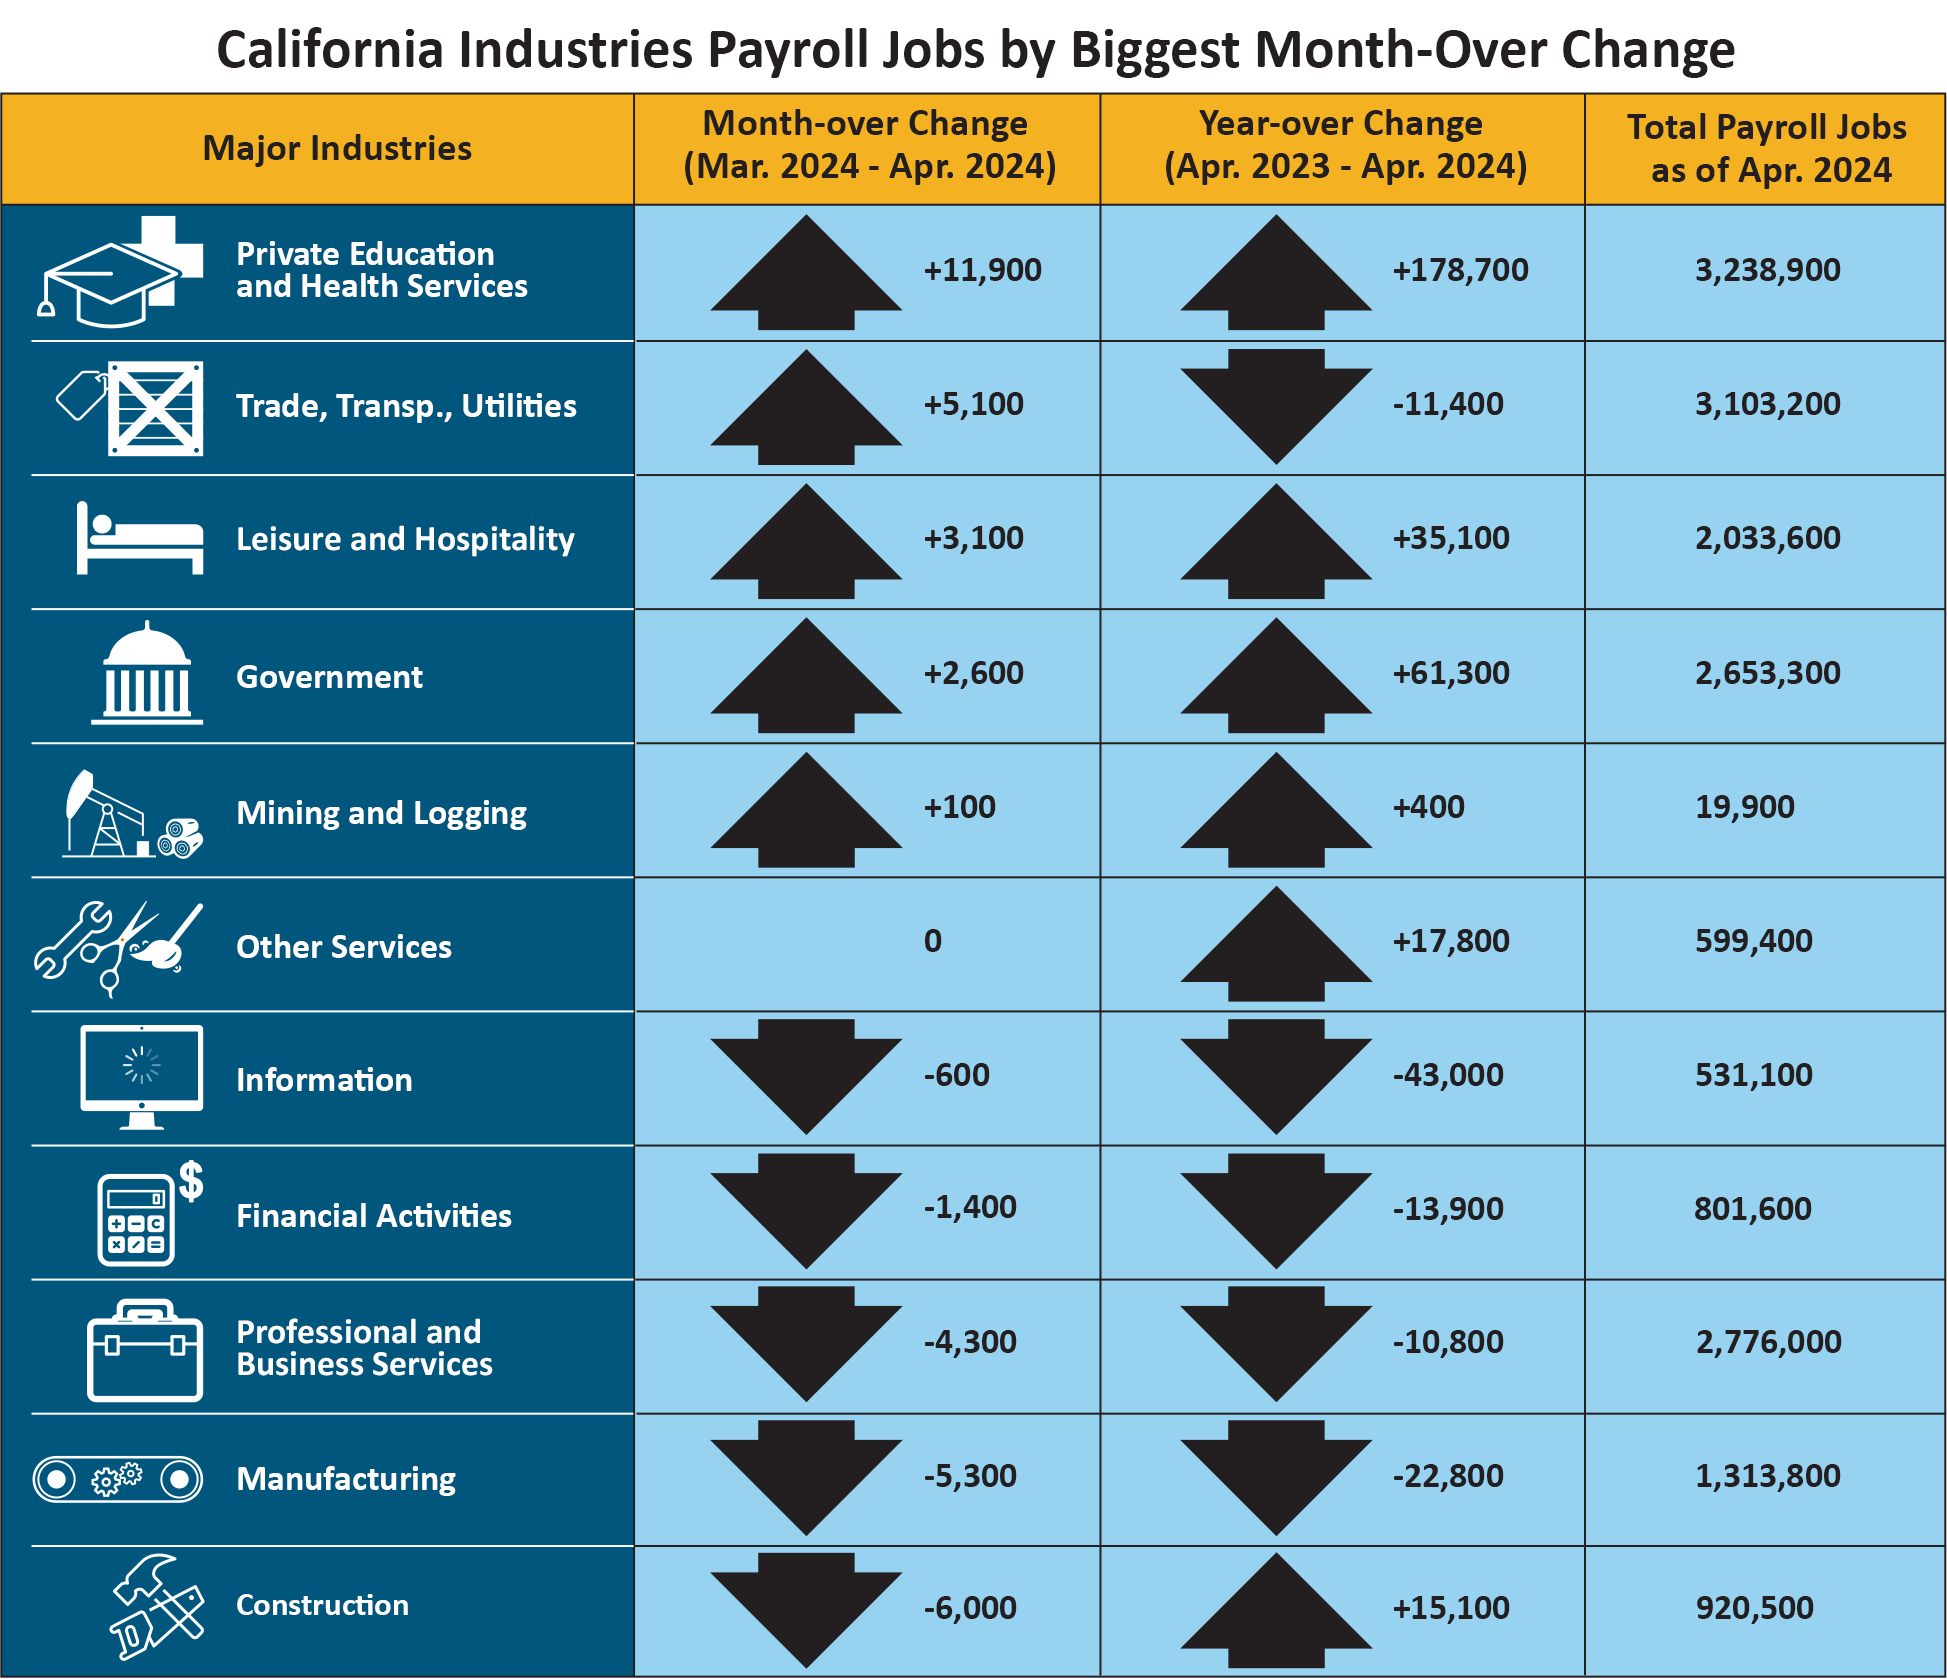
| Major Industries | Month-over Change (March 2024–April 2024) | Year-over Change (April 2023–April 2024) | Total Payroll Jobs as of April 2024 |
|---|---|---|---|
|
Private Education and Health Services |
+11,900 | +178,700 | 3,228,900 |
|
Trade, Transp., Utilities |
+5,100 | -11,400 | 3,103,200 |
|
Leisure and Hospitality |
+3,100 | -+35,100 | 2,033,600 |
|
Government |
+2,600 | +61,300 | 2,653,300 |
|
Other Services |
0 | +17,800 | 599,400 |
|
Information |
-600 | -43,000 | 531,100 |
|
Financial Activities |
-1,400 | -13,900 | 801,600 |
|
Professional and Business Services |
-4,300 | -10,800 | 2,776,000 |
|
Manufacturing |
-5,300 | -22,800 | 1,313,800 |
|
Construction |
-6,000 | +15,100 | 920,500 |
Total de empleos agrícolas – Aunque el número de empleos en la industria agrícola disminuyó 11,700 desde marzo para alcanzar un total de 414,700 empleos en abril, esta industria cuenta con 30,800 empleos de campo más en abril de 2024 que en abril del año pasado.
Tendencias de los datos sobre trabajadores en la economía
El empleo y desempleo en California (basado en una encuesta federal de 5,100 hogares de California, la cual se enfoca en trabajadores en la economía)
- Empleados – El número de californianos con empleo en abril fue de 18,319,100, un aumento de 5,800 personas del total de 18,313,300 en marzo, y 115,100 menos que el total de empleos en abril de 2023.
- Desempleados – El número de californianos sin empleo en abril fue de 1,027,000, una disminución de 5,900 en todo el mes, y 164,700 más comparado con abril de 2023.
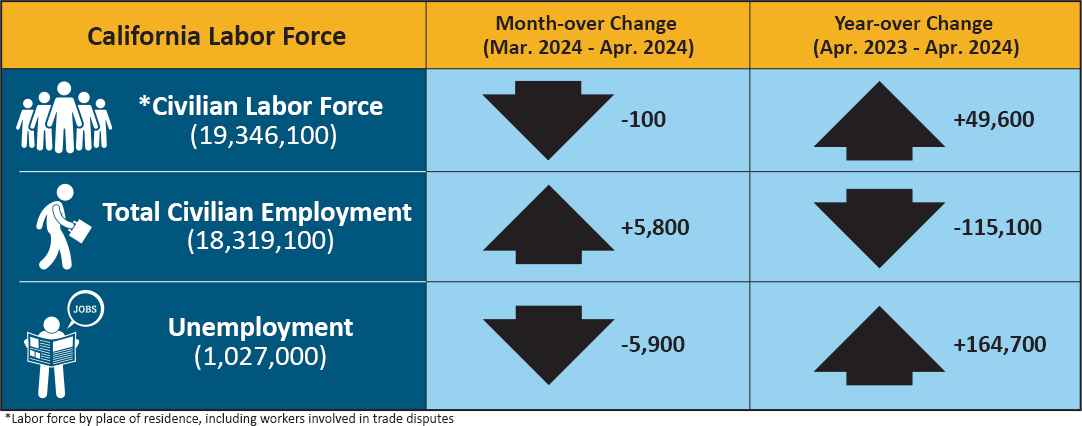
| California Labor Force | Month-over Change (March 2024–April 2024) | Year-over Change (April 2023–April 2024) |
|---|---|---|
| * Civilian Labor Force (19,346,100) | -100 | +49,600 |
| Total Civilian Employment (18,319,100) | +5,800 | -115,100 |
| Unemployment (1,027,000) | -5,900 | +164,700 |
* Labor force by place of residence, including workers involved in trade disputes.
Solicitudes del Seguro de Desempleo (sin ajustes por temporada)
Los siguientes datos provienen de una semana muestra que incluye el 19 de cada mes:
En datos relacionados que figuran en la tasa de desempleo del estado, 411,413 personas certificaron para los beneficios del Seguro de Desempleo (UI) durante la semana muestra de abril de 2024. Esto en comparación con 425,760 personas que certificaron en febrero y 414,119 personas en marzo de 2023
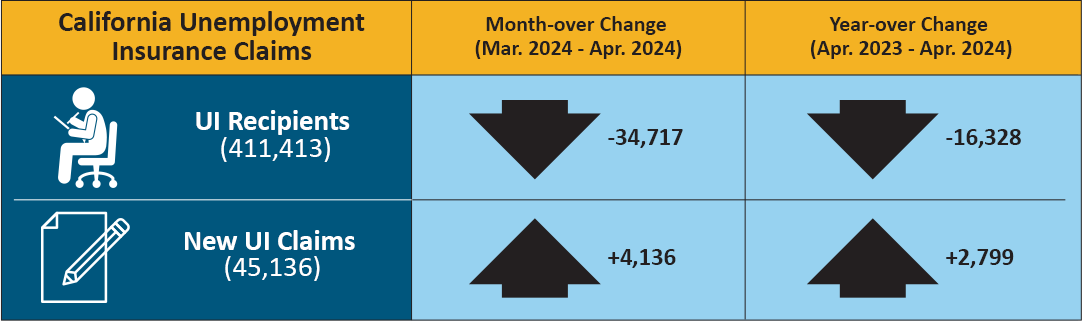
| California Unemployment Insurance Claims | Month-over Change (March 2024–April 2024) | Year-over Change (April 2023–April 2024) |
|---|---|---|
| UI Recipients (411,413) | -34,717 | -16,328 |
| New UI Claims (45,136) | +4,136 | +2,799 |
| COUNTY | LABOR FORCE | EMPLOYMENT | UNEMPLOYMENT | RATE |
|---|---|---|---|---|
| STATE TOTAL | 19,213,200 | 18,281,900 | 931,400 | 4.8% |
| ALAMEDA | 819,300 | 783,700 | 35,700 | 4.4% |
| ALPINE | 580 | 550 | 30 | 5.5% |
| AMADOR | 14,460 | 13,710 | 750 | 5.2% |
| BUTTE | 92,600 | 87,300 | 5,300 | 5.7% |
| CALAVERAS | 22,190 | 21,140 | 1,040 | 4.7% |
| COLUSA | 10,790 | 9,120 | 1,660 | 15.4% |
| CONTRA COSTA | 546,700 | 522,600 | 24,100 | 4.4% |
| DEL NORTE | 9,040 | 8,520 | 520 | 5.8% |
| EL DORADO | 94,500 | 90,500 | 4,000 | 4.2% |
| FRESNO | 462,500 | 423,500 | 38,900 | 8.4% |
| GLENN | 12,690 | 11,820 | 870 | 6.8% |
| HUMBOLDT | 60,100 | 57,200 | 2,900 | 4.9% |
| IMPERIAL | 71,500 | 60,300 | 11,200 | 15.7% |
| INYO | 8,420 | 8,100 | 320 | 3.8% |
| KERN | 396,800 | 360,000 | 36,800 | 9.3% |
| KINGS | 58,900 | 53,500 | 5,400 | 9.2% |
| LAKE | 28,400 | 26,710 | 1,690 | 6.0% |
| LASSEN | 8,580 | 8,060 | 520 | 6.1% |
| LOS ANGELES | 4,968,200 | 4,743,800 | 224,300 | 4.5% |
| MADERA | 65,100 | 59,700 | 5,400 | 8.3% |
| MARIN | 131,300 | 126,800 | 4,500 | 3.4% |
| MARIPOSA | 7,340 | 6,950 | 390 | 5.4% |
| MENDOCINO | 37,320 | 35,450 | 1,870 | 5.0% |
| MERCED | 120,500 | 107,800 | 12,700 | 10.5% |
| MODOC | 3,240 | 3,010 | 230 | 7.1% |
| MONO | 9,170 | 8,840 | 330 | 3.6% |
| MONTEREY | 222,400 | 204,600 | 17,800 | 8.0% |
| NAPA | 72,000 | 69,300 | 2,700 | 3.8% |
| NEVADA | 48,900 | 46,860 | 2,050 | 4.2% |
| ORANGE | 1,580,400 | 1,522,600 | 57,800 | 3.7% |
| PLACER | 196,100 | 188,400 | 7,700 | 3.9% |
| PLUMAS | 7,270 | 6,610 | 660 | 9.1% |
| RIVERSIDE | 1,151,100 | 1,095,200 | 55,900 | 4.9% |
| SACRAMENTO | 735,300 | 702,000 | 33,300 | 4.5% |
| SAN BENITO | 32,200 | 30,000 | 2,200 | 6.7% |
| SAN BERNARDINO | 1,008,100 | 960,100 | 47,900 | 4.8% |
| SAN DIEGO | 1,588,000 | 1,522,700 | 65,200 | 4.1% |
| SAN FRANCISCO | 552,700 | 533,700 | 19,000 | 3.4% |
| SAN JOAQUIN | 346,700 | 323,800 | 22,900 | 6.6% |
| SAN LUIS OBISPO | 135,700 | 130,900 | 4,800 | 3.5% |
| SAN MATEO | 437,500 | 423,200 | 14,300 | 3.3% |
| SANTA BARBARA | 220,000 | 210,700 | 9,300 | 4.2% |
| SANTA CLARA | 1,025,800 | 986,600 | 39,200 | 3.8% |
| SANTA CRUZ | 132,400 | 123,500 | 8,900 | 6.7% |
| SHASTA | 74,200 | 70,100 | 4,100 | 5.5% |
| SIERRA | 1,310 | 1,230 | 90 | 6.5% |
| SISKIYOU | 16,270 | 15,180 | 1,090 | 6.7% |
| SOLANO | 203,400 | 193,400 | 10,000 | 4.9% |
| SONOMA | 248,700 | 239,100 | 9,600 | 3.8% |
| STANISLAUS | 247,700 | 230,300 | 17,400 | 7.0% |
| SUTTER | 47,700 | 43,500 | 4,200 | 8.8% |
| TEHAMA | 25,840 | 24,210 | 1,630 | 6.3% |
| TRINITY | 4,520 | 4,230 | 290 | 6.5% |
| TULARE | 214,700 | 191,500 | 23,200 | 10.8% |
| TUOLUMNE | 19,760 | 18,690 | 1,080 | 5.5% |
| VENTURA | 413,400 | 395,900 | 17,500 | 4.2% |
| YOLO | 110,600 | 105,000 | 5,600 | 5.1% |
| YUBA | 32,600 | 30,200 | 2,400 | 7.3% |