NR No. 22-28
Contact: Loree Levy/Aubrey Henry
916-654-9029
mediainquiries@edd.ca.gov
IMPORTANT NOTE: The employment data for the month of July 2022 is taken from the survey week including July 12. Data for the month of August is scheduled for release on September 16, 2022.
Employers added 84,800 nonfarm payroll jobs
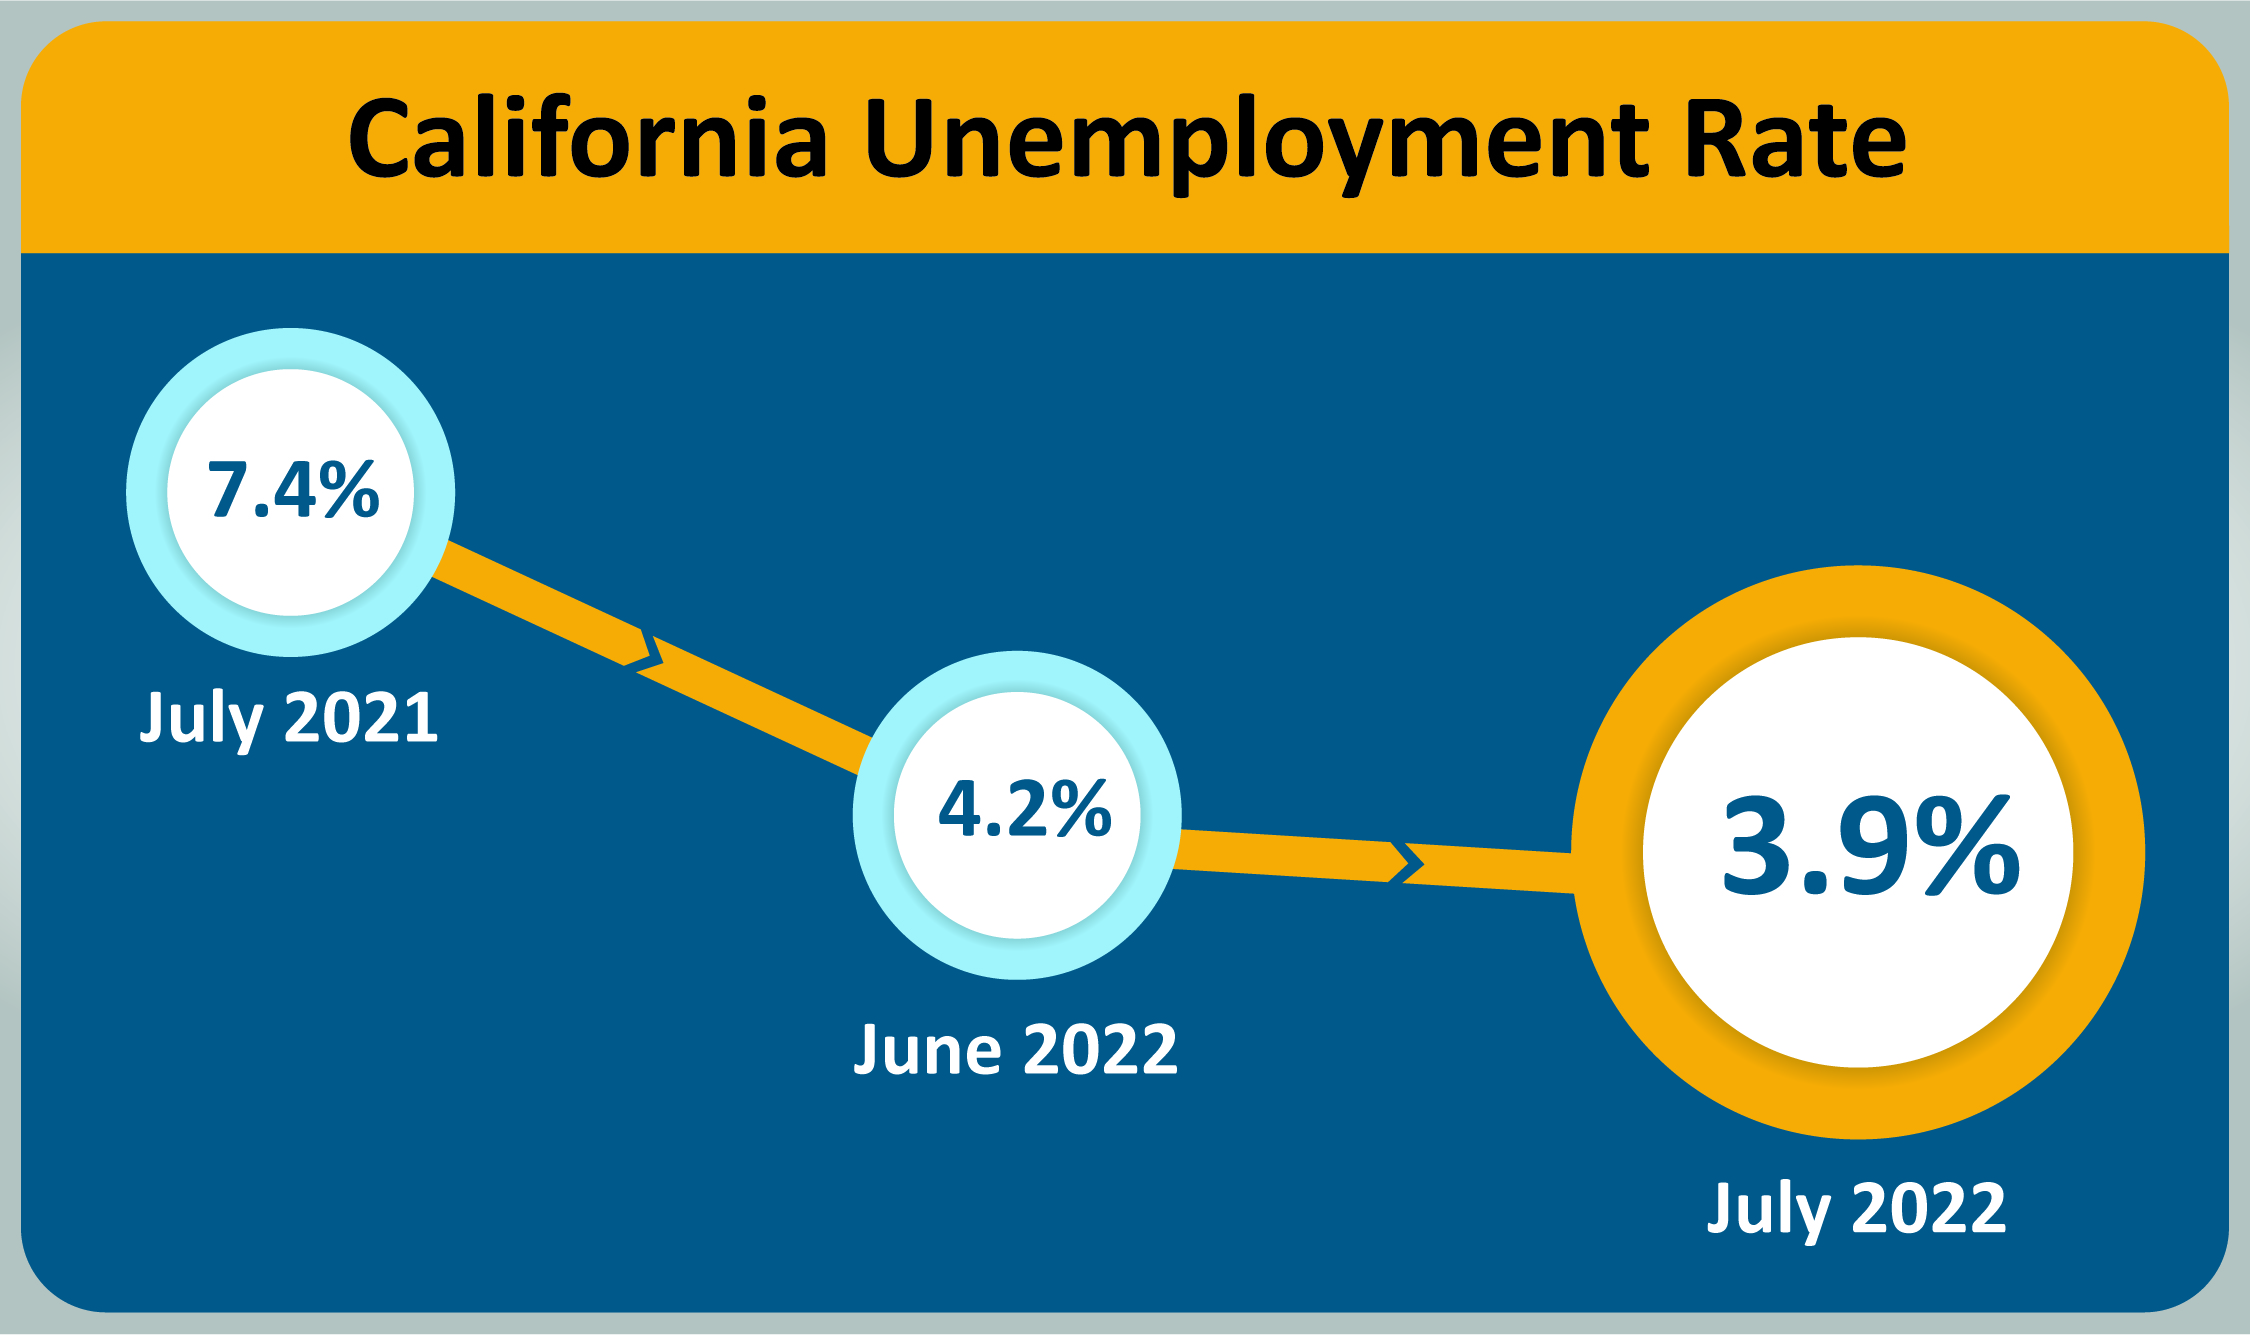
SACRAMENTO – California’s unemployment rate decreased to a new record low in the month of July 2022 to 3.9 percent1 as the state’s employers added 84,800 nonfarm payroll jobs2 to the economy, according to data released today by the California Employment Development Department (EDD) from two surveys.
California’s Labor Market, by the Numbers...
- California’s July 2022 unemployment rate of 3.9 percent is the lowest ever on record in a data series that dates back to 1976.
- The state has now regained 97.3 percent (2,685,100) of the 2,758,900 nonfarm jobs lost during March and April of 2020 due to the COVID-19 pandemic. As of July 2022, California’s private sector (non-government) has fully recovered from pandemic losses.
- July 2022 marked the 10th consecutive month of nonfarm job gains and the 13th consecutive month of losses in unemployment.
- Seventeen of the past 18 months showed month-over nonfarm job gains totaling 1.6 million jobs over that time period.
- Ten of California’s 11 industry sectors gained jobs in July with Professional & Business Services and Educational & Health Services both up 20,500 jobs since June 2022. The former saw above-average gains in Computer Systems Design, Advertising, and Investigation & Security Services, while the latter saw increases in Offices of Other Healthcare Practitioners, Nursing & Residential Care Facilities, and Individual & Family Services.
- Financial Activities (-1,900) was the only industry sector to post a month-over job loss due mainly to reductions in Insurance Carriers.
1. The unemployment rate comes from a separate federal survey of 5,100 California households.
2. The nonfarm payroll job numbers come from a federal survey of 80,000 California businesses.
Data Trends about Jobs in the Economy
Total Nonfarm Payroll Jobs
This comes from a monthly survey of approximately 80,000 California businesses that estimates jobs in the economy – seasonally adjusted.
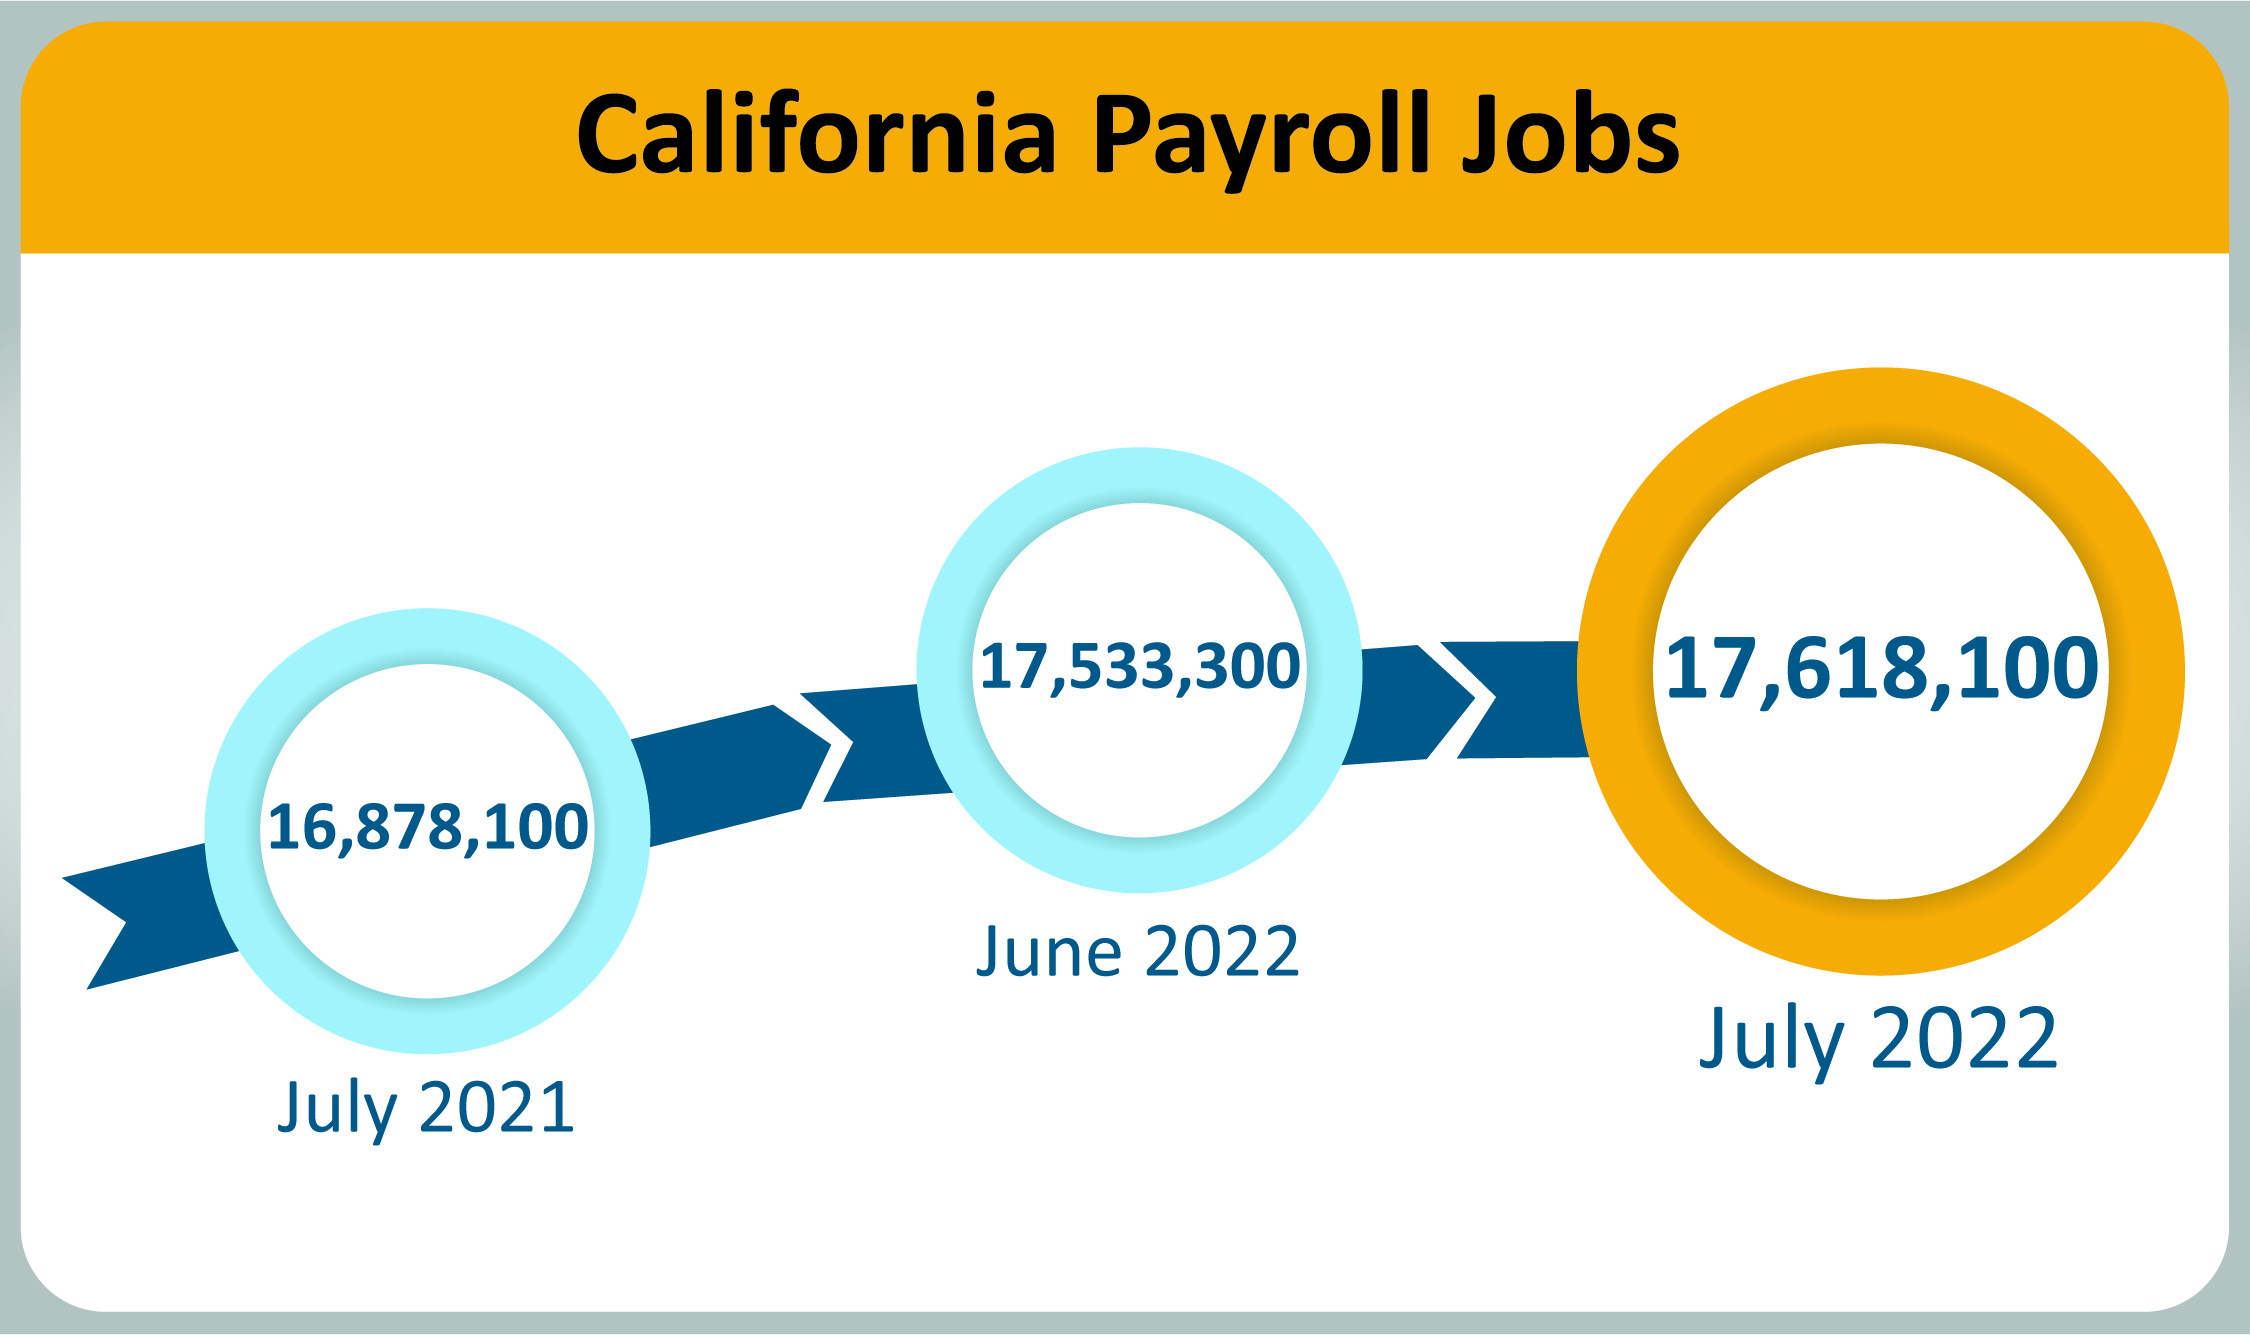
- Month-over – Total nonfarm jobs in California’s 11 major industries totaled 17,618,100 in July – a net gain 84,800 jobs from June. This followed an upwards revised (+17,400) month-over gain of 37,300 jobs in June.
- Year-over – Total nonfarm jobs increased by 740,000 (a 4.4 percent increase) from July 2021 to July 2022 compared to the U.S. annual gain of 6,149,000 jobs (a 4.2 percent increase).
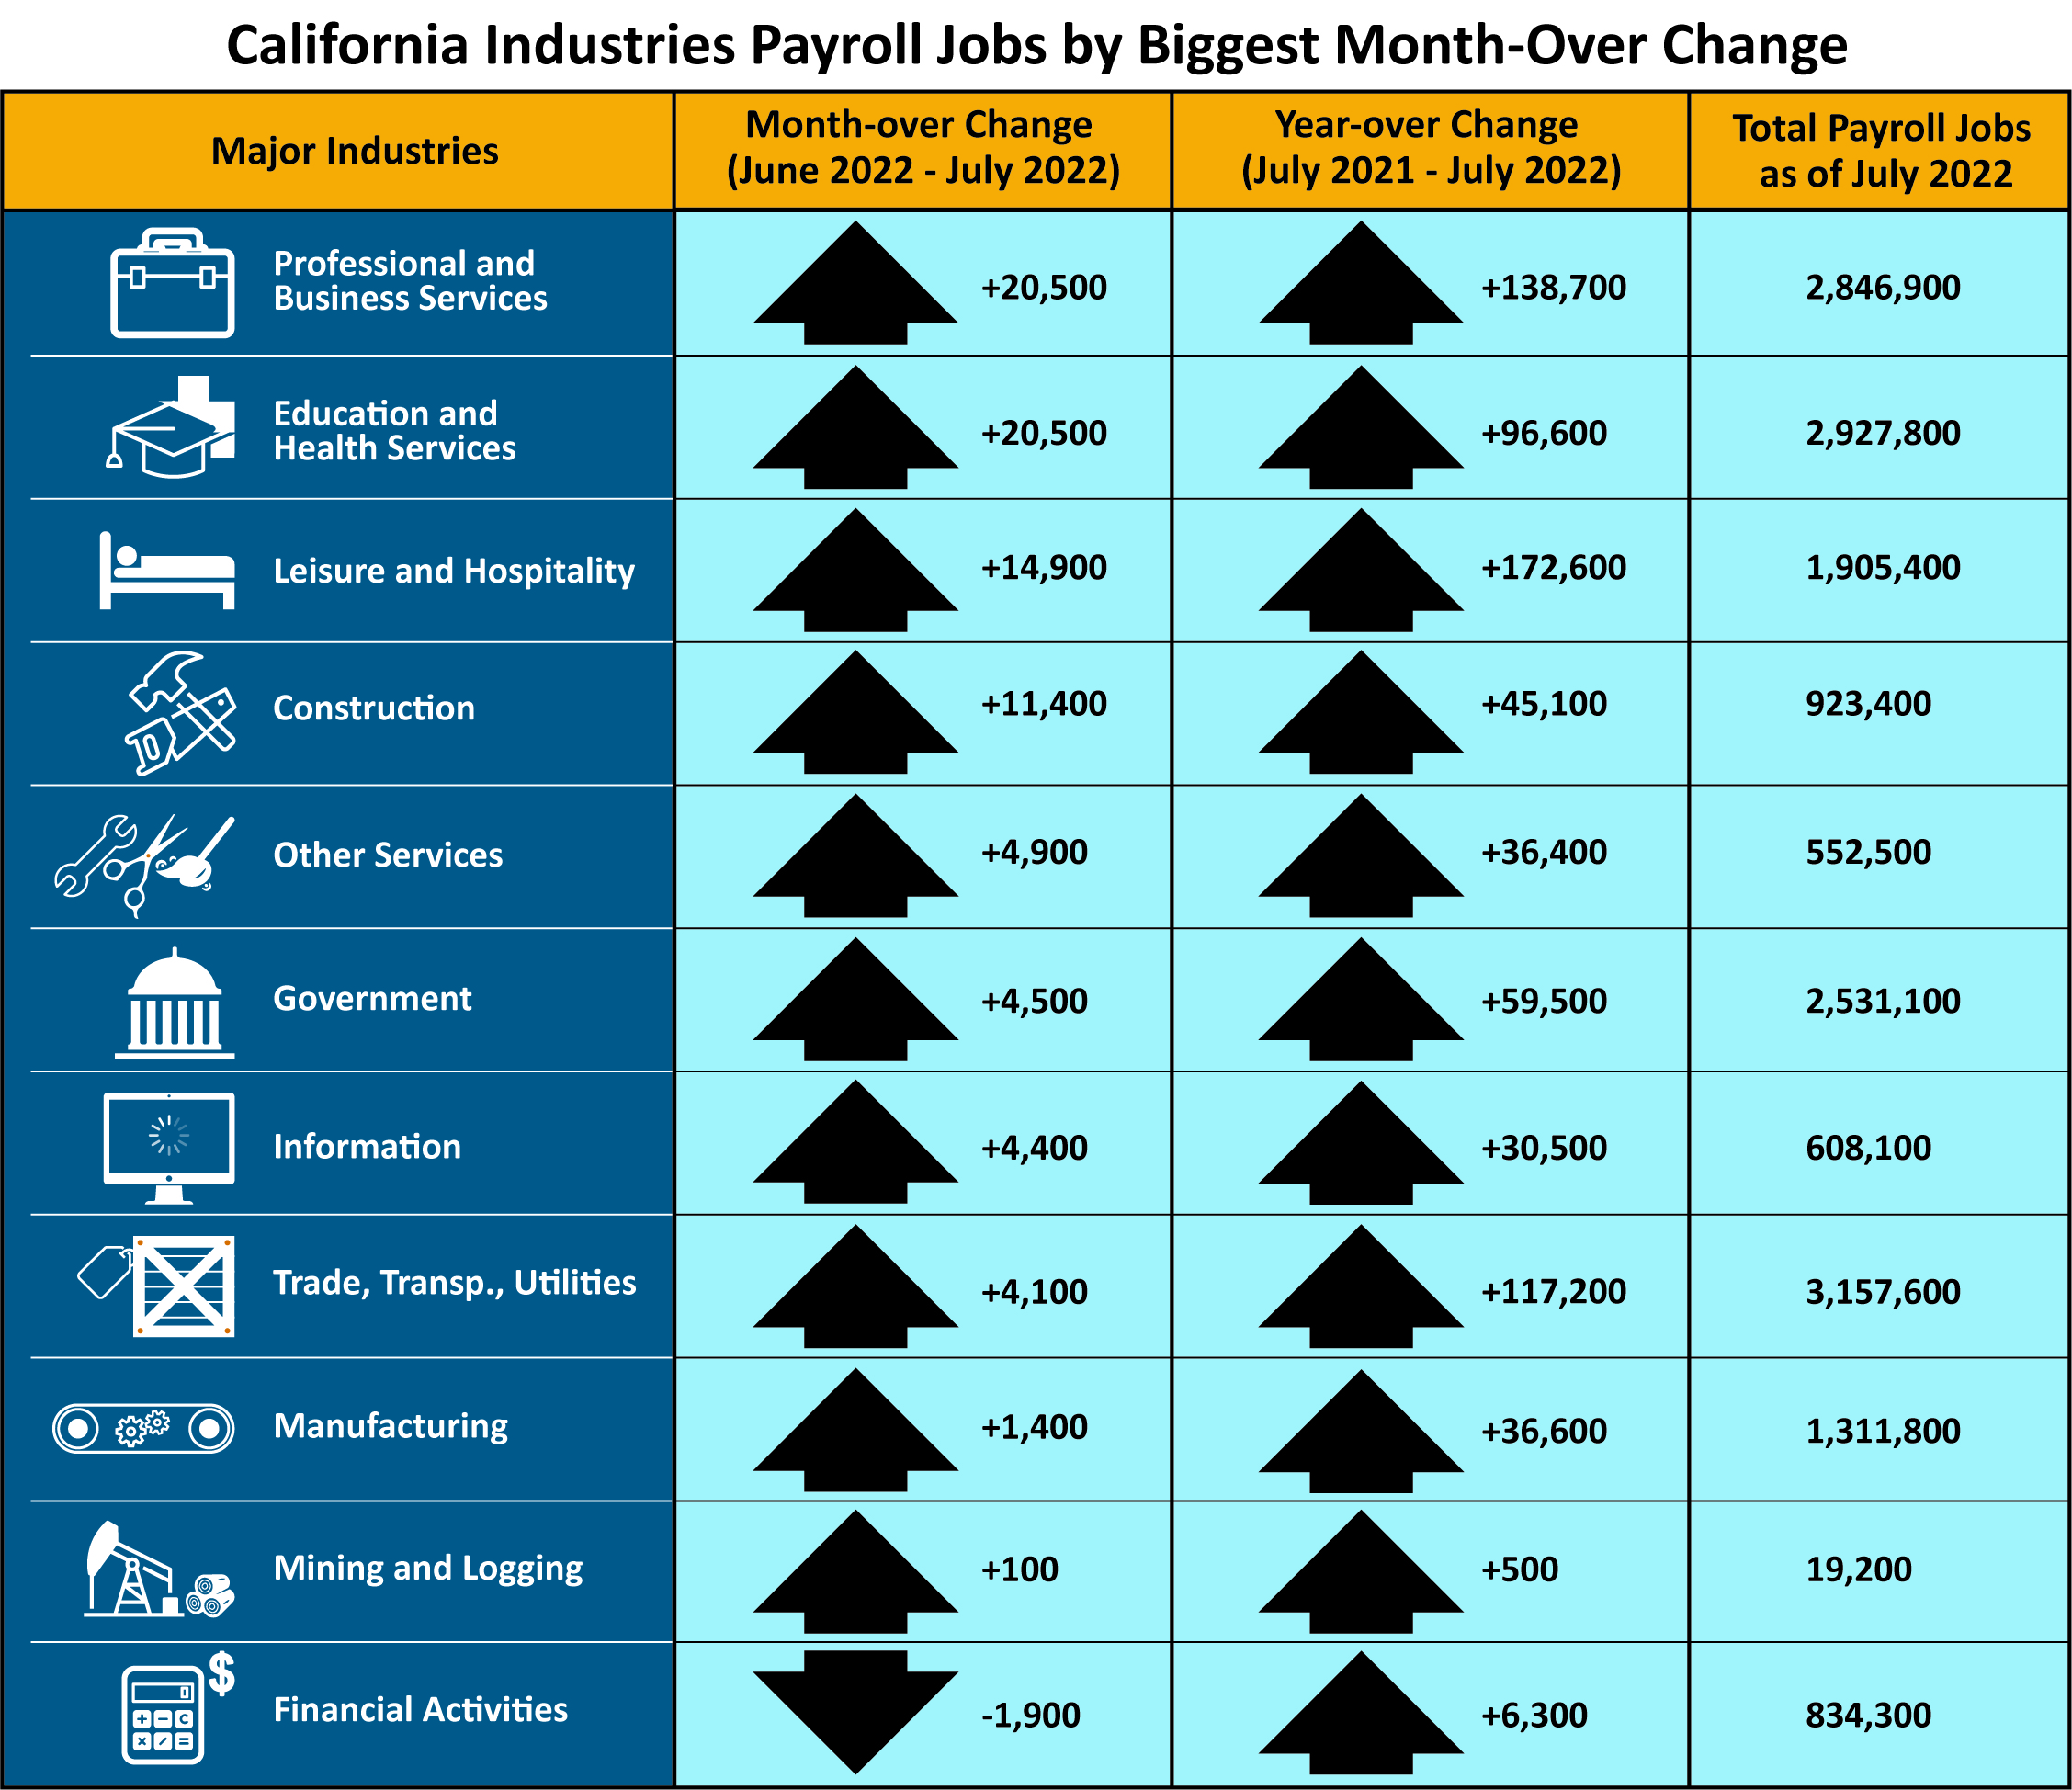
| Major Industries | Month-over Change (June 2022–July 2022) | Year-over Change (July 2021–July 2022) | Total Payroll Jobs as of July 2022 |
|---|---|---|---|
| Professional and Business Services | +20,500 | +138,700 | 2,846,900 |
| Education and Health Services | +20,500 | +96,600 | 2,927,800 |
| Leisure and Hospitality | +14,900 | +172,600 | 1,905,400 |
| Construction | +11,400 | +45,100 | 923,400 |
|
Other Services |
+4,900 | +36,400 | 552,500 |
| Government | +4,500 | +59,500 | 2,531,100 |
|
Information |
+4,400 | +30,500 | 608,100 |
| Trade, Transp., Utilities | +4,100 | +117,200 | 3,157,600 |
| Manufacturing | +1,400 | +36,600 | 1,311,800 |
| Mining and Logging | +100 | +500 | 19,200 |
| Financial Activities | -1,900 | +6,300 | 834,300 |
Total Farm jobs – The number of jobs in the agriculture industry increased from June by 1,400 to total 415,100 jobs in July. The agricultural industry had 6,700 more farm jobs in July 2022 than it did in July a year ago.
Data Trends about Workers in the Economy
Employment and Unemployment in California
This information is based on a monthly federal survey of 5,100 California households which focuses on workers in the economy.
- Employed – The number of Californians employed in July was 18,586,200, an increase of 23,500 persons from June’s total of 18,544,700 and up 958,600 from the employment total in July 2021.
- Unemployed – The number of unemployed Californians was 758,700 in July, a decrease of 46,800 over the month and down 648,000 in comparison to July 2021.
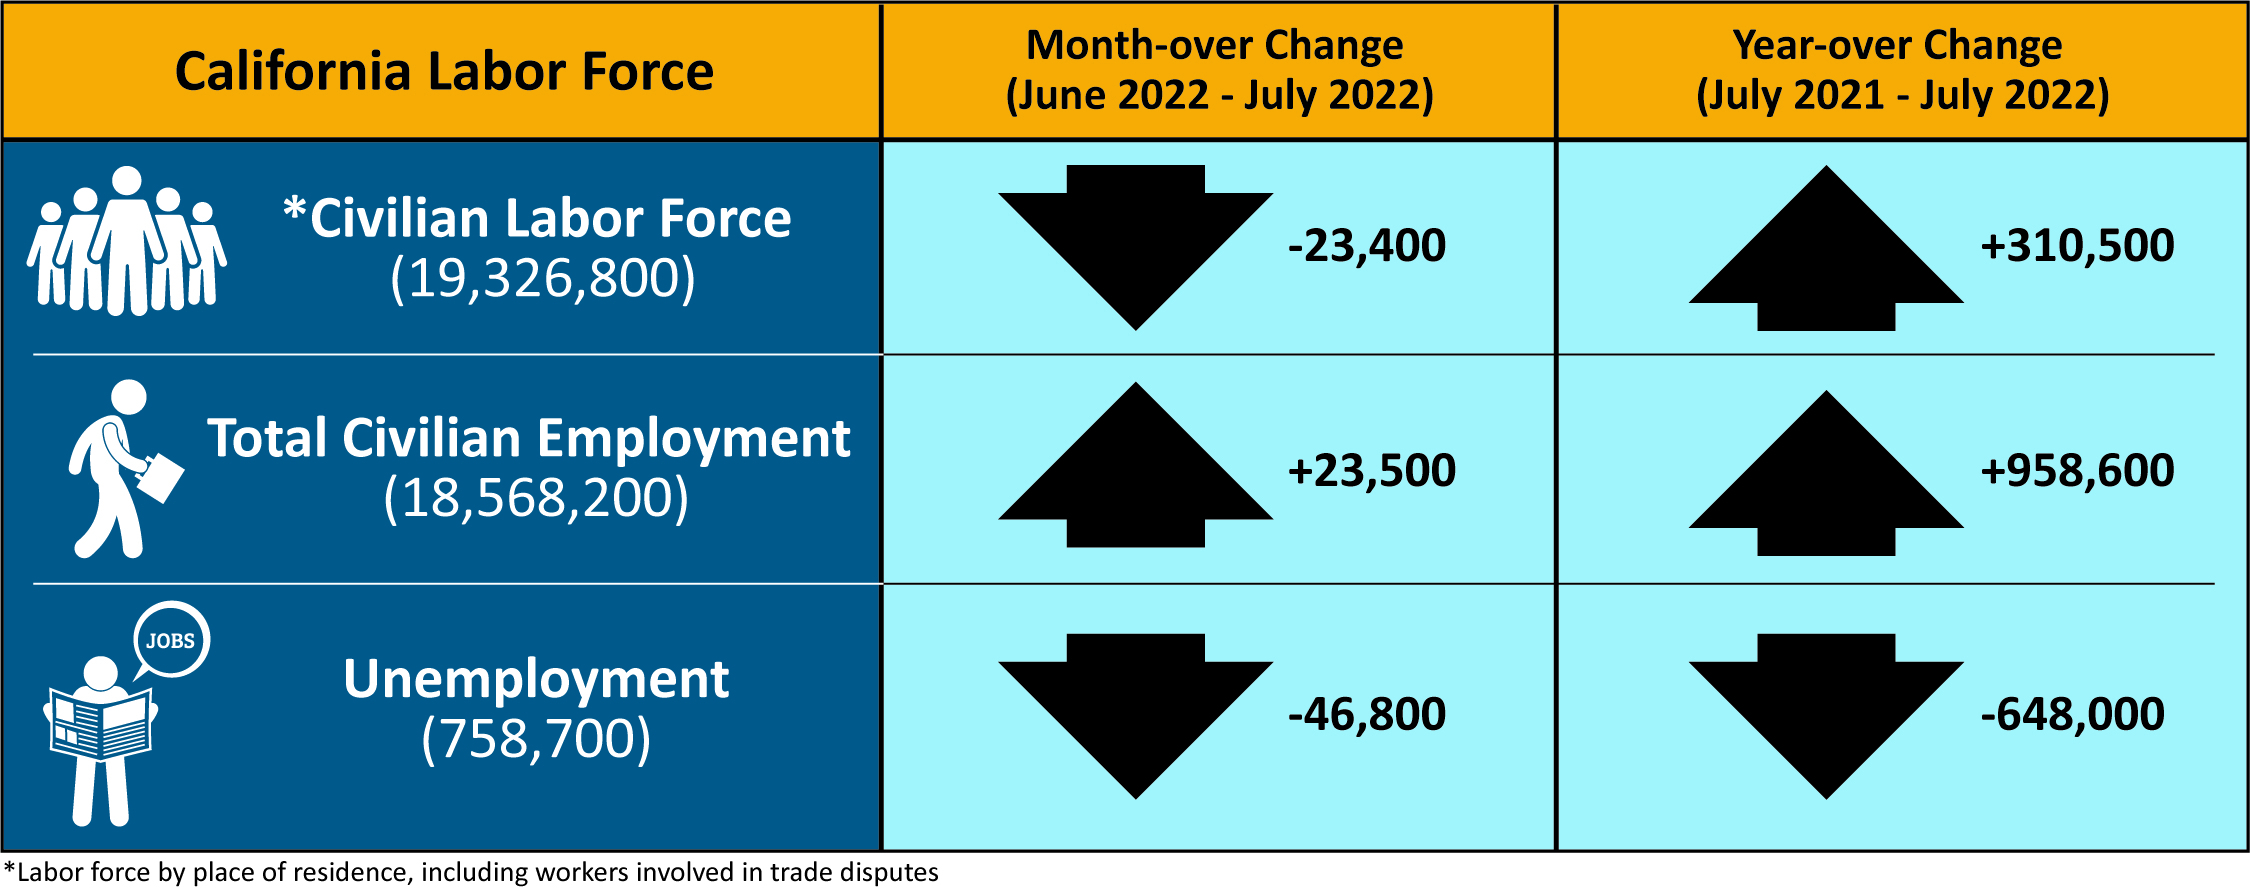
| California Labor Force | Month-over Change (June 2022–July 2022) | Year-over Change (July 2021–July 2022) |
|---|---|---|
| * Civilian Labor Force (19,326,800) | -23,400 | +310,500 |
| Total Civilian Employment (18,568,200) | +23,500 | +958,600 |
| Unemployment (758,700) | -46,800 | -648,000 |
* Labor force by place of residence, including workers involved in trade disputes.
Unemployment Insurance Claims (Not Seasonally Adjusted)
The following data is from a sample week that includes the 19th of each month: In related data that figures into the state’s unemployment rate, there were 316,263 people certifying for Unemployment Insurance benefits during the July 2022 sample week. That compares to 296,570 people in June and 834,513 people in July 2021. Concurrently, 40,179 initial claims were processed in the July 2022 sample week, which was a month-over decrease of 1,427 claims from June and a year-over decrease of 24,463 claims from June 2021.
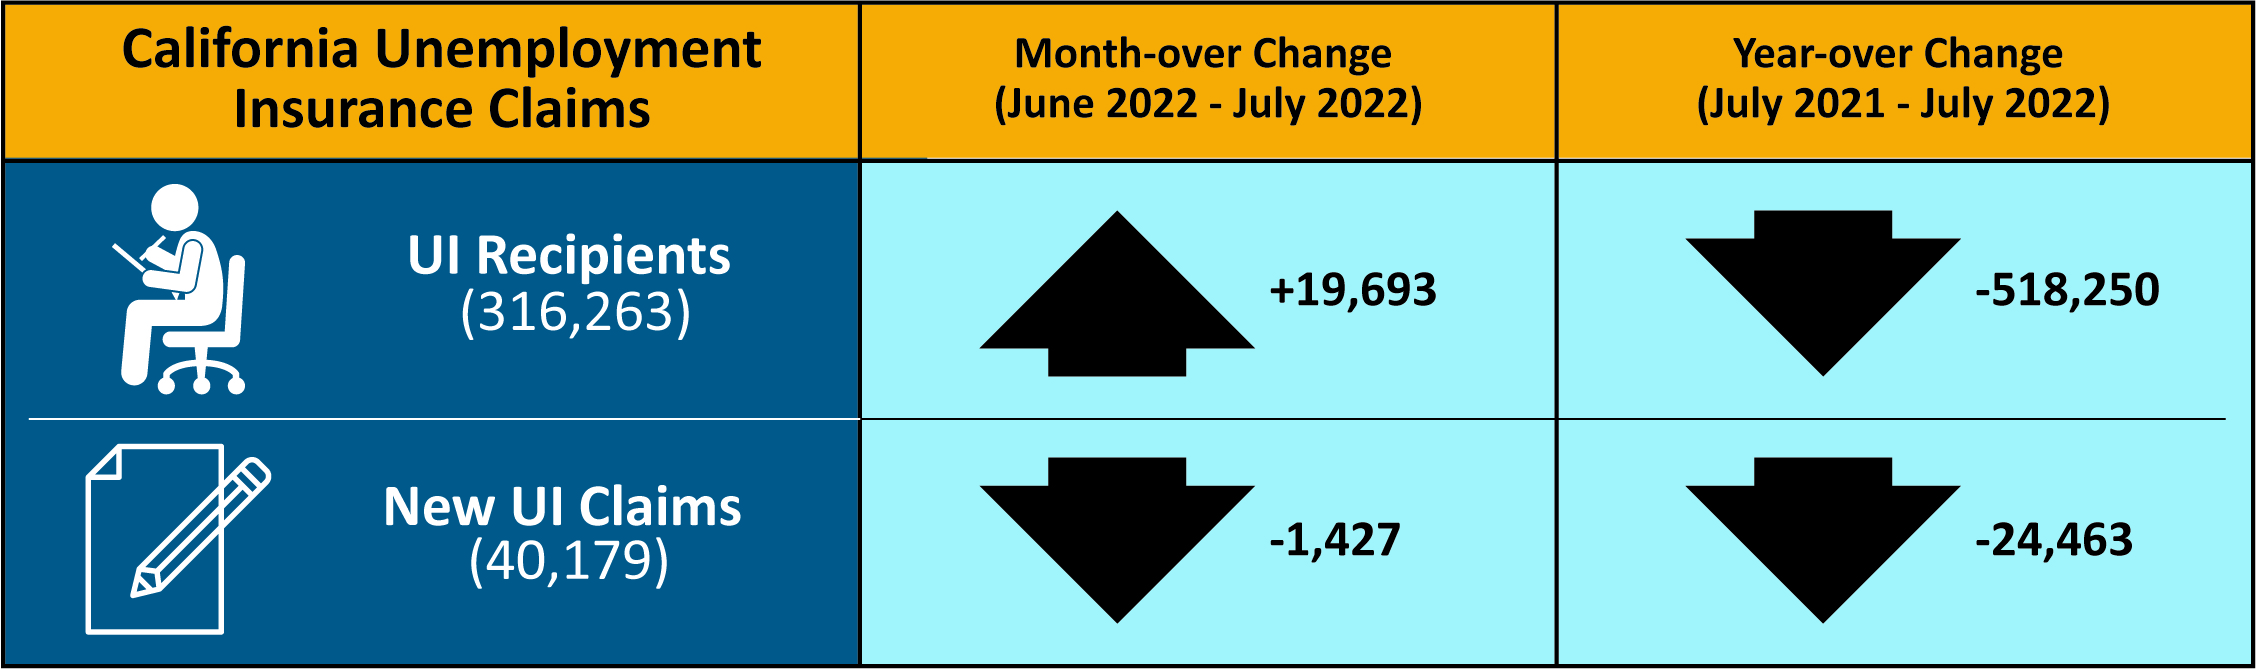
| California Unemployment Insurance Claims | Month-over Change (June 2022–July 2022) | Year-over Change (July 2021–July 2022) |
|---|---|---|
| UI Recipients (316,263) | +19,693 | -518,250 |
| New UI Claims (40,179) | -1,427 | -24,463 |
| COUNTY | LABOR FORCE | EMPLOYMENT | UNEMPLOYMENT | RATE |
|---|---|---|---|---|
| STATE TOTAL | 19,237,100 | 18,486,400 | 750,800 | 3.9% |
| ALAMEDA | 828,900 | 805,200 | 23,800 | 2.9% |
| ALPINE | 460 | 440 | 20 | 5.2% |
| AMADOR | 14,470 | 13,930 | 540 | 3.7% |
| BUTTE | 90,300 | 86,700 | 3,600 | 4.0% |
| CALAVERAS | 22,040 | 21,390 | 650 | 3.0% |
| COLUSA | 11,300 | 10,410 | 900 | 7.9% |
| CONTRA COSTA | 553,800 | 536,600 | 17,200 | 3.1% |
| DEL NORTE | 9,200 | 8,770 | 430 | 4.6% |
| EL DORADO | 92,800 | 90,200 | 2,500 | 2.7% |
| FRESNO | 455,900 | 430,200 | 25,700 | 5.6% |
| GLENN | 12,730 | 12,140 | 590 | 4.7% |
| HUMBOLDT | 59,000 | 57,000 | 2,000 | 3.4% |
| IMPERIAL | 67,700 | 58,100 | 9,600 | 14.2% |
| INYO | 8,360 | 8,110 | 250 | 3.0% |
| KERN | 384,500 | 359,300 | 25,300 | 6.6% |
| KINGS | 56,200 | 52,700 | 3,400 | 6.1% |
| LAKE | 28,680 | 27,470 | 1,220 | 4.2% |
| LASSEN | 8,910 | 8,600 | 310 | 3.5% |
| LOS ANGELES | 4,974,600 | 4,724,100 | 250,600 | 5.0% |
| MADERA | 61,900 | 58,500 | 3,500 | 5.6% |
| MARIN | 131,200 | 128,400 | 2,800 | 2.1% |
| MARIPOSA | 7,500 | 7,230 | 280 | 3.7% |
| MENDOCINO | 37,870 | 36,640 | 1,230 | 3.2% |
| MERCED | 116,700 | 108,900 | 7,800 | 6.7% |
| MODOC | 3,270 | 3,140 | 120 | 3.8% |
| MONO | 9,080 | 8,800 | 280 | 3.1% |
| MONTEREY | 221,800 | 212,300 | 9,500 | 4.3% |
| NAPA | 70,600 | 68,800 | 1,800 | 2.6% |
| NEVADA | 48,490 | 47,160 | 1,330 | 2.7% |
| ORANGE | 1,595,100 | 1,550,800 | 44,300 | 2.8% |
| PLACER | 192,700 | 187,900 | 4,900 | 2.5% |
| PLUMAS | 7,950 | 7,580 | 380 | 4.7% |
| RIVERSIDE | 1,157,400 | 1,111,600 | 45,800 | 4.0% |
| SACRAMENTO | 724,900 | 699,000 | 25,800 | 3.6% |
| SAN BENITO | 33,100 | 31,800 | 1,300 | 4.1% |
| SAN BERNARDINO | 1,012,000 | 972,400 | 39,700 | 3.9% |
| SAN DIEGO | 1,576,600 | 1,527,700 | 48,900 | 3.1% |
| SAN FRANCISCO | 576,400 | 564,200 | 12,200 | 2.1% |
| SAN JOAQUIN | 334,400 | 317,800 | 16,600 | 5.0% |
| SAN LUIS OBISPO | 137,500 | 134,100 | 3,500 | 2.5% |
| SAN MATEO | 456,100 | 447,200 | 8,900 | 1.9% |
| SANTA BARBARA | 222,500 | 216,300 | 6,200 | 2.8% |
| SANTA CLARA | 1,052,900 | 1,030,500 | 22,400 | 2.1% |
| SANTA CRUZ | 137,600 | 132,600 | 5,000 | 3.7% |
| SHASTA | 72,600 | 69,700 | 2,800 | 3.9% |
| SIERRA | 1,390 | 1,350 | 40 | 2.9% |
| SISKIYOU | 16,910 | 16,170 | 750 | 4.4% |
| SOLANO | 201,200 | 193,300 | 7,900 | 3.9% |
| SONOMA | 249,500 | 243,100 | 6,400 | 2.6% |
| STANISLAUS | 242,000 | 229,900 | 12,100 | 5.0% |
| SUTTER | 46,800 | 44,200 | 2,500 | 5.4% |
| TEHAMA | 25,800 | 24,700 | 1,100 | 4.3% |
| TRINITY | 4,560 | 4,400 | 160 | 3.5% |
| TULARE | 200,900 | 185,700 | 15,200 | 7.6% |
| TUOLUMNE | 20,070 | 19,290 | 780 | 3.9% |
| VENTURA | 409,200 | 396,200 | 13,000 | 3.2% |
| YOLO | 109,600 | 106,100 | 3,500 | 3.2% |
| YUBA | 31,100 | 29,600 | 1,500 | 4.9% |